


 menu
Struggle, Reform, Boom and Bust
Annex B: Economic figures
Unless otherwise indicated, these figures are drawn from the PNG Economic Database (devpolicy.org/pngeconomic/). The database, as well as Howes, Fox et al. (2022), can be consulted for further information on underlying sources and definitions.
Most of the graphs are divided into the four periods that provide the basis for the book’s analysis: the seventies and eighties (1975–88), the nineties (1989–2003), the noughties (2004–13) and the tens (2014–22).
Population
Based on rough estimates—PNG’s last reliable census was in 2001—PNG’s population has more than tripled since independence, from 2.8 million in 1975 to 9.3 million in 2022 (Figure B1). Other estimates put the PNG population at above 10 million. According to our estimates, PNG gained some 250,000 citizens in 2022—9 per cent of the population at the time of independence.
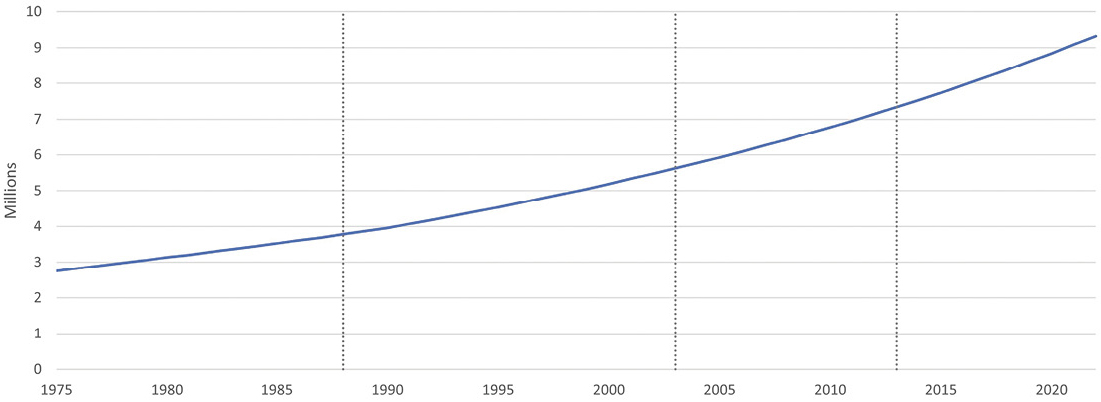
Figure B1: Population, 1975–2022
Source: Annual figures interpolated from Bourke and Allen’s (2021) decadal medium-case estimates.
GDP and non-resource GDP
The volatility of PNG’s growth is evident, especially when the resource sector is included (Figure B2). GDP and non-resource GDP per person are shown in Figure 1.2.
The PNG economy has become increasingly resource dependent (Figure B3). The resource (mining and petroleum) sector (sometimes called the mineral sector in PNG) made up as little as 6 per cent of PNG’s GDP in 1984, a year of low copper prices. Since then, resource dependency has fluctuated due to the opening and closing of large mines and wells and changing commodity prices. But the trend has clearly been upwards, and in 2022 resource dependency reached an all-time high of 32 per cent.
The structure of the non-resource sector is quite stable (Figure B4). The agricultural share is normally between 20 and 25 per cent of non-resource GDP. Manufacturing, wholesale and retail, and transport shares are slightly declining, and construction is increasing.
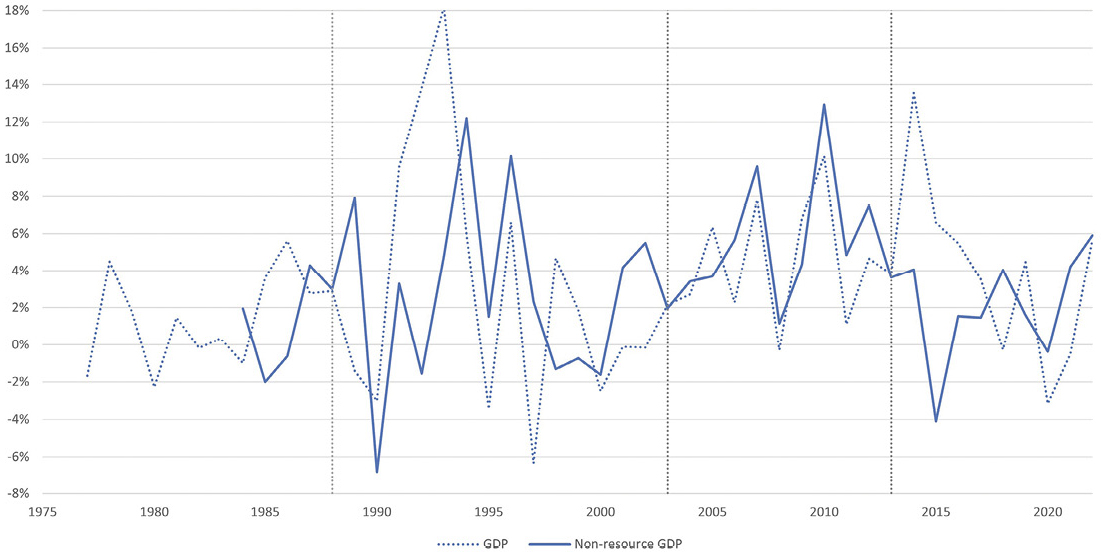
Figure B2: GDP and non-resource GDP growth, 1976–2022 (kina, constant prices)
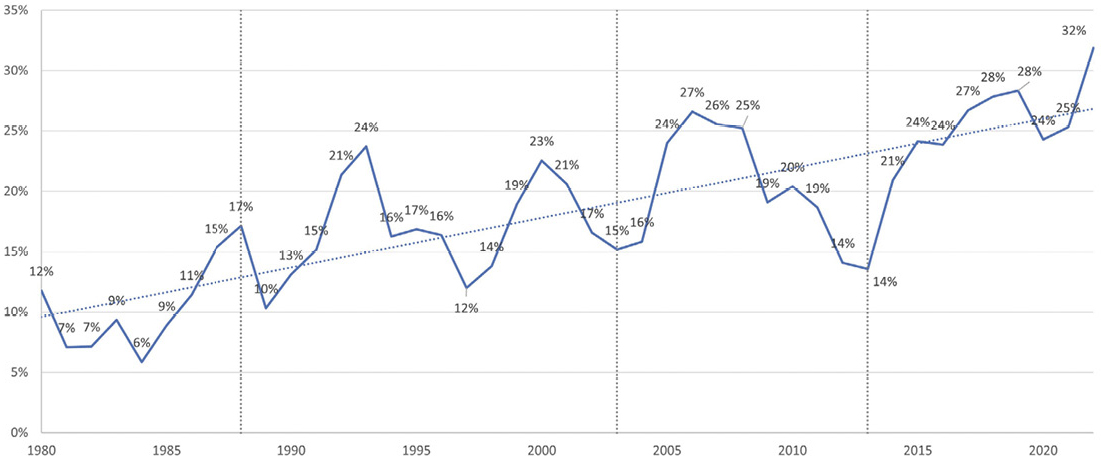
Figure B3: Resource dependency, 1980–2022
Notes: The percentage share of resources (value-added [output minus intermediate inputs] in the resource sector) in total GDP, both measured in current prices. Trendline added.
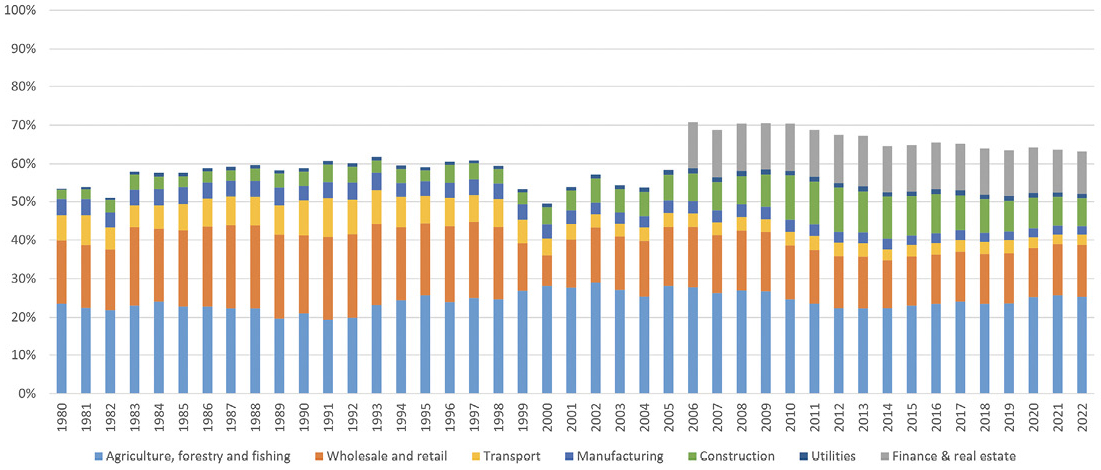
Figure B4: Sectoral composition of non-resource GDP, 1980–2022
Notes: All variables are measured in current prices. The finance and real estate series is unreliable before 2006.
Commodity production, values and prices
The PNG economy relies heavily and increasingly on commodity, and especially resource, exports (Figure B5). The ratio of commodity exports to GDP has increased since independence, from around 25 per cent in the late seventies to a peak of 49 per cent in 2006—the height of the resource boom. Thereafter, commodity exports to GDP dropped, returning almost to independence levels in 2013, but then they recovered due to the commencement of LNG production.
At independence, resource (mineral and petroleum) exports made up half of all commodity exports (Figure B6). Over time, the former have come to dominate PNG’s commodity exports, reaching over 80 per cent for most years since 2005, and, recently, sometimes close to 90 per cent.
The performance of traditional cash crops (other than palm oil) has been dismal (Figure B7). None of the crops shows a positive growth trajectory.
The export performance of marine products, logs and especially palm oil has been impressive (Figure B8).
At independence, PNG non-resource commodity exports were dominated by coffee, cocoa and copra, which made up more than 80 per cent (Figure B9). Coffee alone was half. In 2022, these three traditional crops made up less than 20 per cent.
Gold and copper have been exported since independence (Figure B10). Gold is the stand-out performer, with production more than tripling by volume since independence, though falling in recent years due to the temporary closure of Porgera. Copper production is now only at half the level of independence. Oil exports began in 1992, peaked by volume the following year and have fallen ever since. Cobalt and nickel started in 2012 and LNG in 2014.
Copper once dominated PNG’s exports by value, but not anymore (Figure B11). Gold has remained an important export, and LNG has become the most important one. Oil became the most important export in the nineties but is unimportant now.
After the coffee and cocoa boom that followed independence, the eighties and nineties were a period of commodity price stagnation or decline (Figure B12). Then everything changed. Resources prices rocketed upwards to well above their level at independence. They declined somewhat in the tens, but then increased again in 2022 with the Ukraine war. Non-resource commodity prices have fallen compared to their levels at independence. However, because resources increasingly dominate commodity production, the overall commodity price index has increased to record levels.
Coffee and cocoa prices have fallen by more than half relative to inflation compared to independence (Figure B13). Palm oil and logs have done better, though log prices have fallen from their high of the mid-nineties.
The domestic purchasing power of PNG’s resource exports has improved over time (Figure B14). Resource prices all peaked during the boom period; they largely recovered over the course of the bust. (The price of gas is not shown but is linked to the price of oil.)
Adjusting for inflation, agricultural exports show no growth since independence (Figure B15). Timber and marine product exports have grown but remain small in absolute size. Resource exports have grown in fits and starts but overall strongly, from PGK4 billion in 1976 to PGK43 billion in 2022 (in 2022 prices).
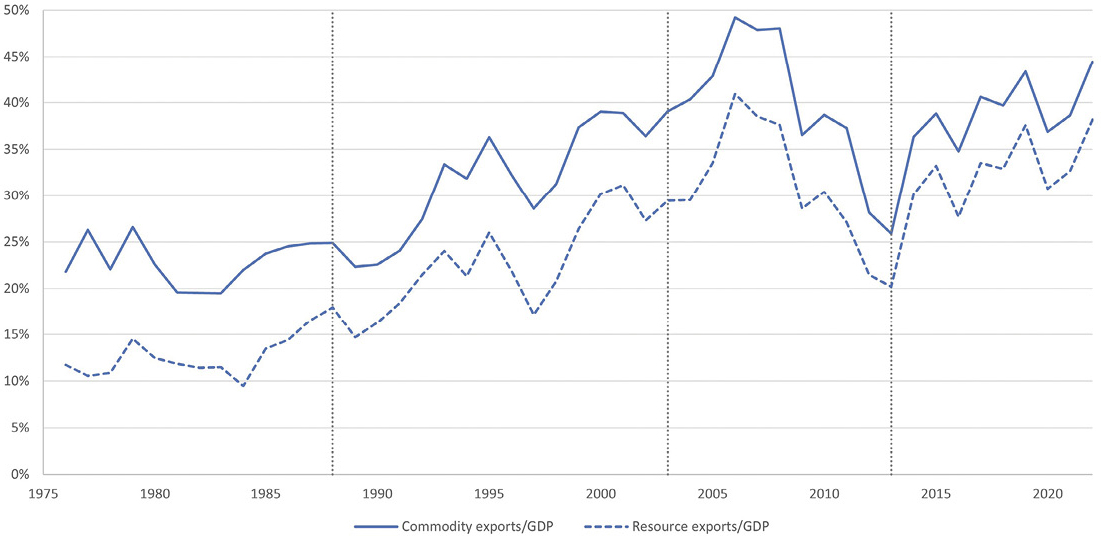
Figure B5: Commodity and resource exports as a percentage of GDP, 1976–2022
Notes: Both variables are measured in current prices. Commodity exports include resource (mining and petroleum) exports, and agricultural cash crops, timber and marine products.
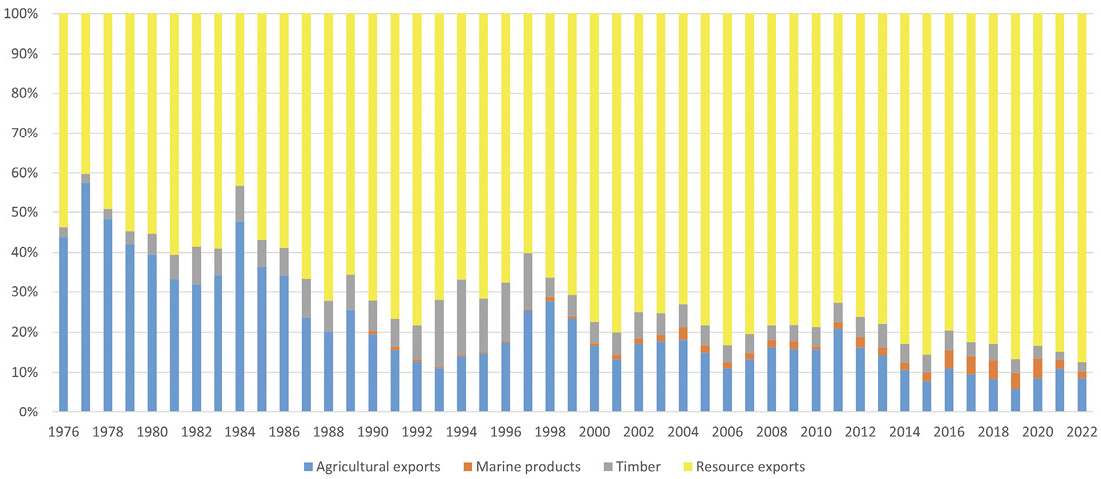
Figure B6: The composition of commodity exports by value, 1976–2022
Notes: All variables are measured in current prices. Timber exports are logs and other forest products.
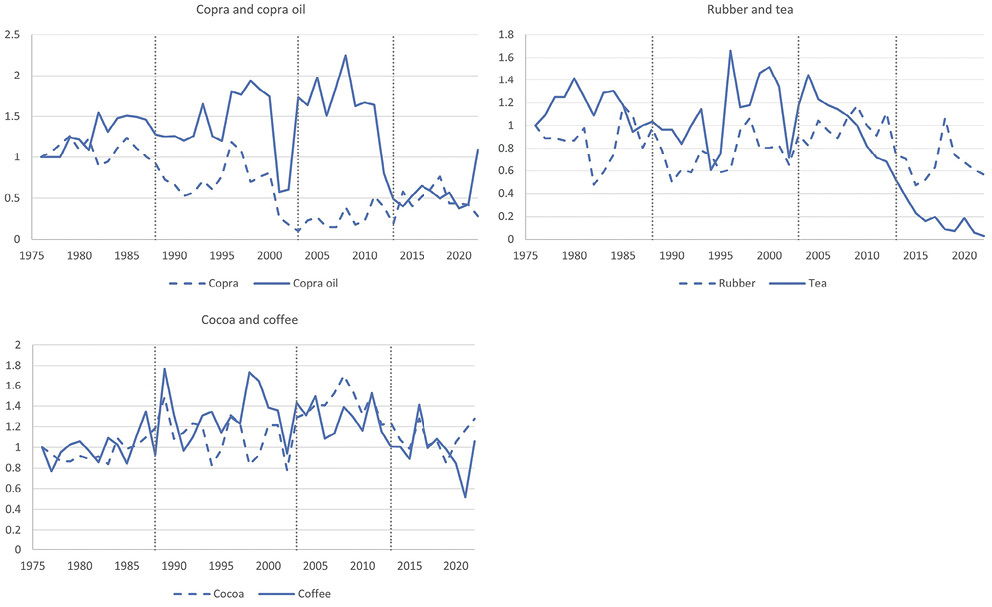
Figure B7: Export volume indices of cash crops, 1976–2022
Notes: Indices set equal to unity in 1976.
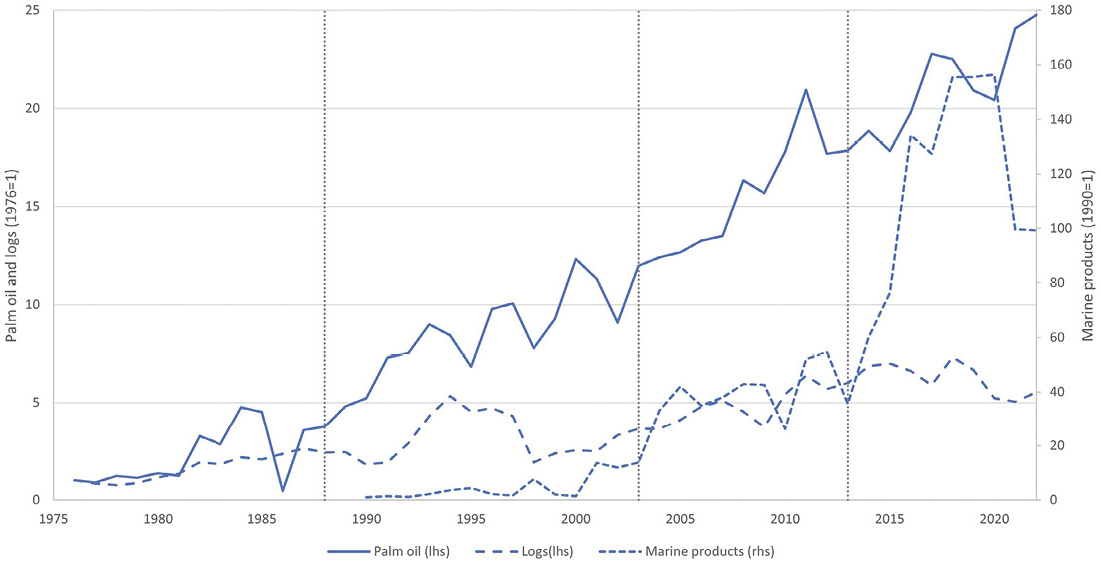
Figure B8: Export volume indices of marine products, palm oil and logs, 1976–2022
Notes: Indices set equal to unity in 1976 for palm oil and logs, and in 1990 for marine products.
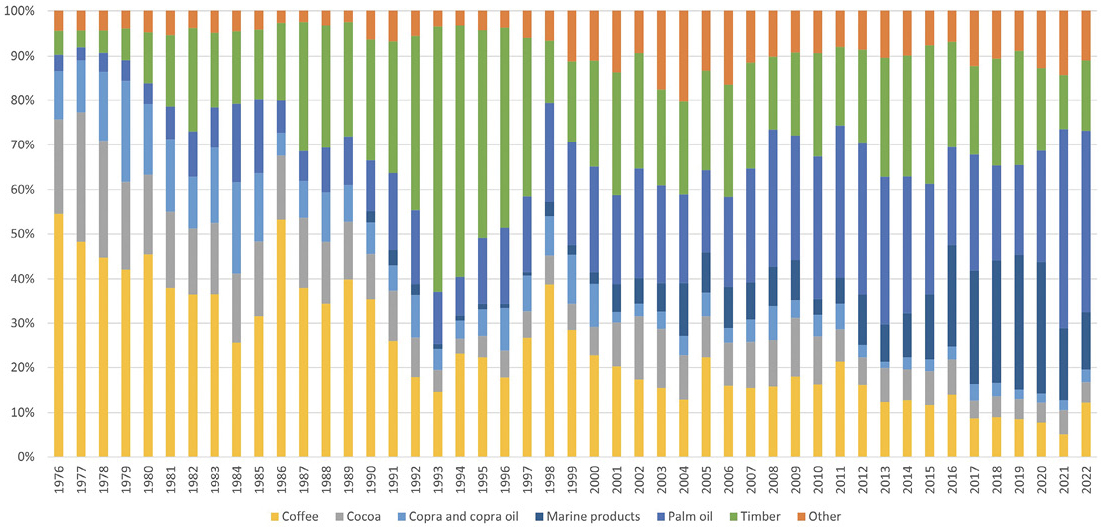
Figure B9: Composition of non-resource commodity exports by value, 1976–2022
Notes: Current prices are used for all variables. Timber exports are logs and other forest products. Other includes tea, rubber and other agricultural products.
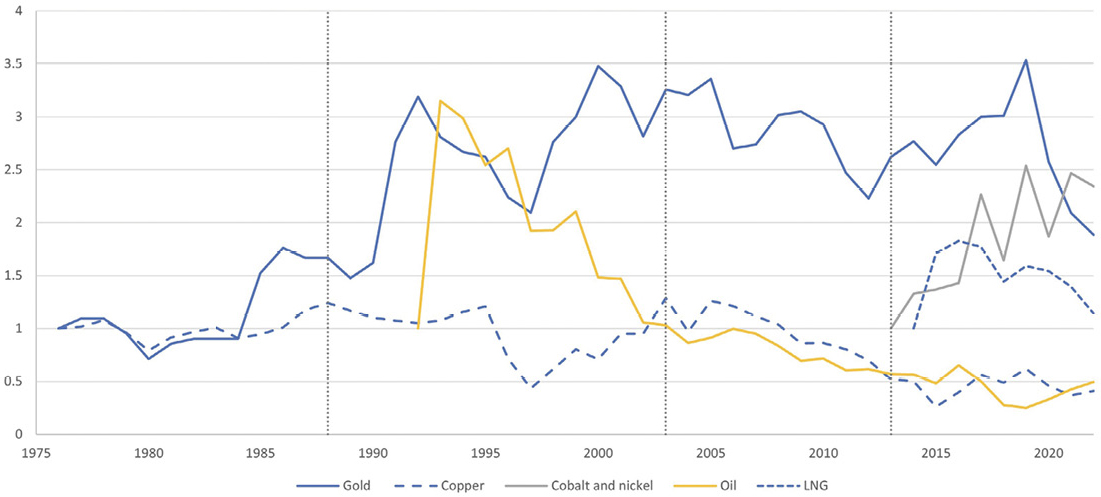
Figure B10: Resource export volume indices, 1976–2022
Notes: Indices set equal to unity in 1976 for copper and gold and the first year of production for other commodities.
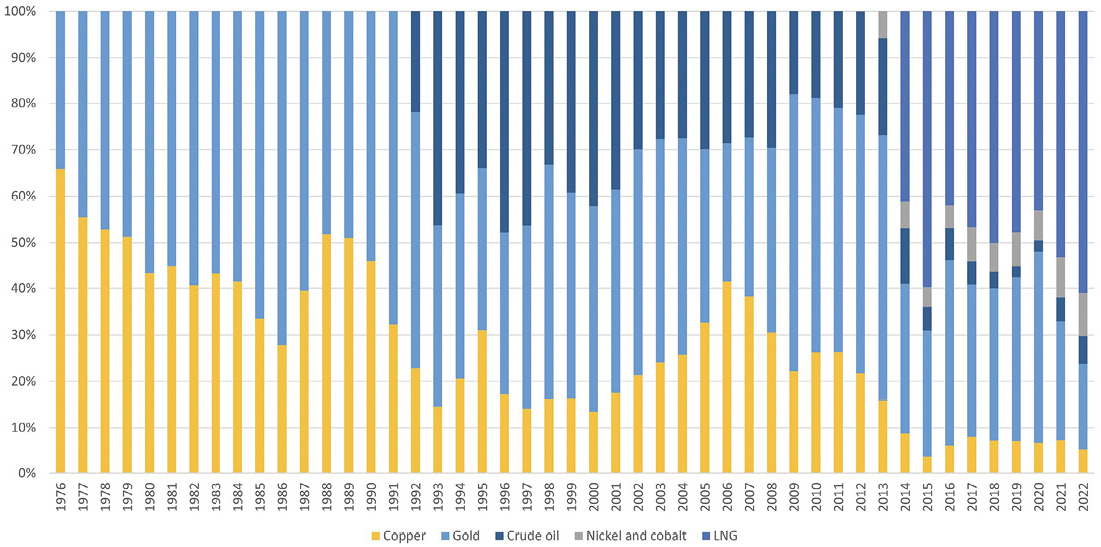
Figure B11: Composition of resource commodity exports by value, 1976–2022
Notes: Current prices are used for all variables. Silver and alluvial gold are included with gold.
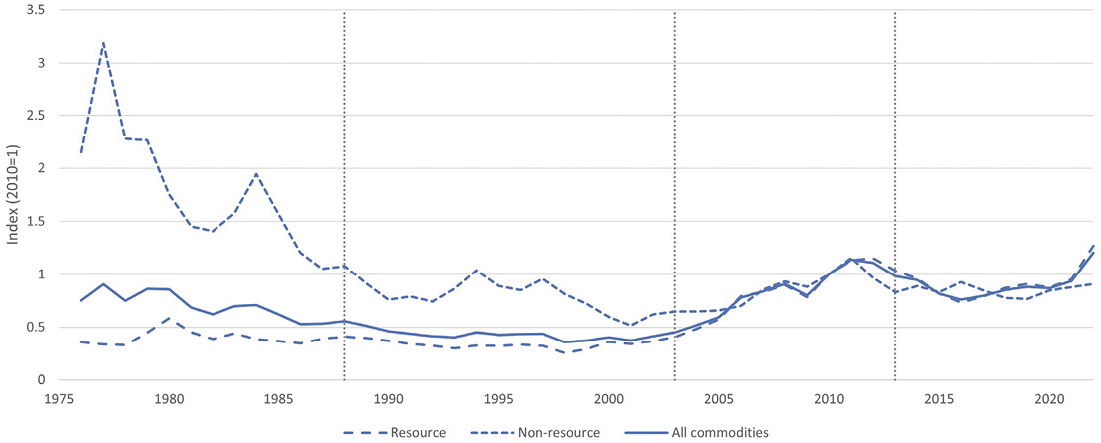
Figure B12: A commodity export price index for PNG, 1976–2022
Notes: Annual data; index set equal to unity in 2010; rolling weights are used, based on the average share of that commodity in total commodity exports over the previous three years. For sources and construction, see the detailed notes on page 319.
This commodity price index is constructed using the method of Gruss and Kebhaj (2019). The IMF commodity price index produced using this method for PNG is out of date and does not give a separate index for resource and non-resource commodities.
Weights are commodity export values (current price, kina). Rolling weights are used with the average of previous three years (t-1 to t-3) as the weights. For the first one to three years, the weights are, respectively, the current year, the current and previous year, and the current and previous two years.
Prices are from the World Bank commodity price data (August 2023), expressed in real 2010 US dollars, for the following commodities:
- copra and copra oil: Coconut oil ($/mt)
- cocoa: cocoa ($/kg)
- coffee: coffee Arabica ($/kg)
- palm oil: palm oil ($/mt)
- rubber: rubber RSS3 ($/kg)
- tea: tea, avg three auctions ($/kg)
- marine products: fish meal ($/mt)
- logs: logs, Malaysian ($/cubic metre)
- gold: gold ($/troy oz)
- copper: copper ($/mt)
- nickel and cobalt: nickel ($/mt) (the cobalt price is not included in the World Bank data set)
- crude oil: crude oil, average ($/bbl)
- condensate/LNG: liquefied natural gas, Japan ($/mmbtu).
Commodity data are obtained from the PNG Economic Database, in turn sourced from the Bank of Papua New Guinea (BPNG). Silver is excluded because silver and alluvial gold are grouped together in BPNG data, and not available for all years.
To calculate each index, natural log differences of the price are obtained for each commodity and multiplied by the relevant weight. The different components of the index are summed, and the exponent taken. The first year (1976) is set equal to unity, and subsequent years are defined as the previous year times the exponent of the summed log index. The index is then rebased to 2010. Resource, non-resource and all commodity price indices are thus calculated.
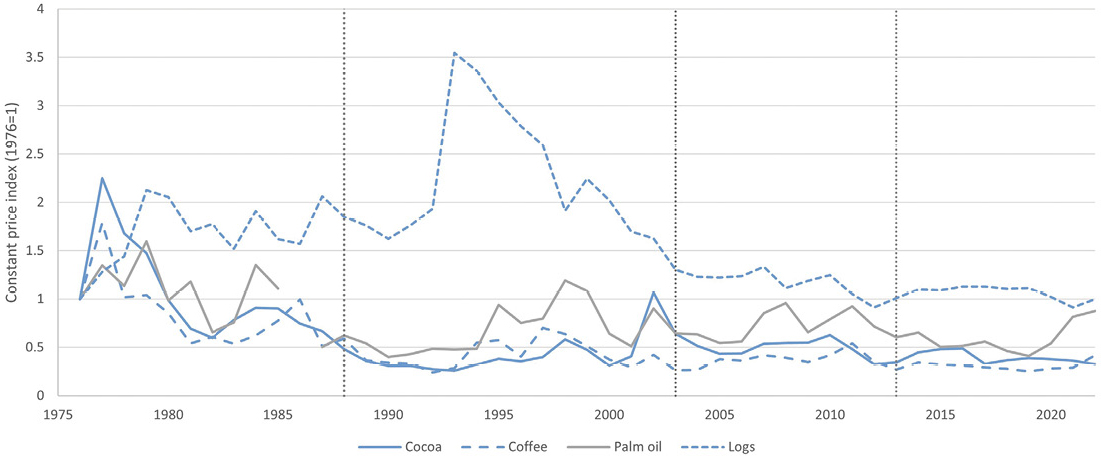
Figure B13: Inflation-adjusted price indices of some important non-resource commodities, 1976–2022
Notes: Indices derived from unit value data calculated by dividing commodity export values by commodity export volumes and then adjusting by CPI. Indices set equal to unity in 1976. These can be thought of as indices of the domestic purchasing power of agricultural commodities.
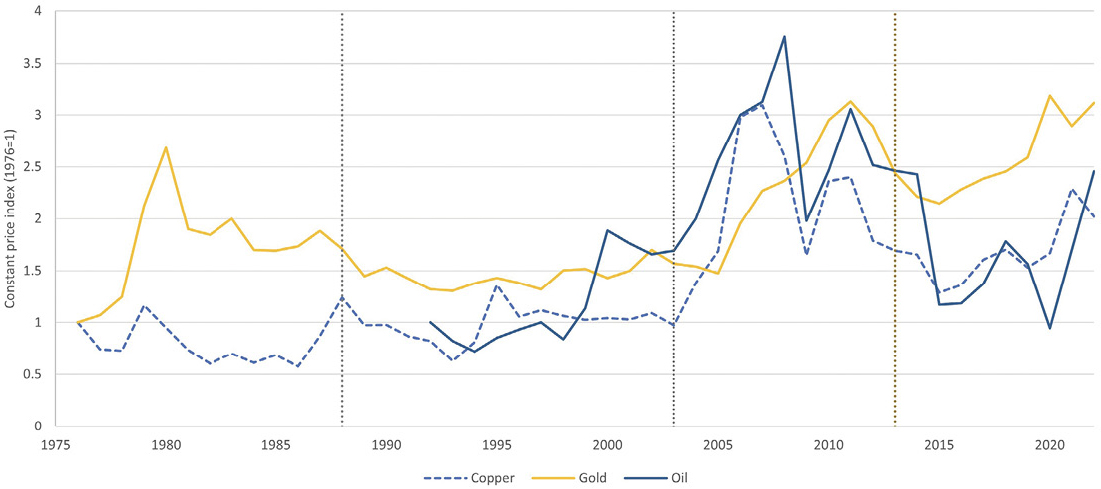
Figure B14: Inflation-adjusted price indices of some important resource commodities, 1976–2022
Notes: Indices derived from unit value data calculated by dividing commodity export values by commodity export volumes and then adjusting by CPI. Indices set equal to unity in 1976, except for 1992 for oil (first year of production). These can be thought of as indices of the domestic purchasing power of resource commodities.
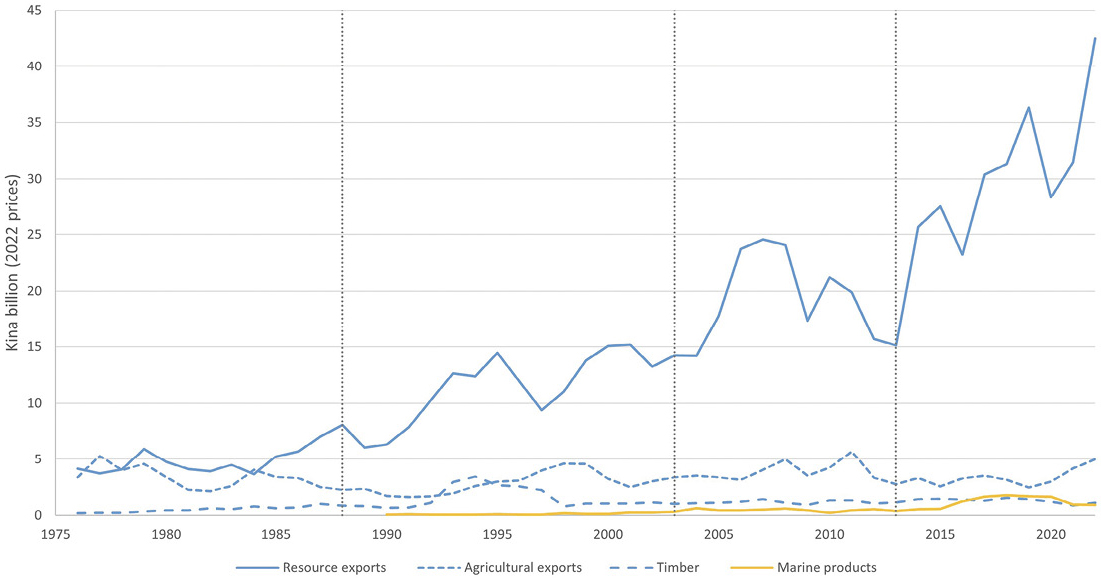
Figure B15: The value of resource, agricultural, timber and marine exports (kina billion, constant prices), 1976–2022
Employment
Formal sector employment, both private and public, is mainly flat until the end of the nineties (Figure B16). Employment in the private sector (also including state-owned enterprises or SOEs) increased rapidly in the noughties but has fallen since the boom ended. Overall, one sees a decline in the employment/population ratio, from 6 per cent just after independence to 4.5 per cent in 2019.
Plantation agriculture and manufacturing are more important employers than the resource sector (Figure B17).
The urban minimum wage was doubled just before independence (Figure B18). The urban minimum wage stayed high due to indexation, but in 1992 a separate minimum wage for urban workers was done away with, and replaced by a new, unified minimum wage (existing workers were grandfathered). There was no real increase until 2005. Even today, the urban worker on a minimum wage earns a third of what they did at independence.
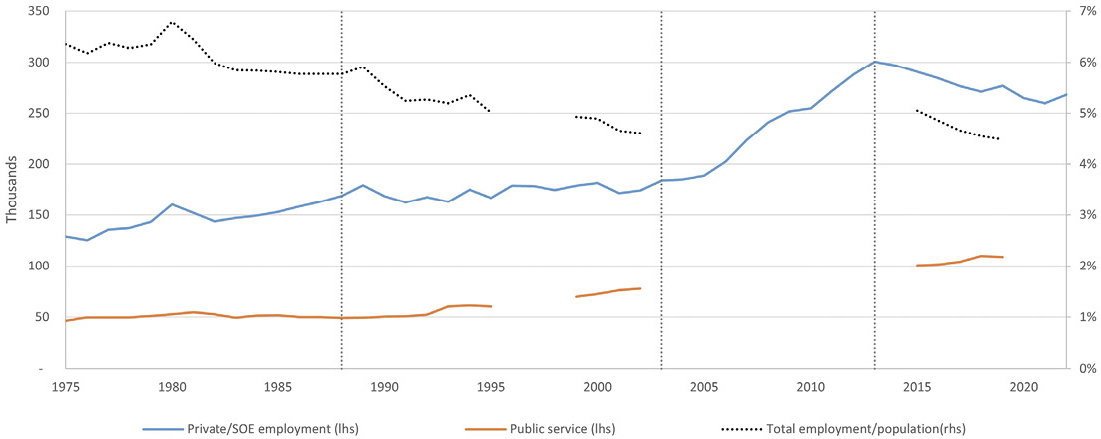
Figure B16: Formal sector employment, totals and population percentage, 1975–2022
Notes: Public service time series is incomplete.
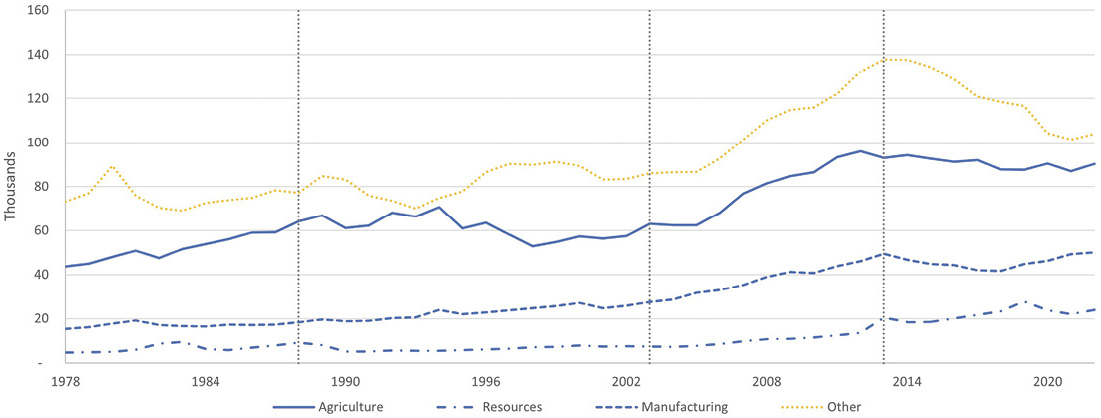
Figure B17: Formal employment by sector, 1978–2022
Notes: Only private sector and SOE employment are shown, so ‘other’ excludes public servants.
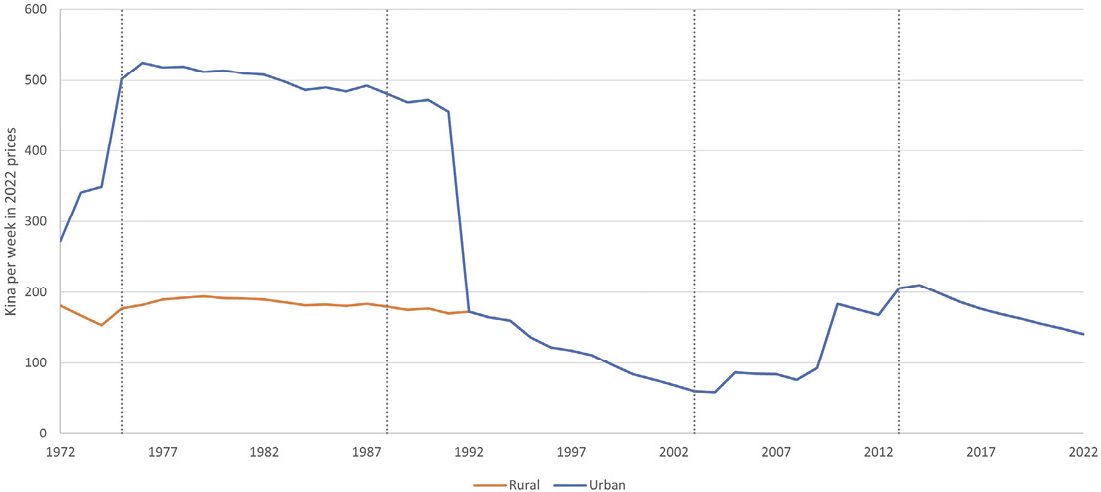
Figure B18: Urban and rural minimum weekly wage (kina per week in 2022 prices), 1972–2022
Notes: CPI is used to convert from current to constant prices.
Balance of payments and the exchange rate
More often than not, PNG has run current account surpluses, with notable exceptions in the eighties and late noughties (Figure B19). Foreign exchange rationing in the fourth period pushed imports below 30 per cent. Meanwhile, the current account surplus reached a record high of around 15 per cent due to booming resource exports and offshore revenue repatriation.
Under the ‘hard kina’ policy that PNG took to independence, the kina was fixed, first against the Australian dollar, and then against a bundle of currencies (Figure B20). The kina was depreciated against the US dollar by 10 per cent after the Panguna mine closed in 1989, and then floated in 1994, after which it plummeted in value. There was marked appreciation against the US dollar during the resource boom due to the heavy inflow of US dollars, and then a controlled gradual depreciation from 2014 onwards when the floating regime was done away with and replaced by a peg.
The real effective exchange rate (REER) declined during the first two periods, rapidly when it was floated in the second (Figure B21). It recovered its value during the resource boom and has maintained that value ever since due to the shift to a pegged regime, supported by foreign exchange rationing. In 1980, the REER was 1.33. In 2022, it was 1.31.
Foreign exchange (FX) reserves relative to imports declined rapidly from the time of independence to the first balance of payments crisis of 1994 (Figure B22). After a second crisis in 1999, they picked up again and have stayed healthy even since the boom ended as a result of foreign exchange rationing.
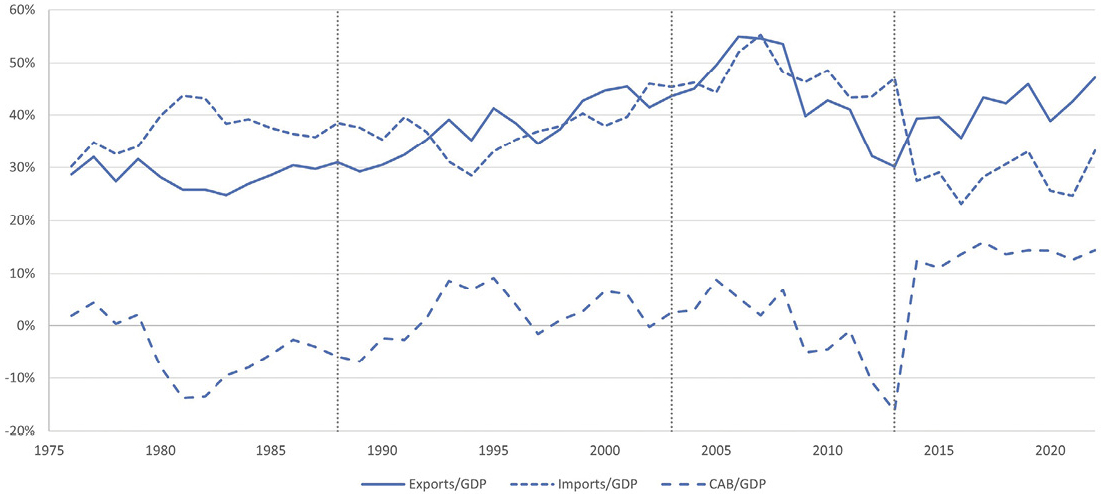
Figure B19: Exports, imports and the current account balance (% GDP), 1976–2022
Notes: CAB is the current account balance. Due to official transfers (aid), the CAB is sometimes positive even if imports exceed exports.
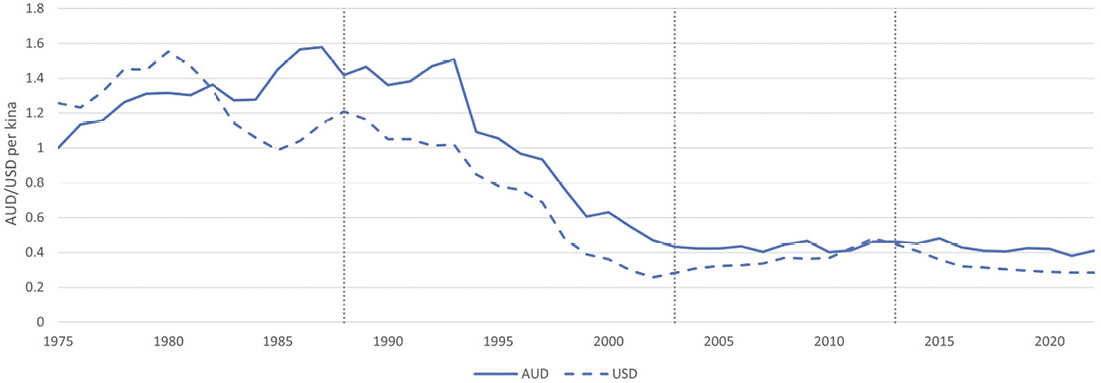
Figure B20: The PGK–AUD and PGK–USD exchange rates, 1975–2022
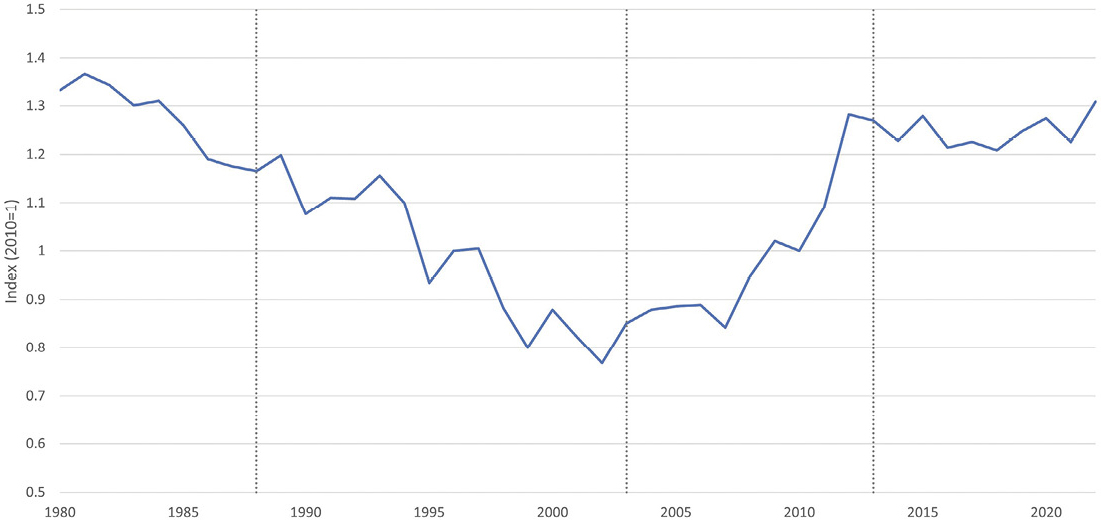
Figure B21: Real effective exchange rate index, 1980–2022
Notes: Index set equal to unity in 2010.
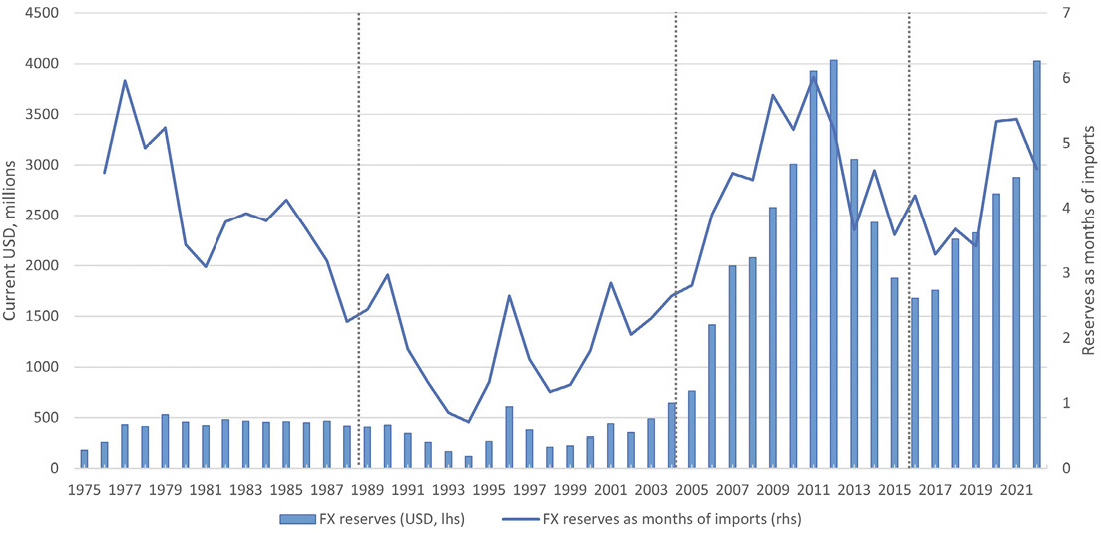
Figure B22: Foreign exchange reserves, 1975–2022
Fiscal outcomes
Both revenue and expenditure are highly volatile (Figure B23). Expenditure averages just under 22 per cent for the entire post-independence period. Revenue averaged about 20 per cent until the last period, in which it fell precipitously, falling to as low as 15 per cent in 2020.
Adjusting for inflation, the only period that has shown rapid growth in revenue and expenditure is the third (boom) period (Figure B24).
Foreign aid fell from about 7 per cent of GDP at independence to just 2 per cent in 2020 (Figure B25). Resource revenue increased from an average of about 2 per cent of GDP prior to the boom to 5 per cent during the boom but fell to 1.5 per cent during the bust. Non-resource own revenue also fell during the bust relative to GDP, but is still a higher share of GDP than at independence.
Resource revenue as a share of resource GDP is highly volatile, reaching above 30 per cent five times, and falling to below 5 per cent eight times (Figure B26). Its sustained low value during the bust is evident. Non-resource own revenue is less volatile and has gradually grown relative to non-resource GDP.
Throughout most of PNG’s economic history, PNG has run mild budget deficits (Figure B27). During the early years of the resource boom it ran some sizeable surpluses, but the later years of the boom and the subsequent bust saw a number of large deficits.
The PNG government’s debt and interest burden rose over the eighties and nineties, then fell during the early years of the boom, but then returned during the bust to equal or exceed earlier highs (Figure B28).
For the first decade after independence, about 25 per cent of PNG’s government debt was domestic (Figure B29). By the mid-nineties that figure had reached 50 per cent, and, by 2012, around 70 per cent. During the bust, the share of domestic debt declined to about 50 per cent.
The Mineral Resources Stabilisation Fund was established just before independence to stabilise PNG’s resource revenue (Figure B30). It built up a balance of 7 per cent of GDP by the late nineties, but was then abolished due to overall fiscal stress. It was replaced in the early years of the resource boom by a set of ad hoc trust funds, which were quickly built up, and then quickly depleted. Today, although a sovereign wealth fund has been legislated, PNG has no resource revenue stabilisation or savings mechanism.
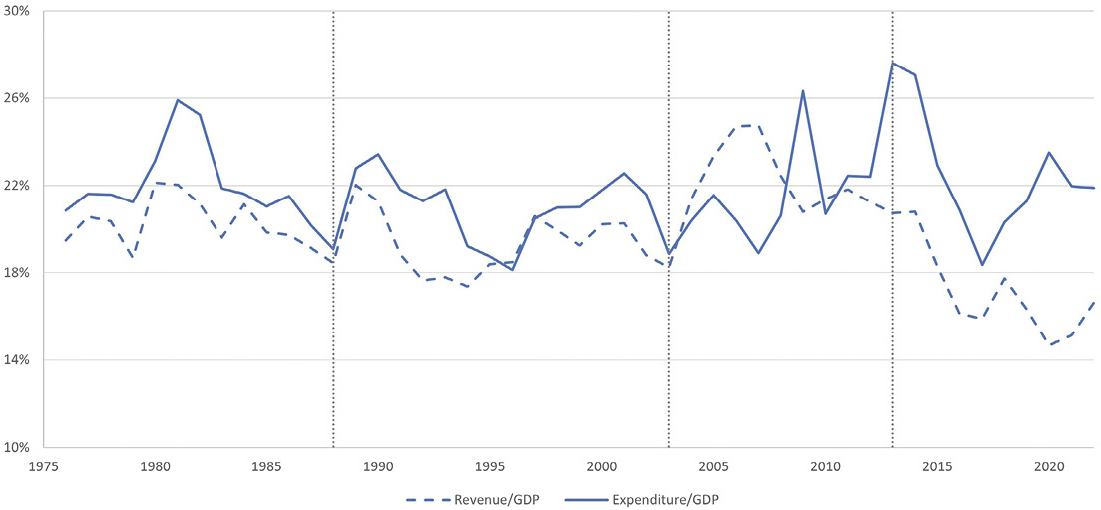
Figure B23: Revenue and expenditure (% GDP), 1976–2022
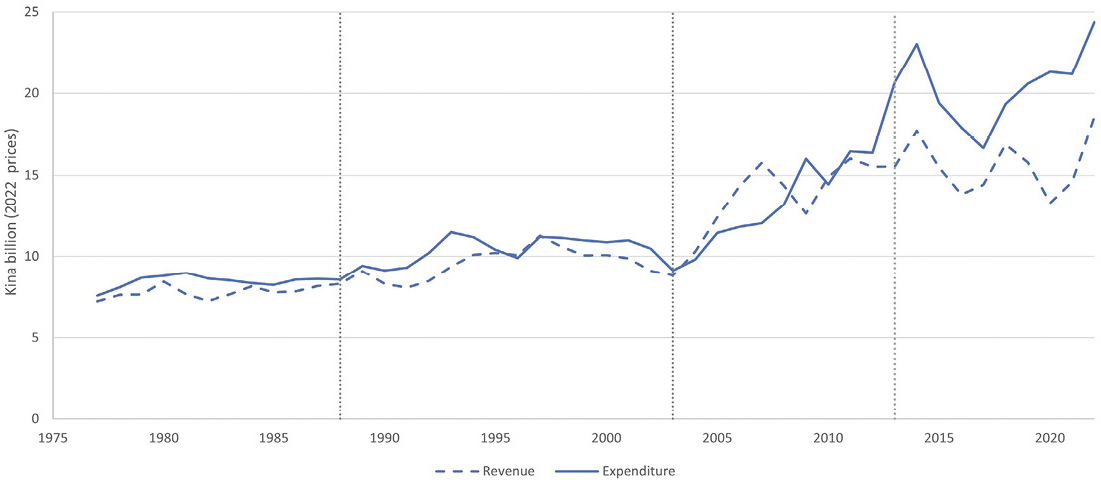
Figure B24: Revenue and expenditure, 1976–2022 (kina billion in 2022 prices)
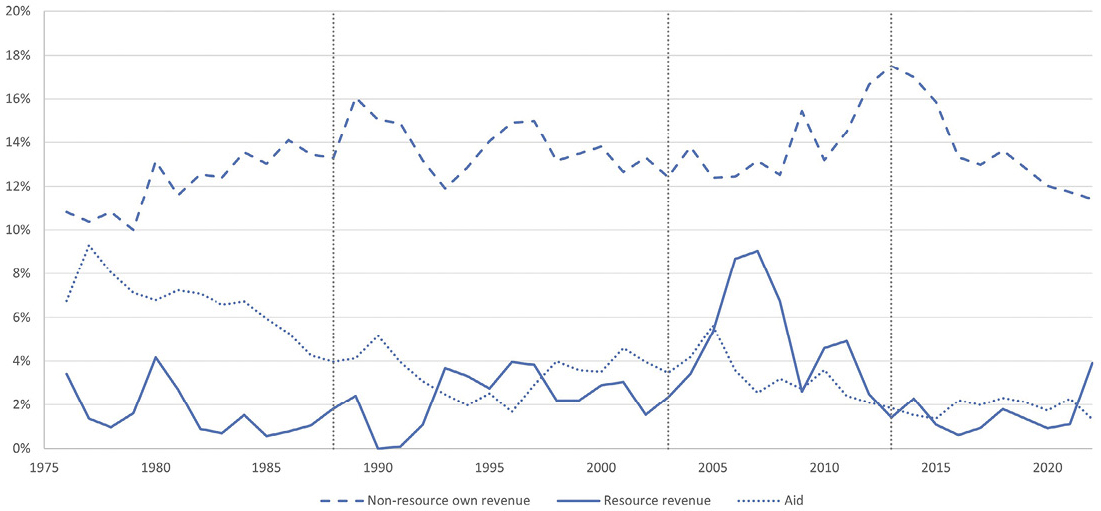
Figure B25: Non-resource own revenue, resource revenue and aid (% GDP), 1976–2022
Notes: Own revenue is revenue excluding foreign aid.
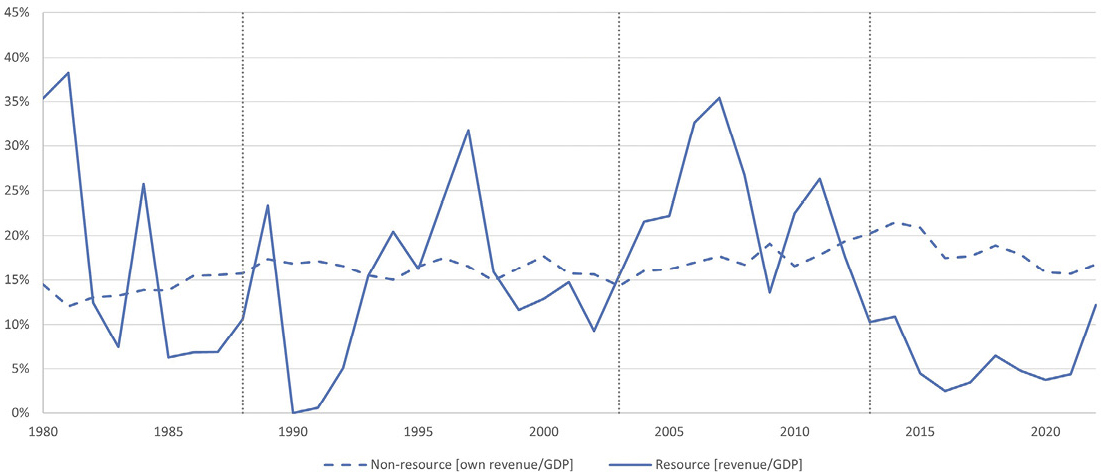
Figure B26: Government resource and non-resource takes—(non-)resource own revenue as a percentage of (non-) resource GDP, 1980–2022
Notes: Own revenue is revenue excluding foreign aid.
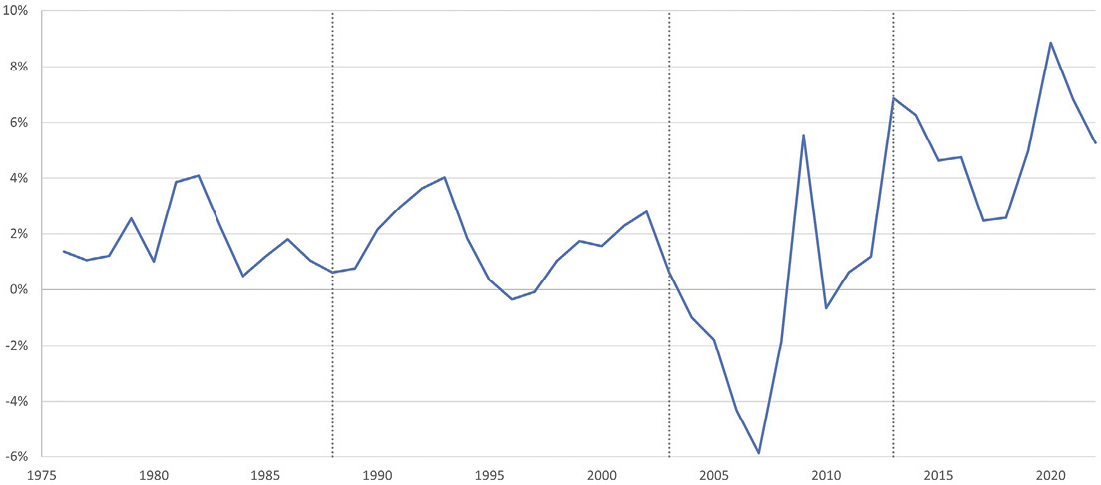
Figure B27: Deficit/GDP (%), 1976–2022
Notes: A negative deficit is a surplus.
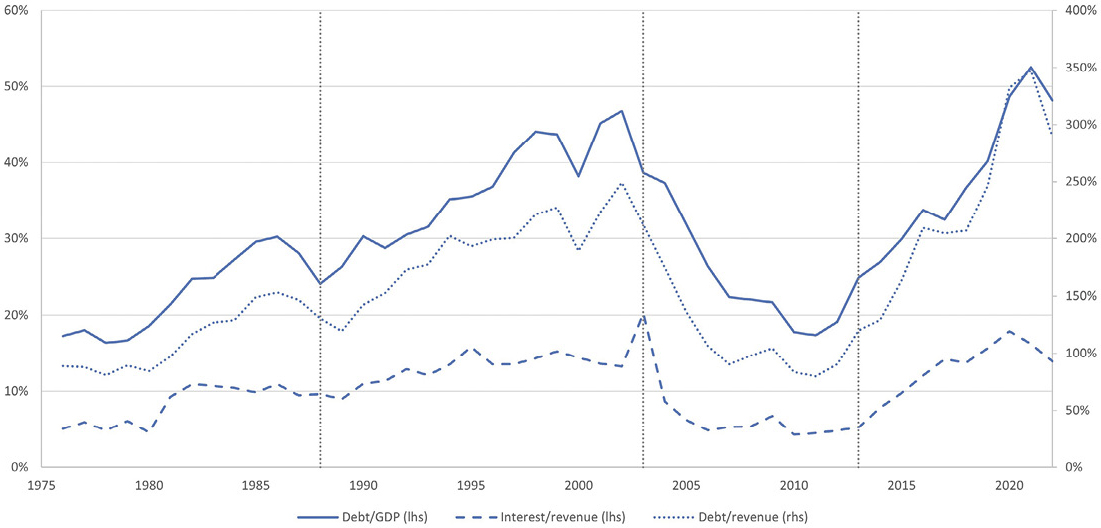
Figure B28: Debt/GDP, debt/revenue and interest/revenue (%), 1976–2022
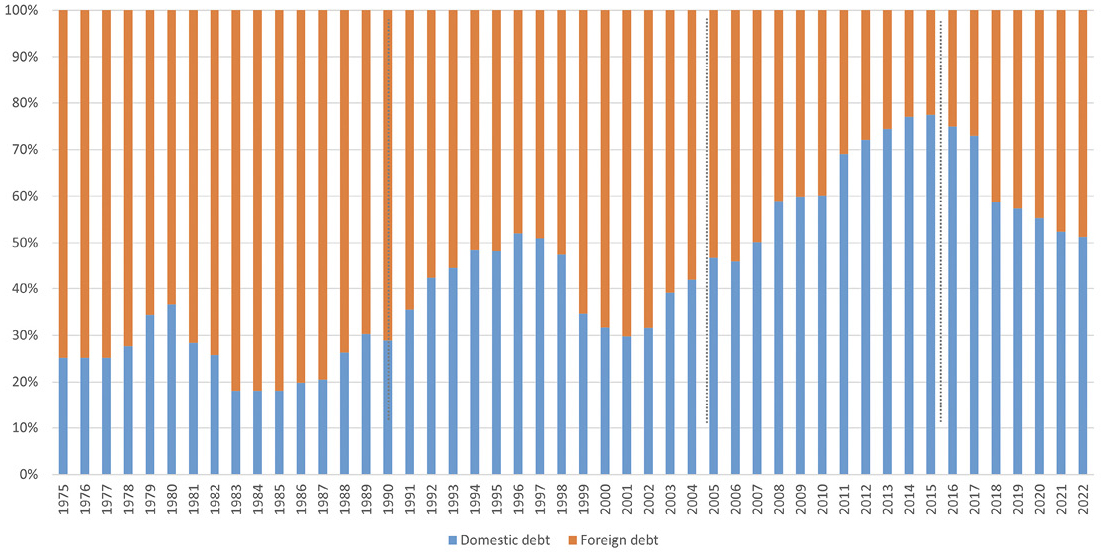
Figure B29: Domestic and foreign debt as percentages of the total, 1975–2022
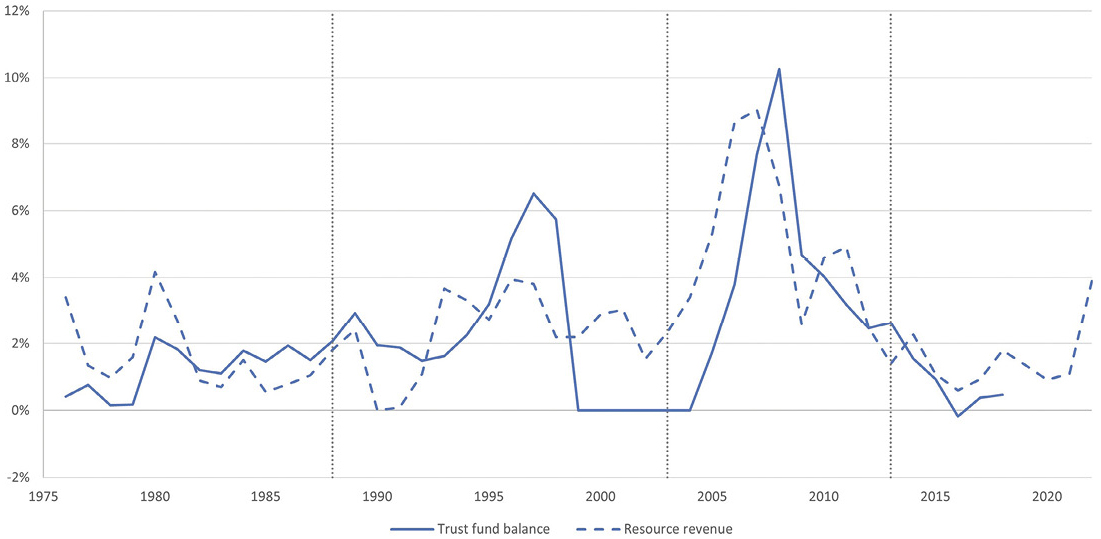
Figure B30: Resource revenues and trust fund balances (% GDP), 1976–2022
Notes: Trust fund balances only to 2018. After that a consistent series is not available. However, the data that are available indicate that trust fund balances have been kept small since 2018.
Monetary policy and banking
Inflation has generally been moderate in PNG (Figure B31). However, it did noticeably increase in the nineties due to rapid currency depreciation and perhaps central bank deficit financing (Figure B35).
Since independence, deposits held by the commercial banking sector have almost doubled in size relative to GDP (Figure B32). Private sector loans, which increased relative to GDP in the first period, fell following the Bougainville crisis, recovered during the boom, but then fell during the subsequent bust. Lending to the government has become as important for the banks as lending to the private sector.
The actual liquid asset ratio and the statutory minimum liquid asset ratio (set by BPNG) generally moved in a parallel motion throughout the eighties and early nineties (Figure B33), indicating that the Bank of Papua New Guinea (BNPG) was successful at influencing the behaviour of banks. The divergence in these values from the mid-nineties onwards—due to increased purchase by banks of government bonds—indicates the opposite situation. In the late nineties, BPNG introduced a cash reserve requirement (Figure B40) and in 2010 it abandoned the minimum liquid asset ratio.
Between around 1990 and 2013 (following deregulation), the average deposit rate was on a downwards trajectory, declining to close to zero (Figure B34). The increase in the spread between the average lending rate and the average deposit rate is because lending rates have not fallen by nearly as much as the deposit rates. The KFR or policy rate has no influence on lending rates due to excess liquidity (Figure B36).
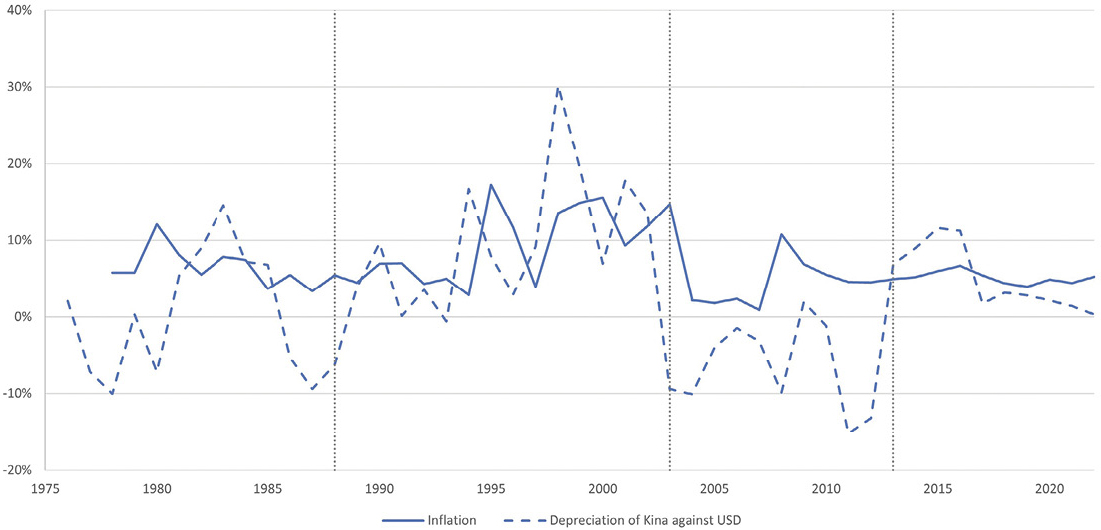
Figure B31: Inflation and currency depreciation, 1976–2022
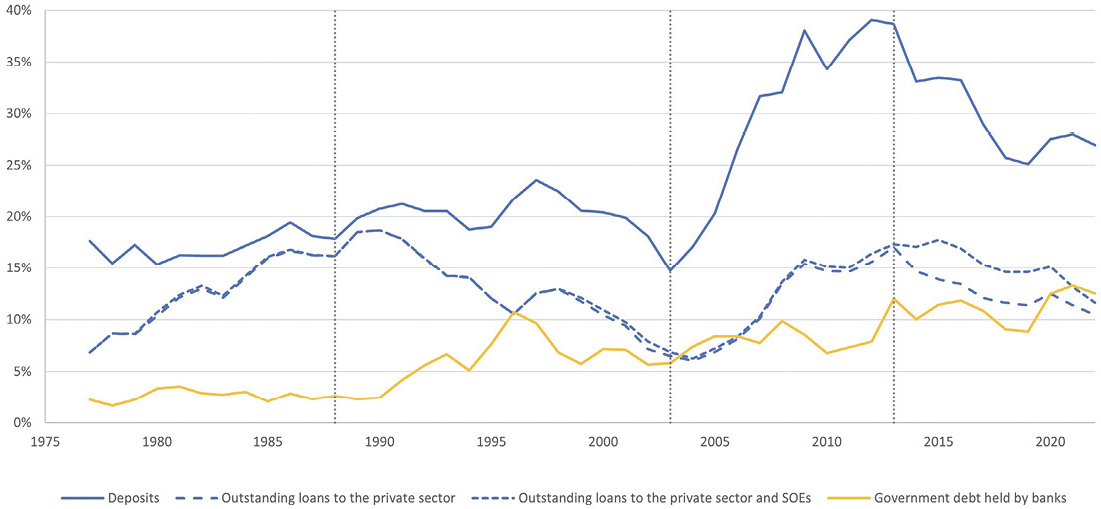
Figure B32: Deposit and lending ratios (% GDP), 1977–2022
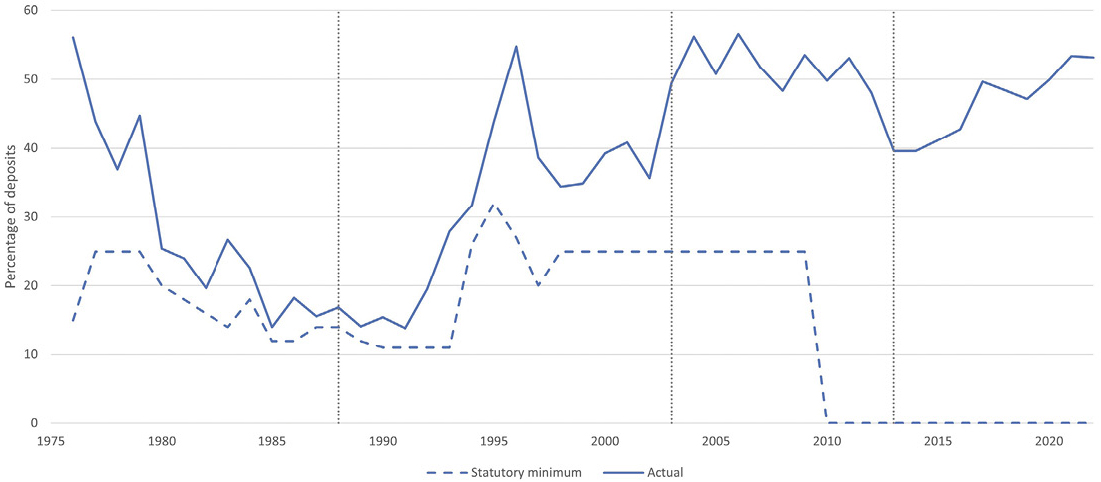
Figure B33: Banks’ liquid asset ratios—actual and statutory minimum, 1976–2022
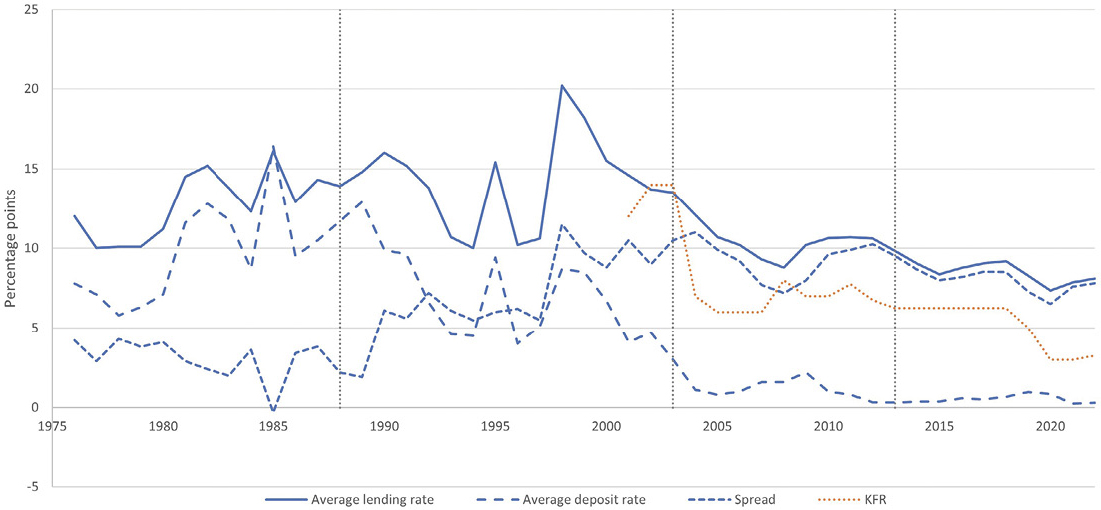
Figure B34: Weighted average lending and deposit rates and spread, 1976–2022, and Kina Facility Rate, 2001–22
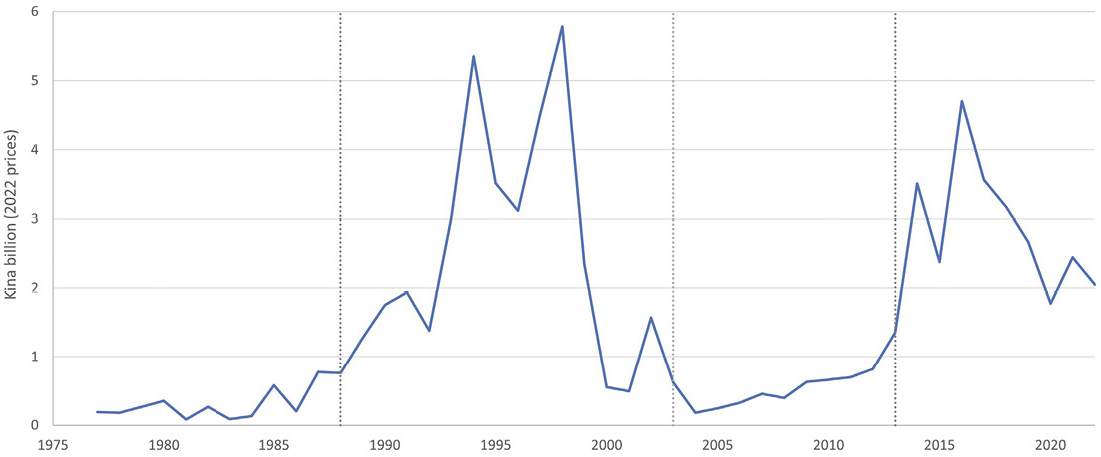
Figure B35: BPNG holdings of government debt adjusted for inflation, 1977–2022 (kina billion, constant prices)
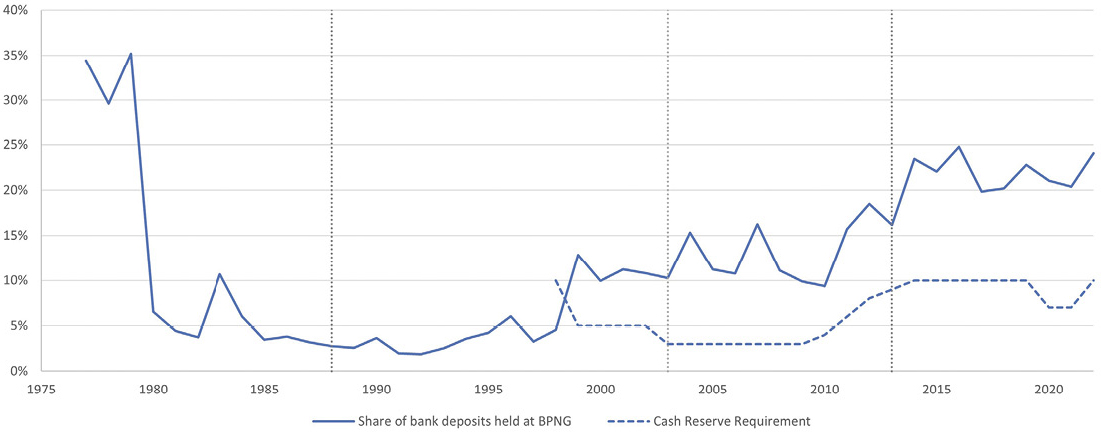
Figure B36: Share of commercial bank deposits held at BPNG and in cash, 1977–2022, and cash reserve requirement, 1998–2022
Note: Cash held by commercial banks is included as well as their deposits at BPNG for historical reasons, since the two variables are combined in BPNG (2007). Over time, cash is a declining ratio of the two variables combined, 11 per cent for the last four years.
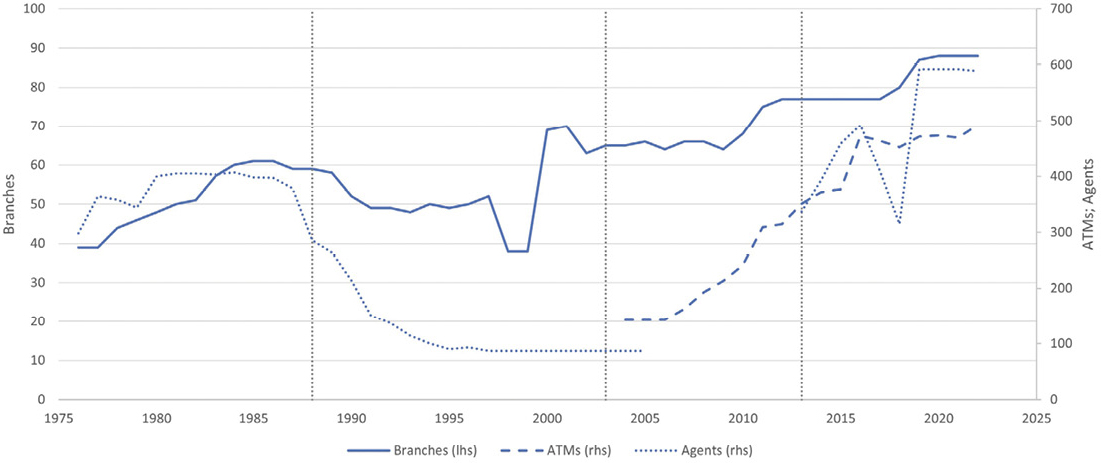
Figure B37: Financial inclusion, 1976–2021
Source: Data are sourced from the IMF Financial Access Survey.
Monetary policy and banking (cont.)
Deficit financing emerged as a feature of the mid- and late nineties (Figure B35). It was then banned by the Central Banking Act of 2000, but nevertheless re-emerged between 2014 and 2016.
The excess liquidity at independence did not last long (Figure B36). However, it re-emerged in the late nineties and has got worse since. In 1998, BPNG introduced a minimum cash reserve requirement (CRR) of 10 per cent. It was reduced to 5 per cent the following year, but the share of deposits held by the commercial banks at BPNG stayed between 10 and 15 per cent, and then increased above 15 per cent during the late boom years, and above 20 per cent during the bust, so that even when the CRR was increased in the second half of the boom, it had no effect.
The number of bank branches has risen, but not kept up with population growth (Figure B37). The number of bank agents has fallen and then risen. ATMs are now in the country, but the number is no longer growing.
Service delivery
Adjusting for both inflation and population, government revenue is significantly lower today than at independence (Figure B38). Expenditure has recovered since its collapse in the nineties, but not revenue, which in 2020 on a per person basis was at its lowest level ever.
Vaccination rates rose over the eighties and were mainly stable or rising in the nineties and noughties, but fell sharply in the tens (Figure B39). In 2019, according to World Bank data, PNG had the lowest immunisation rates in the world (Table 10.14). The number of doctors has struggled to keep pace with population growth and is now one of the lowest in the world.
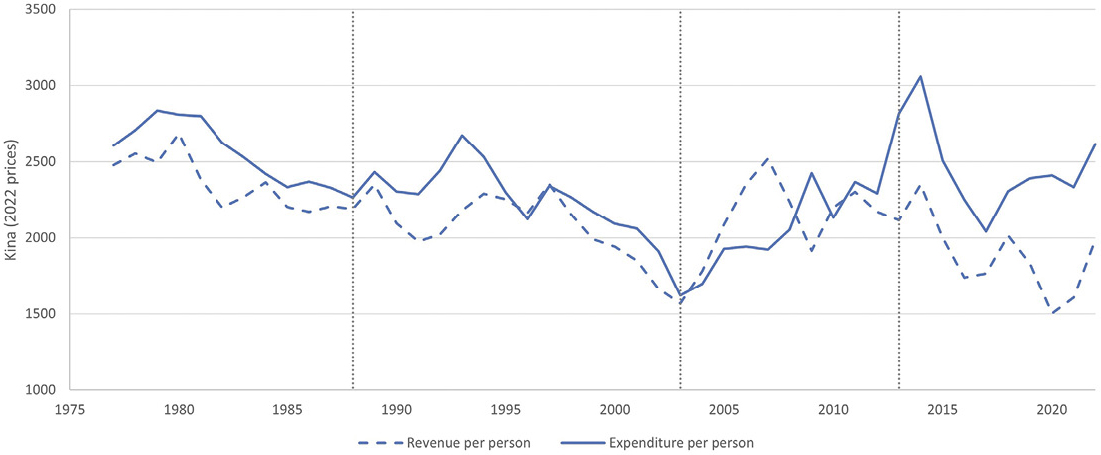
Figure B38: Government revenue and expenditure per person, 1976–2022 (kina in 2022 prices)
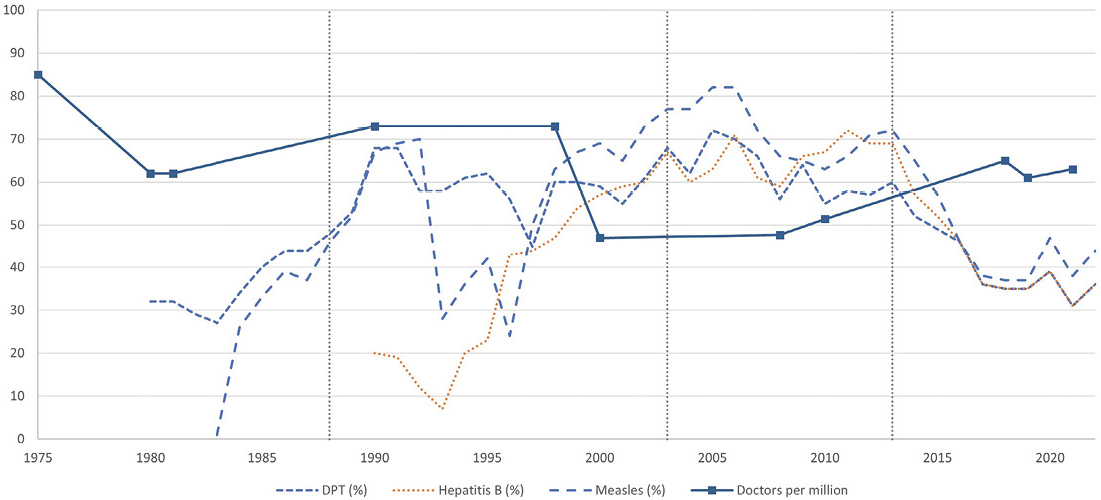
Figure B39: Immunisation rates, 1980–2022, and doctors per million, 1975–2021
Notes: The rates are the percentage of children aged 12–23 months who have been fully vaccinated. DPT is diphtheria, pertussis (or whooping cough) and tetanus; it requires three vaccine doses. Three doses of the Hepatitis B vaccine are also required, but only one for measles.
Previous Next



