


 menu
Struggle, Reform, Boom and Bust
2
Slow growth and austerity
Despite what we used to be told in the past, Papua New Guinea is a country of very rich and abundant resources. There is no shortage of firms and investors eager to develop those resources. Our problem at the moment is not that we have to go out and search for capital; it is rather that we must be able to control and restrict all the foreign capital that is being offered. Not only must the government make sure of negotiating a hard bargain with foreign companies, we must also determine how much development we want, the most desirable pace for that development, and the price we are willing to pay in terms of the drastic changes that it will force in our way of life.
—Prime Minister Michael Somare (1975, 144)
The over-riding characteristic of the PNG economy today is that, since Independence, average per person income has grown little, if at all, in real terms.
—Finance Minister Julius Chan (1992, 5)
2.1 Introduction
Australia is commonly, and fairly, criticised both for doing too little to prepare Papua New Guinea for independence, and then, in the early seventies, pushing for a rushed independence.1 As a result, it is often said, PNG was not ready for its independence on 16 September 1975, after just three years of home rule. However, at least in terms of economic policy, the new nation arrived well equipped. Legislation passed in 1974 established the Mineral Resources Stabilisation Fund (MRSF) to smooth out volatile revenue flows from the Panguna copper mine in Bougainville, one of the biggest in the world, the tax terms of which PNG had just renegotiated in its favour. The major agricultural commodities—coffee, cocoa and copra—had their own stabilisation schemes. To avoid high inflation and fiscal profligacy, PNG adopted a hard currency policy, known as the ‘hard kina’, which fixed the new PNG currency against first the Australian dollar, and then a basket of currencies. To promote progress for all, PNG wrote five principles of equitable development into its constitution.
There was confidence in the air, as illustrated by the quote from the founding prime minister, Michael Somare, with which this chapter begins. And, indeed, much seemed to go well in the first decade or so following independence. The government showed exemplary fiscal restraint in the face of a reduction in aid from Australia. There was an expansion in the national ownership of the capital stock. A second major mine (Ok Tedi) opened, and exploration was undertaken and plans made for others. The MRSF helped stabilise mining revenue inflows, the exchange rate was stable and inflation relatively low, at least by global standards.
On the other side of the ledger, economic growth, expected to be rapid at independence, was slow, below the rate of population growth, due to a poor investment climate and declining aid and commodity prices. Formal sector employment was unable to keep up with the growing population. The first challenges to fiscal stability were seen. Foreign exchange reserves fell over time and commodity stabilisation funds were depleted.
Meanwhile, deeper problems started to build. Away from Port Moresby, dissatisfaction on Bougainville with the Panguna mine grew. Many of the newly created provincial governments established in PNG’s first round of decentralisation ran into trouble and were dismissed. A distinctive PNG style of governance became apparent. The political class grew in strength, but political precarity and clientelism became entrenched. The party system weakened; bureaucratic quality fell. Crime and corruption became serious problems.
Not all of these problems can be attributed to low growth, but the growing gap between expectations and performance certainly exacerbated them.
We draw a line under this initial post-independence period (which we refer to as the seventies and eighties, or sometimes just as the eighties) in 1988. At the end of 1988, violence broke out on Bougainville, directed against the Panguna mine, and, by May 1989, the mine was closed, never to reopen. The nineties was a very different decade.
This chapter includes an analysis of PNG’s growth record over the eighties as well as of macroeconomic policies and performance. The next evaluates (structural) economic policies and explores political and institutional developments during the period.
2.2 Economic growth
PNG had a population of 2.8 million at independence. Outside of agriculture, the economy was dominated by foreign-owned firms and by Australian aid and expatriates. Economic integration was very low. One mine, on Bougainville, contributed about half the country’s exports. Manufacturing and other modern business activity was very limited and nearly all foreign owned. Agriculture was both subsistence and market-based, the latter including cash crops, vegetables and buai (betel nut). Cash exports came from both foreign-owned plantations and smallholders. In the year of independence, 67 per cent of coffee production, 36 per cent of cocoa and 42 per cent of copra was from smallholders (MacWilliam 2013, 180). Only about 6 per cent of the population was in formal sector employment, and more than one-quarter of that group worked for the government (Figure B16). The informal urban economy was very limited. In the early seventies, ‘urban artisan and service activities … [were] virtually non-existent’ (Faber et al. 1973, 25).
The optimism at independence notwithstanding, economic growth was in fact slow. Agricultural commodity production grew particularly slowly; the resource sector did somewhat better, but problems at PNG’s first two mines that were neglected would subsequently explode. There was little growth in formal sector employment, but the informal economy expanded.
2.2.1 Slow growth
From a global perspective, PNG’s independence was poorly timed. The postwar ‘golden age’ of high growth came to a halt with the first oil crisis of the early seventies. Prices for PNG’s agricultural exports rallied sharply just after independence: for example, coffee prices doubled between 1975 and 1976 and then increased by another two-thirds in 1977. However, the national benefits of this were offset by the second oil crisis of the late seventies as PNG then met all its oil needs via imports. The second oil crisis also kicked off the global recession of the early eighties, which dashed the anticipation of a boom induced by the conclusion in 1980 of an agreement for the construction of PNG’s second large mine, Ok Tedi. Commodity prices started falling and continued to decline through the eighties and nineties. Our PNG-specific commodity price index has a value of 0.75 in 1976 and 0.86 in 1979, but then falls to 0.62 in 1982 before recovering to 0.71 in 1984, and then falling again to only 0.55 in 1988 (Figure B12).
The eighties was a difficult decade for developing countries—a lost decade for Latin America and a ‘disastrous’ one for Africa (Singer 1989)—and it was certainly a difficult period for PNG. Declining commodity prices discouraged agricultural production and reduced resource revenue to government. Facing these headwinds, and given the poor investment climate (3.1.3) and falling aid (Figure B25), it is not surprising that growth was slow.
PNG’s GDP grew at about the rate of population in the late seventies, but there was no growth at all from 1980 to 1984, a particularly difficult period (Figure 2.1). The Panguna mine went into the red for the first time in 1982. Economic growth only resumed in 1985, the first full year of production for PNG’s second mine, Ok Tedi, and it then returned to around the rate of population growth. The same pattern can be observed of government expenditure. It increased ahead of inflation in the late seventies and late eighties, but fell in the early eighties as part of the government’s austerity program (Figure B24 and Section 2.3.1).
We emphasise non-resource GDP in this book as a measure of national economic activity, and argue that, due to high levels of foreign ownership and capital intensity in the resource sector, it is a better indicator than GDP itself (1.2.3). Since PNG has become more resource dependent over time, the difference between non-resource GDP and GDP is least important for this first period, and, in any case, non-resource GDP data are only available from 1983 onwards. The simple message from Figure 2.2 is that this first period of independence was one of regression in terms of average living standards, whether measured by GDP or non-resource GDP per person.
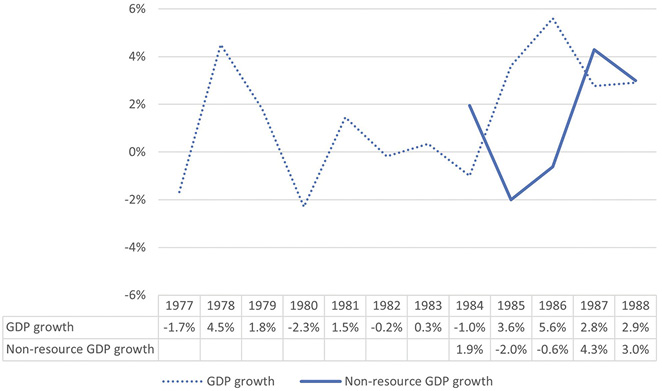
Figure 2.1: GDP and non-resource GDP growth, 1977–88 (kina, constant prices)
Source: PNG Economic Database.
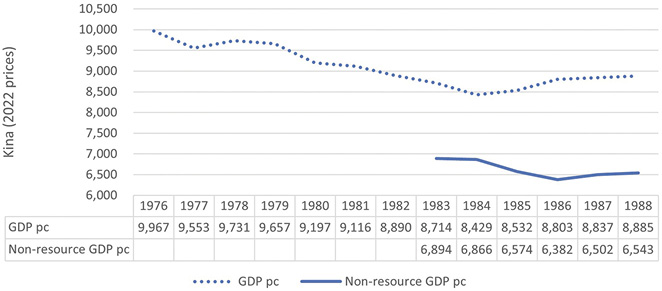
Figure 2.2: GDP and non-resource GDP per person, 1976–88 (kina, constant prices)
Source: PNG Economic Database.
2.2.2 Agriculture and manufacturing
Most Papua New Guineans farm, and most grow cash crops. According to the 1980 Census, in that year, 48 per cent of PNG households grew coffee, 19 per cent copra and 13 per cent cocoa (Connell 1997, 81). The performance of non-resource commodities was mixed over this period. If we compare production at the end of the period with that at the start of it, we see little or no growth in the traditional crops of coffee, cocoa and copra, but a more than doubling of palm oil and log production (Figures B7 and B8).
The traditional cash crops struggled with land disputes, and growth came from smallholders rather than plantation owners (Goodman, Lepani and Morawetz 1985). Plantation owners were overwhelmingly foreign. Just before independence the government decided, partly to prosecute its localisation agenda (3.1.1), and partly because of the grievances of traditional landowners, to initiate a program of plantation land acquisition. Something had to be done—the situation was a ‘dangerous emergency’ (Fingleton 1981, 222); some 60 plantations were illegally occupied and another 40 were subject to this threat in 1974; in 1971, a district commissioner in East New Britain had been killed trying to end such an occupation (Goodman, Lepani and Morawetz 1985, 237)—but government action came at a high cost. The plantation redistribution scheme led to the purchase of 68 plantations (Daniel and Sims 1986, 84), often by politically well-connected rural development corporations, many of which failed (MacWilliam 2013). Much of the land acquired ended up being removed from production altogether, and the threat of acquisition at what were seen to be inadequate prices had a chilling effect. There were few new plantations, and little investment in existing ones. In 1980, the government decided not to buy out any more plantations, but by then the damage had been done.
Palm oil is the stand-out success of the PNG commodity export sector throughout the independence period (Figure B8). Oil palm plantations were not subject to the problems that afflicted other cash crops because they were not subject to the redistribution scheme; the World Bank and other official financiers provided finance; the companies involved were larger, as were the plantations themselves; and landowners were supportive because they were involved through the ‘nucleus estate’ model, in which the plantation supported and bought produce from surrounding smallholders.
Growth in logging was also impressive over the eighties, and logging prices rose rapidly (Figure B13). Nevertheless, this sector can hardly be considered a success. Performance in terms of processed timber and government revenue was disappointing. When Paias Wingti became prime minister in 1987, he established the Barnett Forest Industry Inquiry ‘amidst rumours of massive corruption and scandalous malpractices in the timber industry’ (Saffu 1998d, 442). Attempts to reform the forestry sector were a major focus of the nineties (5.1).
One consequence of the prolonged fall in many agricultural prices was the demise of the commodity stabilisation funds for copra, coffee and cocoa. Predicting agricultural prices was next to impossible, and the funds were almost completely depleted by the end of the decade (World Bank 1993; Gumoi 1993, Table 2). From the nineties onward, the government has provided some small support to farmers from revenue and aid, but the era of commodity price stabilisation was over.
As with most discussions of PNG agriculture, our focus is on commodities, because that is what we have data on. And these cash crops are important to ordinary farmers. But so too is the much-more-difficult-to-measure production of crops for own consumption or for sale in domestic markets. Marketed fresh food has been hailed by PNG’s leading agricultural expert as ‘one of the big success stories in the PNG economy’ (Bourke 2005a, 22).
An important non-exported agricultural commodity is buai. Again, there are no quantitative estimates, but Tim Sharp, who has examined the buai trade in detail, writes that ‘since the 1970s the betel nut trade has effloresced, and has fundamentally changed the nature of highland and lowland marketplaces’ (Sharp 2012, 275).
PNG seas cover important tuna migration routes, and the tuna caught in its waters make it a significant global producer, with a share of up to 10 per cent of the global catch in some years (Kumoru and Koren 2006). Tuna are caught by a combination of resident and non-resident fishing vessels. The latter pay license fees to fish in PNG waters; the former provide export revenue and some employment. PNG’s first plans to have a domestic tuna processing sector were made during this period (Daniel and Sims 1986, 93). However, the first tuna cannery did not open until 1997 (4.3.2).
PNG has never been a manufacturing nation. Manufacturing was about 4 per cent of GDP in 1980, and that share stagnated over the decade.
Food self-sufficiency was an important theme of this period (McKillop 1981, 244). The most notable result of import substitution efforts was the decision to grow and process sugar at a commercial scale. Ramu Sugar Ltd, a joint venture mainly sponsored by the government and the UK Commonwealth Development Corporation, began production in 1982 behind a ban on sugar imports (Laveil 2019a). Notwithstanding the initial agreement that sugar would be priced at import parity, by 1984 Ramu Sugar was selling sugar at six times the world price (Daniel and Sims 1986, 88–9).
The tale of Ramu Sugar takes us well beyond the confines of this period but here we briefly peek ahead to examine its fate. The policy to support Ramu Sugar was controversial. Economists have generally opposed it: John Gibson called it a ‘major policy blunder’ (cited in Errington and Gewertz 2004, 288). The project’s backers point to the 2,500 jobs it has created and the ‘community of between 15,000 and 20,000 people, not just our employees but surrounding villages who, to one degree or another, rely on Ramu Sugar’ (Errington and Gewertz 2004, 234).
On the positive side, the ban on sugar imports was replaced by an 85 per cent tariff in 1997, and that tariff has been further reduced to 30 per cent, thereby reducing the cost to consumers of this intervention. On the negative side, Ramu Sugar’s production is only 30,000 tonnes, about the same level as when the project began in the 1980s. The company, now called Ramu Agro-Industries, has diversified into oil palm and cattle. Probably this should have been the focus from the start: PNG’s climate is not in fact suited to sugar, the crop is subject to indigenous diseases and the Ramu mill is too small to be efficient (Anderson and Bosworth 2009).
2.2.3 Resource sector
Production in copper and gold was stable over the first decade of independence and increased when Ok Tedi—another gold, silver and copper mine, this one high in the Star Mountains of the Western Province, close to the border with Indonesia, and at the other end of PNG to Panguna—commenced production in 1984.
There was also extensive exploration in the eighties, leading to the commencement of construction of the smaller Misima gold mine in 1988, and of the massive Porgera gold mine in 1989, as well as preparation for PNG’s first oil exports in the early nineties. In 1988, there was a gold rush at Mt Kare on the Enga-Southern Highlands. At its height, some 10,000 diggers worked the field unconstrained by any state supervision. Plans to construct a mine there never materialised due to landowner disputes (Ryan 1991; Henton and Flower 2007).
At independence, the government stated that it supported large mines ‘not for any direct benefit they can bring, but for the financial support that they can provide for progress towards other national goals’ (Department of Finance 1977, cited in Daniel and Sims 1986, 4). In other words, the aim was to maximise resource revenue to the national government. The government operationalised this objective in relation first to the Panguna mine (the agreement for which was renegotiated just before independence), and then to the Ok Tedi project (negotiations for which began in 1976 and were concluded in 1980). The negotiating stances developed in relation to these two projects were then generalised in 1978 into mining and petroleum policies and laws.
The government relied mainly on the corporate income tax (35 per cent) to extract its share of resource rents. It also introduced a 15 per cent tax on dividends sent abroad,2 and took a minority equity stake: about 20 per cent in the case of both Panguna and Ok Tedi. The PNG government also became the first in the world to introduce a super-profits tax, which would tax profits above a certain benchmark at a higher rate. This was the resource rents tax (RRT) of Garnaut and Clunies-Ross (1979), developed in PNG just prior to independence. Royalties were seen as distorting and kept low, just 1.25 per cent of the value of sales; they were given to the provincial governments and landowners, on which more below.
The RRT was not often triggered (in Panguna in 1974, 1979, 1980 and 1988). Nevertheless, data from 1974, when the mine agreement was renegotiated, to 1989, when it was closed, indicate that the state ended up with 75 per cent of Panguna’s net earnings before tax (Gupta 1992, 206–7; see also O’Faircheallaigh 1986). In other words, from the stated and sensible objective of national government revenue maximisation, PNG’s resource policies worked very well.
Panguna was renegotiated when power was in the hands of the government: the mine had already been built, and the country was moving to independence. As a result, it set benchmarks that have not been matched since, and not only in terms of the government’s take. The original agreement with Panguna included a provision for review every seven years. More recent agreements allow developers to sign up to a fiscal stability clause that, for a modest charge, prevents any change in terms and conditions at all (4.3.2). Panguna was also a transparent operation with the publication of its project profit and loss, something rarely seen since.
In hindsight, the two failures of policy in the resource sector in the eighties were to prevent conflict at Panguna and environmental disaster at Ok Tedi. In 1974, in the face of secessionist pressures, it was decided that nearly all royalties from Panguna would be given not to the national but to the provincial Bougainville government. Only 5 per cent of royalties was earmarked for the mine’s landowners. The small volume of royalties was one of a number of grievances of the landowners who closed down the mine in 1989 and plunged the island into a decade of conflict (5.2.4). Other problems included the environmental damage the mine was doing—mine waste was simply discharged into the Kawerong River causing lasting damage (Human Rights Centre 2020); the influx of workers from other parts of PNG; the uneven and perceived inequitable sharing of royalties among landowners (O’Callaghan 2002); and an intergenerational battle for control over royalties and power more generally among the landowners (Filer 1992). Although the Panguna agreement had a provision for renegotiation every seven years, the opportunity was not seriously pursued after 1974 (Manning 1994; Wesley-Smith 1992). This looks negligent in hindsight; however, prior to the violence on Bougainville, the possibility that landowners could close an operating mine was not seriously contemplated.
Whether greater distribution of Panguna profits to landowners would have avoided the civil war that followed will never be known, but it surely would have made conflict less likely. While the Bougainville uprising was impossible to predict, it revealed the flaw with the otherwise sound approach of government to resource projects at the time of independence. It was not sufficient only to maximise the central government take; rather, the sharing of national benefits between various stakeholders—national, provincial and landowner—had to be negotiated to the satisfaction of all parties. Over time, this lesson has been well learnt, perhaps too well learnt. Formal negotiations with landowners were introduced in the nineties through the Development Forum, and, over time, an increasing share of resource projects has gone to local interests (4.3.2).
The Ok Tedi mine was constructed in the PNG mainland’s mountainous interior. Tailings were meant to be stored in a tailings dam, but the site for the dam was damaged by an earthquake during construction. Rather than delay the mine opening, tailings were directly deposited into the Fly River, where they did significant environmental damage (Zorn 2018), which forced a corporate reckoning in the nineties (5.1.3).
2.2.4 Employment and the informal economy
Given a lack of data on total employment, we are forced to examine formal sector employment, which grew during this period (Figure B16), but not enough to keep up with population growth. Public employment was almost flat due to austerity. Private employment (including at state-owned enterprises) did better, growing at an annual average rate of 2.1 per cent. The bulk of the growth came in agriculture (Figure B17), which expanded from 44,000 workers in 1978 to 64,000 in 1988, presumably reflecting the growth in oil palm (only employees in the formal agricultural sector are captured).
As with non-commodity agriculture, which it encompasses, informal economic activity is hard to measure; however, it seems to have performed better than the formal economy. Informal economic activity had been constrained by the stifling effect of colonial regulations, as well as by ‘subsistence affluence’, the idea that well-fed villagers were not motivated to work more (Fisk 1971; Conroy 2020), and by the lack of a pre-colonial mercantile tradition. A World Bank (1978, 55) report just after independence noted ‘the almost total absence of handicraft workers and the small-scale traders, shopkeepers and service repair establishments that provide such a large volume of employment, especially urban employment, in many other countries’. But the non-agricultural informal economy took off over the eighties. Whereas Conroy (2020, 344) observed that informal activity was ‘insignificant in the capital on the eve of independence’, Dorney (1991, 92), writing at the end of our first period, remarked that ‘Port Moresby’s markets are bustling’.
2.3 The macroeconomy
In most years in this period, the government achieved its goal of fiscal prudence, but, in the absence of real revenue growth, this required severe expenditure restraint. Inflation was successfully contained. The exchange rate remained pegged, and the policy of currency convertibility was adhered to; however, the hard kina policy that there should be no devaluation was abandoned over the eighties and the gradual depletion of foreign exchange reserves increased macroeconomic risks.
2.3.1 Fiscal policy
Fiscal policy in the early post-independence years had four goals: (a) revenue smoothing, given the volatility of Panguna revenues; (b) reduced reliance on Australian aid; (c) low deficits, because too high a level of borrowing would lead to external imbalance, and ultimately require a devaluation, which was inconsistent with the hard kina policy; and (d) real expenditure growth, essential given the country’s development needs and the high expectations of the time. PNG achieved the first three, at least in part, but not the fourth.
Revenue smoothing was partly achieved. All resource sector government revenue entered the MRSF; only an amount that was considered sustainable for the next 20 years, given price and production projections, was meant to come out. Although some criticised the MRSF for not doing enough smoothing (Guest 1987), outflows from the MRSF were less volatile than inflows (Figure B30). Note, too, that the smoothing was downward. The MRSF saved at peak revenue times, but did not boost revenue as much when inflows were low. This admirable conservatism meant that the MRSF acted as a savings as well as a stabilisation fund.
The surplus accumulated by the MRSF proved a tempting target and, in the late eighties, the government started withdrawing more from the MRSF than its legislated entitlement (Oliver 1998, 465; Duncan and Temu 1995). But, even so, by 1989, the MRSF’s balance had reached a handy 2.9 per cent of GDP.
The second goal of reduced aid dependency was clearly achieved (Figure B25). This was part of PNG’s self-reliance policy, and also a necessity given agreements with Australia that its aid would fall.3 Adjusting for inflation, aid measured in kina fell on average by 5.3 per cent a year between 1977 and 1988. As a result, aid became a much smaller share of government revenue, falling from 45 to 22 per cent of total revenue between the same years.
On average, over the period, and adjusting for inflation, own revenue grew at an impressive 4.7 per cent, well above average economic growth for the period. Due to the reduction in aid, however, the average post-inflation growth in total revenue was only 1.3 per cent.
The third goal of fiscal prudence was achieved for most of the period. The deficit went up when revenue went down or stagnated (1979, 1981, 1982, 1983, 1985 and 1986), but it never stayed high for long, averaging just 1.7 per cent of GDP for the period (Figure B27 and Table 10.10). As a result, government debt was moderate, kept to 30 per cent of GDP or below. Most debt was foreign, initially commercial (including to help purchase equity in the Ok Tedi mine), but increasingly from the multilateral banks. Treasury bills were introduced in 1981 to facilitate domestic borrowing, but the share of domestic debt was only 26 per cent by 1988 (Figure B29).
The final fiscal objective of the eighties was real expenditure growth. Expenditure policy was set by the National Development Strategy (NDS) of 1976, which attempted to operationalise Somare’s Eight-Point Plan (3.1.1). In turn, the NDS was implemented via the National Public Expenditure Plan (NPEP), a four-year rolling plan updated every year (Yala and Sanida 2010, 50). Eight NPEPs were produced between 1978 and 1985; typically they aimed for real expenditure growth of 3 per cent. In 1980, Somare revised the target up to 5 per cent on the back of the Ok Tedi agreement and a favourable resource price outlook. A few months later, a less favourable outlook forced Somare to return to 3 per cent (Conroy 1980). But even that was unattainable. Average expenditure growth for this first period was only 1.1 per cent after inflation, including negative real growth every year from 1982 to 1985.4 Paias Wingti, then deputy prime minister, defended his government’s austerity policies in 1982 as unavoidable:
PNG must adjust to a much lower level of available resources to support domestic expenditures … The alternative to such an adjustment is that the nation will begin to follow the path of so many other less-developed countries. The stepping stones on this path are unmanageable government borrowing, large balance of payments deficits, devaluation, higher inflation, further devaluation and an inflationary spiral leading to economic and political instability. At the end of the path lies anarchy and the destruction of our social fabric. (Wingti 1985, 19)
It was responsible fiscal policy, but the inability to grow expenditure at least in line with population put downward pressure on government services, employment and growth.
2.3.2 Monetary policy
The Bank of Papua New Guinea (BPNG) was established in 1973 to administer monetary policy and supervise the financial system. From independence, monetary policy was intended to keep inflation low. This goal was certainly achieved in the first period, especially by global standards, as inflation was contained by avoiding a large devaluation (Figure B31 and Table 10.9).
Until the financial deregulation of the mid-eighties (3.1.2), the central bank was able to manage demand by directly changing interest rates. Then, until the early nineties, the minimum liquid asset ratio (MLAR) became the primary instrument used by BPNG to influence liquidity and, therefore, loanable funds. The MLAR was raised from 15 to 25 per cent in 1977 (a year of strong growth) but eased from 1979 when growth weakened, and ranged between 10 and 15 per cent in the second half of the eighties. Meanwhile, bank lending to the private sector grew rapidly, with outstanding loans to the private sector increasing from 7 per cent of GDP in 1977 to 17 per cent in 1986 (Figure B32). The loan-to-deposit ratio increased from just 52 per cent in 1977 to 100 per cent in 1982 and 105 per cent by 1989. By the eighties, the MLAR was binding, and actual bank liquidity tracked the minimum closely (Figure B33).
2.3.3 Exchange rate policy and the balance of payments
The hard kina policy that PNG took to independence was a commitment to ‘at least maintaining the foreign exchange value of the freely convertible kina against major world currencies’ (Goodman, Lepani and Morawetz 1985, 53). This was done to keep inflation down (inflation of 20 per cent plus in 1974 had led to public protests in Port Moresby [Hegarty 1998a]), to promote fiscal discipline, and because it was felt that, given the policy of full wage indexation, a real depreciation would be impossible. The hard kina policy had three constituent parts: convertibility, the avoidance of nominal depreciation5 and the maintenance of healthy foreign exchange reserves.
Convertibility on the current account was achieved. Demands for foreign exchange to finance imports and to repatriate capital earnings were honoured. Regarding the avoidance of nominal depreciation, at first the kina was pegged to the Australian dollar, and, in 1976, it was revalued upwards by 13 per cent (Figure B20). From 1977, the kina was pegged to a basket of currencies, with the aim of maintaining its average value against that basket (Garnaut, Baxter and Krueger 1984, 14). However, following the deterioration in the terms of trade in the early eighties, there developed a perception that the kina was overvalued. Even though there was limited formal sector wage flexibility due to indexation (3.1.2), there was a policy shift in 1983 to one of gradual depreciation:
In a marked departure from previous policy, the kina was depreciated early in the 1983 in step with the devaluation of the Australian dollar. Without any formal announcement of a policy change, the kina was allowed gradually to depreciate further, until by mid-1984 the kina-basket exchange rate was about 10 per cent below what it had been two years earlier. (Goodman, Lepani and Morawetz 1985, 54)
In all, there was a real depreciation over the eighties of about 12 per cent (Figure B21). Clearly, the earlier commitment not to devalue the kina had been set aside. The decision in 1990 to devalue by 10 per cent after the shock of the closure of the Bougainville mine (4.4.2) only confirmed this.
The current account showed a small surplus for the first few years after independence, but went into deficit in the early eighties due to lower export prices and heavy imports associated with the construction of the Ok Tedi mine (Figure B19). The current account deficit reached as high as 14 per cent of GDP in 1981 and 1982. This deficit remained for the rest of the decade, but the trend was towards balance as imports went down and exports recovered relative to GDP. By 1988, it had fallen to 6 per cent. Persistent current account deficits were mainly financed by resource-related capital inflows, but also came at a cost to foreign exchange reserves. While reserves of above USD400–500 million were maintained over the eighties, with the economy growing, and imports growing relative to the economy, this amount covered a progressively smaller number of months of imports: from five or six in the late seventies to only three in 1981 (after a series of relatively high fiscal deficits) and only just above two in 1988 (Figure B22). Such a low level of reserves undermined the credibility of the government’s hard kina policy, which relied on ‘the accumulation and maintenance of adequate international reserves to assure the credibility of policy’, to use the words of Finance Minister Julius Chan (speaking in 1975, cited in Dorney 1991, 84).
In summary, the exchange rate regime remained convertible and pegged throughout this early post-independence period, but commitment to the hard kina weakened in two ways, both of which presaged the radical changes of the nineties. First, the government started to show a willingness to engage in nominal, albeit modest, depreciation. Second, the reduction in foreign exchange reserves relative to imports made it more likely that any kina peg would end in crisis. More generally, the absence of strong economic growth in this period undermined the sustainability of sound macroeconomic policy, leading eventually to crisis, not in this period but the next.
1 As late as 1967, Australia’s foreign minister speculated that PNG might never become independent (Ley 2014, 145). When Andrew Peacock became the coalition foreign minister in early 1972, he shifted Australian policy towards a more pro-independence stance. Labor, with its new Prime Minister Gough Whitlam, came to office in late 1972 promising a quick independence for PNG.
2 For petroleum projects, the corporate income tax rate was 50 per cent, and there was no dividend withholding tax.
3 In 1976, PNG signed a five-year aid program with Australia for AUD1 billion. In 1980, a new agreement introduced a real decline of 5 per cent per year. In 1985, this was changed to 3 per cent (BPNG 2007, Appendix B)
4 The spike in expenditure/GDP in 1981 (Figure B23) is due to a decline in nominal GDP that year.
5 In 1975, Finance Minister Chan said that he could not ‘forsee circumstances in which it would be sensible to devalue the kina in terms of world major currencies’ (quoted in Griffin 1998, 260).
Previous Next



