


 menu
Struggle, Reform, Boom and Bust
6
The boom
There are fundamental economic problems [in PNG], including weak domestic demand, and the 2 per cent economic growth experienced in 2003 is not likely to improve. (Parliament of the Commonwealth of Australia 2005)
2009 was the fifth straight year to record non-mining GDP growth in excess of population growth—unprecedented for Papua New Guinea. (Gouy et al. 2010, 1)
By 2016, we expect our budget to be three times bigger due to the monies coming into the country, not only from our LNG but other major projects. (Prime Minister Peter O’Neill, cited in Price 2012)
6.1 Introduction
Once adjusted for inflation, government revenue in 2003, the last year of the ‘volatility, crisis and reform’ period examined in the last two chapters, was actually lower than in 1989, the first year of that period. Non-resource GDP per person was virtually the same. The reforming Morauta government had been deposed in the 2002 elections. The nineties had shaken confidence, and the future looked at best uncertain; many predicted a crisis or thought that one had already arrived.
And then, unanticipated by all, PNG’s resource boom began. There was rapid growth in government revenue: 17 per cent in 2004, 20 per cent in 2005, 16 per cent in 2006 and 10 per cent in 2007 (all after inflation). Government revenue only again reached its 2007 level in 2014, but the economic boom continued based first on the spending of windfall revenues from those early boom years, then on the construction of the mega PNG LNG project—by far the country’s biggest resource project to date—and throughout by renewed economic confidence. Average real GDP growth from 2003 to 2013 was 4.5 per cent. Non-resource GDP growth did even better, averaging 5.6 per cent, an unprecedented result. Formal sector employment, sluggish for two decades, grew rapidly at an average of 5.0 per cent. The exchange rate, which had plummeted in value over the nineties, steadily rose. Inflation moderated. Political stability was restored: Michael Somare returned to serve as prime minister from 2002 to 2011, and Peter O’Neill was prime minister from 2011 to 2019. Admittedly, 2011 saw a serious political crisis, but it was quickly resolved by the 2012 elections, and the country moved on.
The transition from Somare to O’Neill was a generational shift. When PNG became independent, Somare was prime minister and O’Neill was 10 years old. Somare’s rule had become increasingly lethargic. O’Neill brought a new energy to the position and in his first few years in office introduced a number of important changes: a (temporarily) tougher anti-corruption regime, a more active role for the state in the resource sector, a more expansionary fiscal policy and much more electorate funding.
The resource boom was a good thing for PNG, but not an unmitigated blessing. For one thing, the country was completely unprepared for it. The Mineral Resources Stabilisation Fund had just been abolished (4.4.3) so there was no mechanism in place for saving resource revenues during good times. The government had also recently sold off half of the equity it had accumulated in various resource projects and reduced tax rates on resource projects (4.3.2).
The boom was also mismanaged. Too much was spent too quickly, and, as the years went on, the expectation that the good times were here to stay led to heavy borrowing and rapid growth in real wages; this has made the subsequent bust harder to manage.
Finally, the boom bred complacency. The reform efforts of the previous decade largely stalled, though the opening up of the mobile telecom sector is an important exception.
Booms never last and this one ended, ironically enough, once the PNG LNG project was fully constructed in 2013. With a falling oil price, and belying expectations that were in any case inflated, the expected rivers of LNG revenue failed to materialise. Non-resource GDP per person and formal sector employment started falling, and the kina started depreciating again.
That is the story for the next part of the book. In these two chapters, we study the boom of 2004 to 2013, beginning in this chapter with economic growth and macroeconomic performance and policy, and then turning in the next chapter to economic policies, and politics and governance.
6.2 Economic growth
Economists at the time debated the causes of the boom, but, in hindsight, it is clear that high commodity prices and then PNG LNG construction were the driving forces. As resource prices rose, resource dependency increased to a new high in 2006 but then fell back to where it was at the start of this period as gold and copper production fell and the non-resource economy boomed. While growth was indeed broad-based, the resource boom left a costly legacy in terms of higher housing prices, an appreciated exchange rate and higher real wages.
6.2.1 The boom
Exactly when the resource boom began and ended can be debated. The year 2003 saw low but positive economic growth, rising formal sector employment and, for the first time in over a decade, exchange rate appreciation. However, 2003 was also characterised by high inflation and interest rates and negative real revenue growth. In 2004, which we regard as the first year of the boom, economic growth was still low, but inflation and interest rates moderated and, on the back of a rapid increase in commodity prices, government revenue started to grow, catalysing the boom that followed (Figures B12 and B24).
We take 2013 to be the last year of the boom. Construction of the PNG LNG project was substantially completed that year, and the exchange rate started to depreciate (Figure B20). In 2014, formal sector employment fell, which it continued to do every year for the next four (Figure B16).
Figure 6.1 shows the annual growth rates over this period for GDP and for non-resource GDP. Early growth was driven by resource revenue and ended with the global financial crisis (GFC). The economy quickly recovered due to a massive fiscal stimulus in 2009. PNG ran its largest fiscal deficit to date that year, financed by the spending down of temporary trust fund balances accumulated in the earlier boom years (Figure B30). In 2010 PNG LNG construction began, and this massive project took over from increasing resource revenue as the main driver of rapid growth. Growth slowed after 2010, as, by then, the construction was already built into the base.
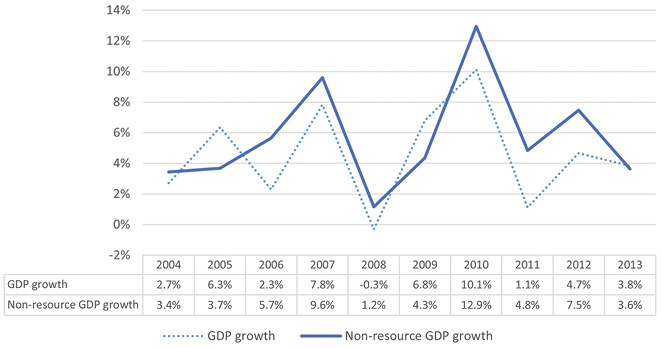
Figure 6.1: GDP and non-resource GDP growth, 2004–13 (kina, constant prices)
Source: PNG Economic Database.
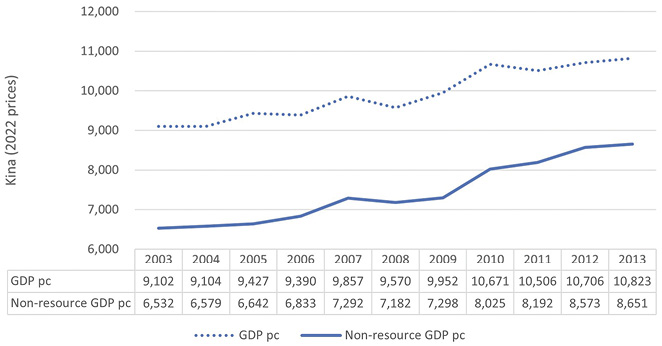
Figure 6.2: GDP and non-resource GDP per person, 2003–13 (kina, constant prices)
Source: PNG Economic Database.
The noughties was a period of sustained and significant economic expansion. Between 2003 and 2013, real non-resource GDP per person grew every year except 2008, at an average rate of 2.8 per cent (Figure 6.2). Both before and after this boom period, average non-resource growth per person has been either zero or negative (Table 10.2).
Economists argued whether the growth of the noughties was due to the reforms of the previous period or to high commodity prices, with Gouy et al. (2010) stressing the former and Kauzi and Sampson (2009) the latter. The reforms of the nineties must have helped, but this was a commodity price boom. Our PNG resource price index increases by 19 per cent in 2004, 18 per cent in 2005 and 39 per cent in 2006 (Figure B12). Commodity price growth then slowed; however, by 2010 the resource price index was 26 per cent above its 2006 level, and, by 2012, 15 per cent above 2010. On average, resource commodity prices were more than double the level of the earlier two periods (Table 10.4). The value of resource exports, adjusted for inflation, increased by 25 per cent in 2005 and 34 per cent in 2006 (Figure B15). The export/GDP ratio increased from 44 per cent in 2003 to 55 per cent in 2007, a record never since broken (Figure B19).
Of equal importance, but less emphasised, was the existence of ‘revenue-ready’ projects—resource projects that yielded large amounts of revenue for government (a high ‘government resource take’) when commodity prices were high because their production was high and/or they had already depreciated their assets. Ok Tedi was the prime case in the boom period. When prices rose in the early 2000s, its production of copper and gold was close to its maximum, and it had been in production long enough for its investments to have been depreciated. Ok Tedi’s corporate tax bill skyrocketed from about PGK50 million in the early 2000s to over PGK1 billion in 2007. Resource revenue, which had been about 2 per cent of GDP in the early 2000s, climbed to 9 per cent in 2007 (Figure B25). This ratio fell sharply with the GFC, but the average for the period was 4.9 per cent (Table 10.10), more than double the average of any of the other three periods.
Then there was the PNG LNG construction, a truly unique event in the country’s history. The ratio of the total value of that construction to nominal GDP in the year it started is 133 per cent (Table C1). This far exceeds the construction value of other major projects, such as Ok Tedi (39 per cent) and Porgera (22 per cent). Of course, all these projects have a high import content, but the figure of 133 per cent speaks for itself.
Both the beginning and end of the boom were totally unexpected. Even as the boom was starting, the IMF (2004, 23) was projecting falling government revenue relative to GDP, and GDP growth lower than the rate of population.
The quick end to the boom was even more of a shock. PNG’s Treasury had warned in the 2012 budget that PNG LNG revenue would only serve to keep resource revenue at a constant share of non-resource GDP given the depletion of revenue from other projects (Osborne 2014, Figure 2). At the time though, Treasury’s forecasts were widely ignored in the face of much more bullish projections. A now infamous 2009 study by ACIL Tasman predicted that PNG LNG (which had commissioned the study) would start paying more than PGK1.5 billion in corporate tax from 2015 onwards (Osborne 2014, Figure 5), and was widely quoted.1 The PNG Treasury increased its own revenue forecasts in the 2013 budget.
The injection of funds from PNG LNG exports would, it was claimed by many, more than offset the withdrawal of stimulus from the completion of construction. Peter Graham, who headed PNG LNG from 2009 to 2015, commented in 2011 that ‘some analysts forecast a doubling of the GDP of the country’ (Blades 2011). Another said ‘the LNG project’s success will reshape the PNG economy and the government’s fiscal resource envelope’ (Batten 2010b). Australian Foreign Minister Julie Bishop talked about ‘huge revenue’ flowing from the project to government (Garnaut 2015).
Business figures were also talking up PNG’s potential more broadly. These remarks made by the PNG Treasurer Don Polye in a 2013 speech are telling:
Many learned people … have given us projections that I find very encouraging. We recently had a visit to PNG by the CEO of the ANZ bank, Mike Smith … and he said that PNG could be the Tiger of the Pacific. (ANU TV 2013)
Sadly, none of these expectations came close to being realised. Even Treasury’s more sober 2012 forecasts turned out to be wildly over-optimistic as resource revenue dried up in the 2010s (8.3.2).
6.2.2 Sectoral developments, employment and housing
Given that we refer to this period as a boom, it seems paradoxical that non-resource GDP growth should exceed GDP growth for the period (Figure 6.1). But, in fact, in real terms (i.e. using constant prices), there was no increase in resource output and actually a marginal decline (Figure 6.3). Production of gold, copper and oil were lower in 2013 than a decade earlier, and significantly so—by 20, 60 and 45 per cent, respectively (Figure B10). This was a resource revenue boom, not a resource output one.
Confidence was high and growth was broad-based. All sectors grew faster than the rate of population, except the resource sector (Figure 6.3). The non-tradeable sectors (construction, finance, other [mainly government], transport, utilities) grew faster than the tradeable sectors (manufacturing, agriculture). This likely reflects real exchange rate appreciation (Figure B21), government revenue growth (Figure B24), and of course PNG LNG construction.
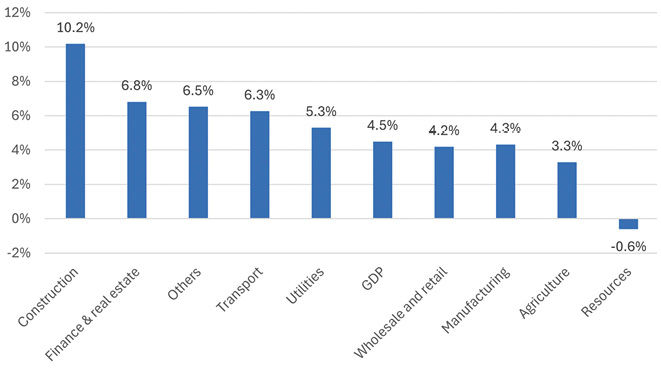
Figure 6.3: GDP growth by sector, 2003–13 (kina, constant prices)
Source: PNG Economic Database.
Although resource output fell, two new resource projects were negotiated and constructed during this period, and one came into production. The PNG LNG project had been under active consideration since the nineties. The initial plan was to pipe gas to Queensland. When it became evident that Queensland was planning to ship gas to Asia where it would fetch much higher prices, it was clear that a new approach was needed. Agreement between the government and the project developers was reached in 2009. Construction commenced in 2010. Major contributors to the USD19 billion price tag included the drilling facility in Hela (a newly created province that was carved out of the Southern Highlands as part of getting the project off the ground); a pipeline to take the gas to near Port Moresby; and a liquification plant and landing dock for ships to take the liquified gas to China, Japan and Taiwan. Exxon is the project operator and the major shareholder with a 33 per cent share. Oil Search, which operated the nearby oil fields and first developed the project, had a 29 per cent share. In 2021, it was acquired by Santos, which became the major PNG LNG shareholder with 40 per cent. The government borrowed to finance its 17 per cent share, later increased to 20 per cent. Production commenced in 2014, ahead of schedule.
The second, much smaller resource project of this period was the Ramu nickel and cobalt mine and processing plant at Madang, agreed to in 2006, with construction commencing in 2008, and production in 2010. This integrated mining-pipeline-processing project was controversial for its deep-sea dumping of tailings, which was opposed by many civil society groups.2 The tax profile over time for resource projects is often back-end loaded, as companies first pay off their depreciation and interest. In any case, the value of this project’s output was much smaller than that of the PNG LNG project, and it was given a 10-year tax holiday (after being classified as a manufacturing rather than a mining project).
The benefits of the boom are clearly shown by employment figures. Formal sector employment (excluding the public service) grew from 129,000 in 1975 to 184,000 in 2003, an annual average growth of just 1.3 per cent. However, in the boom years, employment growth averaged 5 per cent and total formal sector employment peaked at 301,000 in 2013, the first and only time it has breached the 300,000 mark (Figure B16).3 Public service employment also grew strongly over this period (7.2.2).
The PNG LNG construction workforce peaked at 21,220 in 2012, 7.3 per cent of the formal sector workforce in that year. However, the number of national employees peaked at only 8,421, just 40 per cent of that total (Voigt-Graf and Odhuno 2019, 13). PNG amended its employment legislation to exempt the LNG project from the requirement to advertise positions in PNG first. The government also prioritised LNG-related work permit applications.
Voigt-Graf (2015a) analyses visa data to show that the number of foreign workers arriving in PNG had been stable at around 14,000 from 1996 to 2003, but thereafter grew explosively to reach 70,000 in 2013 (jumping from 45,000 to 65,000 in a single year, 2012), with particularly rapid growth in Asian nationals, especially Filipinos, arriving for work (Voigt-Graf 2015b). These figures are not directly comparable with workforce numbers. However, the growth in the formal sector workforce over this period was 116,000. If each foreign worker stayed only a year, about half of this increase would have been made up by foreign workers. In other words, national employment grew but not by as much as first appearances indicate.
There is also evidence of strong real wage growth. As confidence built, minimum wages were significantly increased for the first time since they were slashed in 1992: by 50 per cent in 2005 to PGK37 per week. Minimum wages were then almost tripled in three years to PGK49 in 2009 and PGK102 in 2010, and then increased again to PGK131 in 2013 and PGK141 in 2014, at which level they have remained since. These increases were significant, but, after adjusting for inflation, still left the urban minimum at well under half of the minimum wage at independence (Figure B18 and Section 3.1.1; see also Jones and McGavin 2015; Imbun 2015).
Blunch and Davies (2024) provide the first analysis not of minimum but of average formal sector real wages, using 20 years of data on superannuation contributions from the private sector superannuation fund, NASFUND.4 They calculate that wages rose on average by about 8 per cent per year after inflation in the boom years (which they define as between 2003 and 2013). Men did slightly better than women, but both did extraordinarily well, with average wages more than doubling over this period.
However, the boom was by no means an unmitigated blessing. Its legacy of an appreciated exchange rate and higher wages made the economy less competitive, and likely slowed growth in the next period (8.2.2). This was Dutch disease with a lag. And, even at the time, a painful side effect of the boom was a dramatic escalation in housing prices. Housing prices have always been high in urban PNG, due to limited land supply and demand from cashed-up resource companies. They fell over the nineties, but then increased rapidly during the boom. Rooney (2015) shows that property prices in Port Moresby fell between 1985 and 1995, and were stable to 2000, but tripled or more between 2000 and 2010 (Table 6.1).5
Table 6.1: Advertised property sale prices, 1985–2010 (kina, constant prices)
|
1985 |
1990 |
1995 |
2000 |
2005 |
2010 |
|
|---|---|---|---|---|---|---|
|
Most exclusive (downtown Port Moresby) |
||||||
|
Maximum |
669,146 |
1,048,473 |
1,138,612 |
1,221,092 |
1,202,879 |
4,000,000 |
|
Minimum |
669,146 |
838,778 |
422,913 |
469,651 |
1,076,260 |
2,800,000 |
|
Average |
669,146 |
996,049 |
817,941 |
653,989 |
1,139,569 |
3,100,000 |
|
More exclusive (Boroko, Korobosea, Gordons, Gordons 5) |
||||||
|
Maximum |
760,393 |
671,023 |
487,976 |
657,511 |
443,166 |
2,500,000 |
|
Minimum |
425,820 |
326,192 |
146,393 |
65,751 |
341,871 |
380,000 |
|
Average |
554,001 |
450,501 |
366,999 |
358,479 |
389,353 |
1,147,692 |
|
Less exclusive (Hohola, Gerehu, Waigani, Tokarara, June Valley, Ensisi, Morata, Rainbow Estate) |
||||||
|
Maximum |
547,483 |
121,157 |
211,456 |
356,934 |
443,166 |
750,000 |
|
Minimum |
91,247 |
116,497 |
32,532 |
56,358 |
291,223 |
175,000 |
|
Average |
268,875 |
118,827 |
94,003 |
138,051 |
367,194 |
424,654 |
Notes: CPI used to convert to 2010 prices. Sales prices are for two- to three-bedroom houses for the month of June except for downtown Port Moresby in 2005, which is for August.
Source: Rooney (2015).
6.3 The macroeconomy
Fiscal performance was aided by rapid growth in revenue inflows starting in 2004 but undermined by the lack of any long-term saving mechanism for those proceeds, and by profligate spending and, ultimately, borrowing. BPNG, under new legislation, ended its practice of deficit financing, and, with the exchange rate appreciating on the back of resource inflows and PNG LNG construction, inflation moderated. The effectiveness of the central bank’s monetary policy management continued to be undermined by the deepening problem of excess liquidity.
6.3.1 Fiscal policy
The debt/GDP ratio fell from 39 per cent in 2003 to 25 per cent in 2013. This suggests successful fiscal management, but a closer look raises more questions.
The key fiscal fact of this period is explosive revenue growth (Mako 2012). Revenue grew by 79 per cent after inflation between 2003 and 2007 (Figure B24) and from 18 to 25 per cent of GDP (Figure B23).
The 2003–07 revenue spike was due to a resource revenue boom (Figure B25). Resource revenue thereafter started to fall, but total revenue remained high due to broad-based growth (6.2.2). Aid continued to fall relative to GDP (Figure B25).
Both the government and analysts were surprised by this rapid increase in revenue, as they were by the boom more generally. PNG had run deficits every year from 1998 to 2003, leading one commentator to make the reasonable inference that PNG was ‘in all likelihood caught in a high debt and persistent deficit spiral’ (Chand 2004, 17). While the 2002–07 Medium Term Fiscal Strategy (Department of Treasury 2005) promised fiscal balance by 2009, in fact, surpluses were achieved every year from 2004 to 2008.6 The 2005–10 Medium Term Development Strategy, also written before the boom was evident, had ‘resource availability forecast to remain more or less constant in real terms’ (GoPNG 2004, 53). It could not have been more wrong.
PNG had abolished the Mineral Resources Stabilisation Fund in 1999 (4.4.3). Therefore, it had no mechanism in place to save windfall revenues. Efforts were made, with Australian encouragement (7.2.6), to put in place a sovereign wealth fund, but these were unsuccessful (7.1.3). Initially, expenditure restraint was exercised, and between 2003 and 2007 real expenditure increased by an annual average of 7.2 per cent, less than half of the revenue growth being experienced. A small amount of the resulting combined 2004–08 surpluses was used to pay down debt (16 per cent or about 3 per cent of GDP) but most (82 per cent)7 went into what were known as trust funds, much of it through supplementary budgets brought down in the course of the year to allocate unexpected revenues. Trust funds were earmarked for specific spending areas (school rehabilitation, agriculture, etc.), and so were at best only a short-term smoothing mechanism. The balance on all trust funds reached 10 per cent of GDP in 2008, but half of that was spent the following year, as real expenditure increased by 21 per cent following the GFC. By 2012 the balance on trust funds was down to 2.5 per cent of GDP (Figure B30).8 In other words, by the end of the boom, very little had been saved. Moreover, as discussed in the next chapter (7.2.2), a lot had been wasted.
Meanwhile, the appetite to spend and borrow was increasing. After O’Neill won the 2012 elections, he increased expenditure in 2013 by 26 per cent after inflation, the largest increase ever, financed by a deficit of 6.9 per cent of GDP, the highest to that point (Figure B27).
Revenue growth had slowed in 2012 and 2013, but it was widely believed that LNG exports, beginning in 2014, would deliver a massive revenue boost to government. O’Neill defended his 2013 budget in the following terms:
The budget is a deficit budget. I make no apology for that, none whatsoever. We are borrowing now certain in the knowledge the revenue inflows from mining and LNG projects will make repayment manageable. I have noted with approval that many analysts have endorsed this strategy. (Flanagan and Fletcher 2018, 35)
This rush to spend and borrow suited O’Neill’s impatience, and was, as he said, supported by much of the public commentary (6.2.1).9 However, in hindsight, it was clearly a policy error. After all, whatever the future held, the economy was already booming. Surely it was time to save or, at a minimum, not run a record deficit. As things turned out, the assumption that revenue would keep growing—let alone triple by 2016 as per the 2012 quote from the former prime minister with which this chapter began—proved to be completely fallacious.
The expansionary fiscal policy adopted blew PNG’s new fiscal targets out of the water. The 2008–12 Medium Term Fiscal Strategy (Department of Treasury 2008) envisaged debt stabilising at 20 per cent of GDP by 2012. In fact, based on the old GDP series that was then being used, debt bottomed out at 26 per cent in 2011, and increased to 38 per cent by 2013. (GDP was rebased upwards in 2016, changing all these ratios.) A Fiscal Responsibility Act was introduced in 2006. This prohibited the ‘overall level of debt’ from rising and required that the budget be in balance during any term of government. That rule was abandoned as too strict in 2013, and successive amendments have been made to increase the debt cap (8.3.3).
Debt-retirement efforts in the early years of the boom were focused on foreign debt, and the deficits of 2012 and 2013 were largely domestically financed, meaning that by 2014, three-quarters of government debt was domestic, a record (Figure B29).
In summary, serious fiscal policy errors were made during the boom period. In the early boom years, up to 2008, funds were saved, but, given the nature of the trust funds they were put in, only for the short term. It is no surprise then that, in the late boom years, the short-term savings were spent; moreover, there was then too much borrowing.
6.3.2 Monetary policy
Inflation spiked in 2008 at 10.8 per cent, but overall the period was characterised by moderate inflation, an average of 4.4 per cent (Table 10.9). This can be explained by consistent exchange rate appreciation on the back of resource inflows and PNG LNG construction. During this period, the kina gained in value against the US dollar every year except for two (2009 and 2013), at an average rate of 4.9 per cent (Figure B20). As a result, the real effective exchange rate regained all the value it had lost over the nineties, returning to close to its pre-independence level (Figure B21). BPNG was also able to rebuild its foreign exchange reserves, which peaked in 2012 at USD4 billion compared to 490 million in 2003 (Figure B22).
With a bar on deficit financing, and fiscal surpluses rather than deficits in the early years of the boom, central bank holdings of government debt plummeted to almost zero (Figure B35).
Consistent with faster growth and higher confidence, loans from the commercial banks to the private sector rose from just 7 per cent of GDP in 2003 to as high as 17 per cent in 2013, almost matching the levels of the late eighties. Commercial bank deposits rose even more sharply from 15 per cent of GDP in 2003 to 39 per cent in 2013 (Figure B32).
This growth of deposits relative to loans worsened the problem of excess liquidity that had emerged in the late nineties (4.4.4). The cash reserve requirement was gradually increased starting in 2010 from 3 per cent to 10 per cent in 2014. Increasingly, banks parked their deposits with the central bank. The share of commercial bank deposits held at the central bank (or as cash) increased from 10 per cent in 2003 to 16 per cent in 2013 (Figure B36). For a few years in the mid-noughties, BPNG engaged in the sale of central bank bills (CBB). This gave banks another use for their deposits, but it was expensive and inadequate to mop up the excess liquidity, and BPNG eased back on CBB sales.
Excess liquidity remains a feature of the PNG economy to this day. Its solution is greater lending, but this requires more competition among banks and more bankable projects.
1 For example, Gouy et al. (2010) predicted that ‘revenues amounting to about one-third of production will flow to the government from the outset in about 2015’.
2 The Somare government amended the Environmental Act in 2010 to remove the power of the courts to review environmental decisions. The amendments were reversed in 2012.
3 Unfortunately, no annual figures are available on public service employment for this period. However, we know it increased nearly 30 per cent from 2002 to 2015 (Figure B16).
4 Wages can be backed out from the superannuation data, given compulsory superannuation rates.
5 Another estimate is that ‘rental rates for high-end residential units in Port Moresby doubled between 2008 and 2012’, reaching PGK8,000 per week (Oxford Business Group 2015).
6 The deficit calculations in the text exclude deposits into trust funds as expenditures; PNG budgets at the time included them as expenditures. If they are included, there were surpluses in 2003, 2004, 2006 and 2007.
7 The 2 per cent residual could correspond to changes in cash balances, for example.
8 In 2009, expenditure slightly violated the 2008–12 Medium Term Fiscal Strategy, which restricted trust fund drawdowns to 4 per cent of GDP, but the more important point is that these funds should have been saved for a much longer period of time, and not pre-allocated.
9 For example, Batten (2012) wrote of the 2013 budget that ‘the significant economic stimulus that this spending will provide is well timed to counter falling domestic demand as LNG construction begins to wind down next year’.
Previous Next



