


 menu
Struggle, Reform, Boom and Bust
8
The bust and its macroeconomics
Mr Mackellar [CEO of PNG hardware firm Brian Bell] said for many years businesses have been restricted with their growth potential via this heavily regulated currency situation within PNG.
‘It continues to have a negative impact on employment opportunities and reduces taxable income for the government. If businesses can’t access what they need in foreign currency, at the time when they need it, it quite genuinely limits their growth potential which in turn impacts the economy negatively’, said Mr Mackellar.
He said every business that requires some level of foreign currency is required to apply for that FX through their bank or banks on a daily basis to see if the bank can then provide an allocation, either in part or in full for their currency needs.
‘As a business we have been doing this for longer than I can remember now and [there are] no signs of it changing. Our banks have been very supportive but they are limited with the foreign currency they are allocated by the Central Bank.’ (Tom 2022)
8.1 Introduction
In Papua New Guinea in 2014, optimism was at an all-time high. The country’s mega LNG project made its first shipment in May. These exports were supposed to unleash a flood of revenue for the government. Other resource projects were to follow. Things had been good over the last decade; they were, it was thought, about to get even better. They did not. Government resource revenue in fact plummeted. Formal sector employment fell every year between 2014 and 2018. Non-resource GDP per person started to fall in 2015 and fell every year except one to 2020. Fiscal stress intensified; by 2019, PNG’s ratio of debt to GDP was back at pre-boom levels.
Superficially, the period from 2014 to the current times was a return to the eighties. Growth was slow, the exchange rate was once again pegged and there was a return to an emphasis on economic nationalism and state-led development. However, a crucial difference is that current account convertibility was replaced by foreign exchange rationing to limit the need for depreciation. This ensured there would be no balance of payments crisis—hence the term ‘the quiet bust’—but also compressed imports, encouraged fiscal profligacy, discouraged investors and prolonged the downturn.
The politics of the period was dominated by Peter O’Neill, PNG’s second-longest serving prime minister, who became an increasingly controversial and polarising figure, trapped by his earlier narrative of success. When he was finally defeated in a vote of no confidence in 2019, one of the first statements by his successor and former finance minister, James Marape, was an admission that the economy was ‘bleeding and struggling’. Marape turned up the rhetoric on economic nationalism, but also did what O’Neill had long refused to do and call in the IMF. With the onset of the COVID-19 pandemic in 2020, PNG’s economic woes intensified. But then, in 2022, oil prices shot up as a result of the Ukraine war, PNG’s commodity price index reached an all-time high, resource revenue at last recovered to a healthy level and economic growth increased, ending the bust.
This is the first published retrospective on the 2010s in PNG. This and the next chapter include policy developments up to early 2024, but mainly rely on data up to 2022. This chapter includes an account of the period’s growth slowdown and the macroeconomic policies that exacerbated it. The next examines the shift towards nationalistic and statist policies and developments in politics and governance.
8.2 Economic growth
Of the four periods examined, this is the one for which the distinction between GDP and non-resource GDP growth is the most important. Sectoral developments in this period are consistent with a widespread downturn. Employment fared even worse than non-resource output. Throughout the bust, PNG was said to be one resource project away from recovery.
8.2.1 The bust
If we are satisfied with GDP as a good measure of economic activity for PNG, then we should regard this period as a continuation of the previous period’s boom. GDP growth averaged 3.8 per cent, not far behind the boom period’s average of 4.5 per cent. If, however, as we should (1.2.3), we rely on non-resource GDP growth as a superior measure of national economic activity, then we see average growth of only 2.0 per cent for this period, in stark contrast to the boom’s 5.6 per cent.
As Figure 8.1 shows, GDP growth started high and fell during this period as LNG sales were increasingly built into the base (production began midway through 2014). In 2015, there was a drought, which hurt both agriculture and water-reliant mining projects, in particular Ok Tedi. In 2018 there was an earthquake in the Highlands that interrupted resource production. Negative growth in 2020 reflects the closure of the Porgera gold mine (8.2.3) and the impact of the COVID-19 pandemic, which resulted in external and internal restrictions on movement and reduced commodity prices. GDP contracted by 3.2 per cent in 2020, with government revenue falling in the same year from 16.3 to 14.7 per cent of GDP.
The good years for non-resource GDP growth were 2014 and 2018, both years of expenditure expansion in a period of austerity, and the COVID recovery years of 2021 and 2022. Record high commodity prices in 2022 as a result of the war in Ukraine boosted resource revenue in 2022 (Figure B25), fuelling fiscal expansion and pushing that year’s non-resource GDP growth up to 5.9 per cent. Non-resource growth of 4.7 per cent in 2023 confirmed that the bust was over.
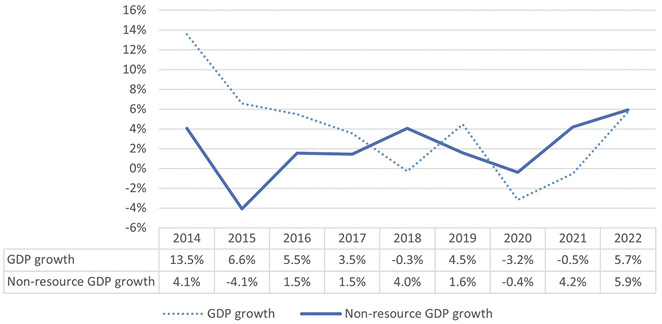
Figure 8.1: Real GDP and non-resource GDP growth, 2014–22 (kina, constant prices)
Source: PNG Economic Database.
Non-resource GDP per person fell every year from 2014 to 2020 except for a marginal increase in 2018 (Figure 8.2). It ended the period some 6 per cent below where it started. GDP per person jumped between 2013 and 2016 by about 18 per cent due to the commencement of the PNG LNG exports before first plateauing and then falling.
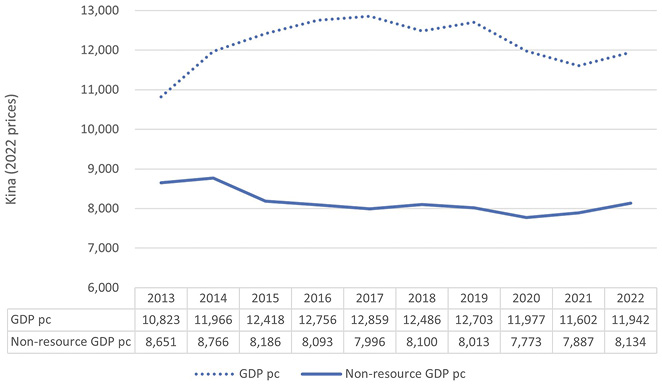
Figure 8.2: Real GDP and non-resource GDP per person, 2013–22 (kina, constant prices)
Source: PNG Economic Database.
The impressive GDP figures are explained by the commencement of LNG production, which almost doubled exports. But why was non-resource growth so low in this period? There are a range of reasons. This section provides some sectoral and employment analysis, and discusses the absence of new resource projects coming online during these years. The next section analyses the macroeconomics of the bust.
Before going further, we should note that in 2016 the National Statistical Office revised PNG’s GDP series from 2006 onwards, increasing it by about 60 per cent in nominal terms. Though PNG is not the only country to have undertaken such a radical rebasing, no explanation has ever been provided for this. Only data for the rebased series are now produced, and all the GDP figures in this book are either drawn from or (for earlier years) are consistent with the new series (for details, see Howes, Fox et al. 2022, Appendix).
8.2.2 Sectoral developments and employment
Only the resource sector grew quickly in this period. Gold production reached its highest level ever, and LNG came to make up more than half of the resource export bundle. Resource dependency rose over the period, setting a record of 32 per cent in 2022 (Figure B2). Growth in other sectors was harmed by the growth in real wages and property prices, and the appreciation in the exchange rate that resulted from the previous period’s boom (6.2.2)—a lagged Dutch disease—as well as by a loss of confidence. PNG businesses were surprised by the economic downturn, as they had expected continuing strong growth. Businesses found that they were in an ‘overhang’: they had borrowed too much and expanded too rapidly. They were then forced to focus on retrenchment and consolidation rather than expansion (Howes et al. 2019, 275).
Manufacturing contracted with an average annual growth of –0.5 per cent over this period. Agricultural growth recorded average growth of 2.1 per cent. Most agricultural commodities continued to stagnate or contract, though log exports reached a record and palm oil continued to grow (Figures B7 and B8). Marine products (fish exports) grew rapidly, reflecting a growing domestic fleet, as did ‘other agricultural products’, that is, new crops such as vanilla (Figure B9).
Trends in air arrivals are consistent with our boom-bust story (Figure 8.3). These were stagnant between 1996 and 2002, then more than tripled to 2015 before starting to fall (Liu and Howes 2022).
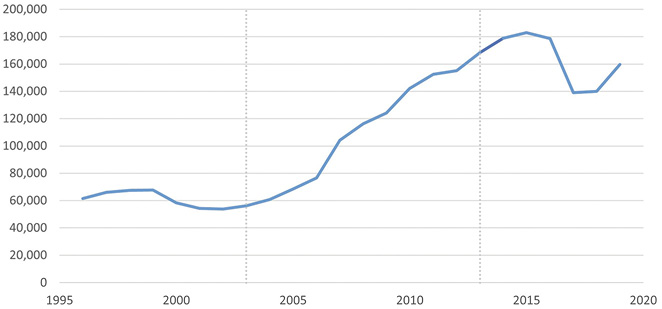
Figure 8.3: Air arrivals to Papua New Guinea, 1996–2019
Source: Liu and Howes (2022) based on data from PNG Tourism Promotion Authority.
Tourism has always struggled in PNG, with high costs and law and order problems negating the country’s many attractions. Things went backwards in the tens (Liu and Howes 2022). A positive was that cruises started bringing tourists by sea to PNG. By 2019, 51,400 cruise visitors were recorded. On the other hand, tourists arriving by air (which had been increasing) fell from a peak of 38,300 in 2015 to just 25,200 in 2019. Since airborne tourists spend on average about 18 times as much as cruise arrivals (TPA and Acorn 2021), the net impact of these developments on the economy was negative.
Formal private sector and SOE employment peaked at 301,000 in 2013 and fell every year thereafter, except for 2019 and 2022, to finish at 268,000 in 2022, 89 per cent of the 2013 level (Figure B16). Ongoing decline rather than stagnation or slow growth in employment may also be explained by the boom overhang.
Expatriate employment had grown rapidly during the boom (6.2.2). Arrivals for the purpose of employment fell from their peak of 70,000 in 2013 to around 50,000 in the subsequent years, but recovered to 64,000 in 2019, well above their pre-boom (1996–2003) average of 14,300 (Liu and Howes 2022). This means that the number of national workers is not back at 2011 levels, as suggested by the employment data, but at an earlier year, since the share of foreign workers to the total workforce has grown. Why this is requires further research, but a growing share of foreign workers in a declining pool of formal sector employment opportunities is a worrying sign.
Real wages grew strongly over the boom (6.2.2) but stagnated during the bust. Blunch and Davies (2024) estimate an annual average decrease in formal sector real wages of 0.6–0.8 per cent between 2014 and 2018, the most recent year for which data are available.
Consistent with the downturn, outstanding loans from PNG’s commercial banks to private sector and state-owned enterprises (SOEs) declined from 17 per cent of GDP in 2013 to 12 per cent in 2022 (Figure B32).The Kina Group, a set of local financial companies, bought out Malaysian Maybank in 2015, and then acquired ANZ’s non-corporate banking business in mid-2018. While ANZ continues to serve the corporate sector in PNG, Westpac decided to exit altogether, which would have left BSP and Kina as the only two remaining retail banks. Westpac agreed on a sale to Kina, but that was overruled by the regulator on competition grounds in 2021, and in 2023 the Australian bank reversed its decision to leave.
The increased competition provided by Kina is evident from the reduction in lending rates in the late tens (Figure B34). Meanwhile, progress in financial inclusion was made on a number of fronts (Figure B37). PNG has had a tradition of credit cooperatives, but their number and customers have stagnated. On the other hand, the number of microfinance institutions (MFIs) increased from one in 2004 to five in 2020, and the number of microfinance customers reached 450,000 compared to the 260,000 customers of credit cooperatives. The reduction in the number of bank branches and agents over the nineties was reversed (Figure B37), and, of course, electronic payment systems and automated teller machines (ATMs) made their entry, though PNG is still a relative laggard (with the 21st-lowest ratio of ATMs to population among all countries in 2021).1
The most spectacular change was in the number of adults with a bank account, which, according to data from the IMF Financial Access Survey, grew from under 1 million in 2006 to 6 million in 2021. However, even if these data are reliable (an increase of 2 million in just one year, 2021, is implausible) field research has cast doubt on the number of adults using bank accounts that they were encouraged to open (Hoy and Toth 2020).
Microinsurance was a success with the entry of the Swedish health company BIMA in 2014, which, in collaboration with Digicel and Capital Life Insurance, started offering life, health and disability insurance, with payments through mobile credit. As of 2017, it had 350,000 active polices (IFC 2018, 19).
8.2.3 Resource sector optimism and delays
Throughout this period, PNG was said to be one project away from recovery. As early as 2012, Prime Minister O’Neill (2012b) said that a second LNG project (Papua LNG) had been approved. Other mines such as Wafi-Golpu and Frieda River have been hailed as imminent more than once over the last decade (Price 2012). In 2019, the then treasurer said that ‘Papua New Guinea is in the early stages of an unprecedented economic development phase based on the expansion of the mining and petroleum sector’ (Basil 2019). Business commentators were bullish throughout, damaging their credibility in the process (Howes and Mako 2023a). For example, in 2018, the ANZ suggested that PNG was ‘on the cusp of another resource boom’ (Sen 2018).
And, yet, as of the end of 2023, PNG LNG remains the last major resource project to have been fully negotiated, with its final investment decision reached at the end of 2009. That this last period is the only one of the four without any new resource projects certainly means that it has been uniquely deprived of an important source of economic stimulus.
A second LNG project, named Papua LNG on account of its location in the Gulf Province, is the one that has made most progress. An agreement for that project was signed in April 2019. The change of government and COVID-19 delayed things. The final investment decision date has been repeatedly pushed back, and, at the time of writing, is now expected in 2025 (Pekic 2021; Macdonald-Smith 2023; Reuters 2024). The expansion of the PNG LNG project to include the P’ynang gas fields, preparations for which were underway in 2016, is now expected to follow only after PNG LNG construction is complete (Business Advantage PNG 2021b). Agreement on a much smaller offshore gas project has been elusive (Searancke 2021). A memorandum of understanding for the large copper and gold Wafi-Golpu project was signed in 2018, but the project then became stuck in the courts and negotiations are still underway (Badui-Owa 2021).
Globally, many resource projects are subject to delay (Cust and Mihalyi 2017), and there are a number of factors that push out timelines in PNG, in some cases increasingly so. One of the biggest problems for mining projects in PNG is where to put the waste. Panguna, Ok Tedi and Porgera have all demonstrated the risks involved with on-land disposal. Newer mines (Lihir, Ramu Nickel) have disposed of their waste at sea, but this, too, is contentious, and often the cause of popular opposition (LoopPNG 2021a, 2021b).
Landowner opposition and protest are common, especially during the preparation stage (Yafoi 2019). Again, this is in part because of past experience. Although the identification of landowner groups is meant to be concluded before the commencement of project construction, so that benefit flows can begin immediately, under the PNG LNG project that determination is still incomplete, long after production commenced.2 Whatever the reasons for this (Filer 2019b), it is an experience unlikely to inspire confidence in landowners in relation to future resource projects, and some landowners have already taken the Papua LNG developers to court (Post-Courier 2019; Harriman 2021). Indeed, with PNG becoming an increasingly litigious society (9.2.2), those opposed to mines, whether on environmental or social grounds, as well as those wanting a better deal from them, whether landowners or provincial governments, can and do often go to court.3
Finally, there is the ‘Take back PNG’ agenda, motivated by a lack of development despite successive large resource projects, and in particular the disappointment around the PNG LNG project. Delays are accepted as the price of negotiating a harder deal, and politically are a way to signal a hard stance, whether one is being taken or not. The Papua LNG project was negotiated by the O’Neill government in early 2019, but then ‘reviewed’ and ‘renegotiated’ rather than re-agreed (as it actually was) by the Marape government later in the same year.
In fact, over this period, not only did PNG not gain any new projects, but it lost an existing one. In August 2019, the 30-year operating lease for the Porgera gold mine expired. In April 2020, Prime Minister Marape informed the two major shareholders, Barrick from Canada and the Zijin Mining Group from China, that their lease would not be extended, citing longstanding environmental and resettlement issues. In August 2020, the PNG government issued a 20-year special lease for Porgera to its SOE, Kumul Mineral Holdings. Meanwhile, the Porgera shareholders took the PNG government to the PNG courts and to international arbitration for expropriation. While the government was not bound by law to extend the lease, Porgera’s owners argued that it had a legitimate expectation to be granted an extension (Burton and Banks 2020). The government backed off on reopening the mine through its SOE, and, in April 2021, announced a new deal with the Porgera shareholders (9.1.4)—one that the prime minister sold as being ‘far superior’ (Marape 2021) but that informed observers said was actually little different from the deal Porgera had offered prior to its lease expiry (Vailala 2020). Work on recommissioning the mine commenced at the end of 2023 after the Mining Act was amended to remove the requirement that landowner compensation arrangements be worked out prior to the commencement of operations, but its operations are threatened by illegal miners (Pearl and Joku 2024). Porgera has never paid much corporate tax (8.3.2) so its closure had a significant local impact but not a national fiscal one.
8.3 The macroeconomy
Why did the downturn last so long? The previous section provided some answers to this question in terms of the lack of new resource projects, and an overhang from the earlier boom. This section examines two macroeconomic factors that prolonged the downturn. First, on the external front, a move away from currency convertibility compressed imports, allowed the exchange rate to be overvalued and damaged investor confidence. Second, there was record low resource revenue. The section also explains the persistently high deficits of the period as a consequence of non-convertibility, and reviews recent reforms to the Bank of Papua New Guinea and the re-emergence of budget support.
8.3.1 Foreign exchange rationing
PNG has two foreign exchange markets: the open or general market at which anyone can trade currencies, and the inter-bank market, in which only licensed dealers can operate, and into which the Bank of Papua New Guinea (BPNG) buys or, more often, sells US dollars.
PNG’s kina, which had appreciated steadily during the boom, fell in 2013 by 6.9 per cent against the US dollar. By the end of May 2014, the kina had lost another 13.6 per cent on the open market. BPNG, which under its 2000 legislation had been handed authority for the exchange rate, decided that enough was enough. In June 2014, it introduced new so-called ‘trading bands’ that meant that the price of the kina in the inter-bank market became the price in the open market. Since a divergence had opened up between the two markets, this forced the kina up in the open market, resulting in an immediate appreciation of 17 per cent. Suddenly facing a much more attractive conversion rate for their holdings of kina, many rushed to buy dollars, and, in the face of limited supply, a queue developed. Thus ended the time-honoured policy in PNG (and most other but not all countries) of current account convertibility under which importers and those wishing to repatriate profits have automatic access to foreign exchange.
Ever since, foreign exchange shortages have been a deterrent for investors, and a cost for business. In 2021, a US government report noted:
While there are no legal time limitations on remittances, foreign companies have waited many months for large transfers or performed transfers in small increments over time due to a shortage of foreign exchange. (US State 2021)
PNG’s imports fell from close to 50 per cent of GDP during the boom to below 30 per cent during the bust (Table 10.7). Paradoxically, this import compression occurred despite strong export growth, leading to a record current account surplus of 14 per cent on average for the period. The PNG LNG project doubled the value of exports, but its revenue went largely offshore, including to repay construction-related debts. Foreign exchange reserves were protected (via rationing) and were not allowed to fall to the levels they had reached in the nineties, whether in absolute terms or as months of imports (Figure B22).
Figure 8.4, based on annual surveys of PNG CEOs, shows the top two concerns of businesses (on average) since 2014: foreign exchange and security. Between 2014 and 2024, foreign exchange has been the top concern for CEOs in six years and the second- to fourth-most important concern in four. It has, on average, been a more pressing concern than security, normally PNG business’s main worry.
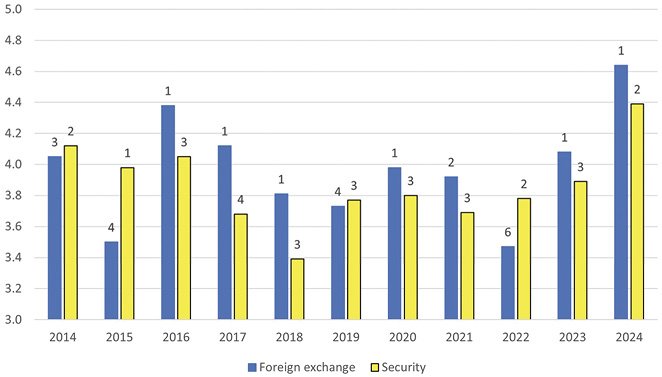
Figure 8.4: Top two business constraints according to PNG CEOs, 2014–24
Notes: Annual surveys published at the start of the year by Business Advantage PNG. CEOs are asked to rate concerns on a scale of 1–5, where 5 is reserved for the most serious concerns. The numbers on the top of each columns show the ranking of the two concerns shown out of some 20, where 1 is the concern that gets the highest average rating across CEOs. The two concerns shown have the highest average rating for the period shown. The survey started in 2012, but foreign exchange did not appear as an issue for businesses until 2014.
Source: Updated from Igara and Howes (2023).
Foreign exchange rationing has had all sorts of negative impacts on growth and development. Some import compression was inevitable following the boom, but rationing, by minimising depreciation, has exacerbated it. In 2021, Virgin Australia exited the PNG market on account of foreign exchange shortages. (In 2018, the Independent Consumer & Competition Commission disallowed the Air Niugini–Qantas code share, and these two airlines now provide the only competition on Australia-PNG routes.) Rationing has repeatedly grounded airlines due to shortages of imported fuel, has sometimes resulted in petrol rationing and has led to drug shortages (Salmang 2023). Foreign exchange rationing has also led to rent-seeking and lobbying. The Independent Advisory Group on the Central Banking Act noted in its 2021 report that it had ‘heard stories from businesses [about] having to text the Governor or reach him through an intermediary in order to request the release of foreign exchange to finance vital imports’ (Igara, Kamit and Howes 2021, 74).
The introduction of rationing meant that the exchange rate was no longer floating (though BPNG insisted that it was). The inter-bank market continued, but the incentive of dealers to bid down the kina was greatly weakened. They could no longer, because of the imposition of trading bands, compete on price outside the inter-bank market, and in the inter-bank market BPNG allocated foreign exchange not through an auction but on the basis of non-price factors, principally the stock of outstanding foreign exchange orders. All this, combined with the use of moral suasion from time to time, undermined the earlier floating regime, and the system became akin to a crawling peg with a bias against depreciation.
The kina was linked to the US dollar rather than a basket of currencies as in the eighties (2.3.3). As the US dollar strengthened over this period, any tendency to depreciation was further weakened: average nominal depreciation of the kina over this period against the US dollar was 5.1 per cent, but on a trade-weighted basis only 2.4 per cent (Table 10.9).
For some periods (June 2016–August 2017 and November 2020–April 2023), the kina was simply fixed against the US dollar (Figure B20). In others, it was allowed to depreciate slowly. The net result is that kina depreciation since the boom has been modest. The real effective exchange rate remained as high as it was at its boomtime peak, and not much lower than at independence (Figure B21). Various analyses have confirmed that the kina is overvalued (Fox and Schrӧder 2017; Davies 2021), as indeed it must be given the excess demand for foreign currency. While many commentators are sceptical that depreciation will help the PNG economy, noting supply-side rigidities, there can be no doubt that the hard-won competitiveness gains of the nineties have been surrendered and the economy prevented from adjusting to a post-boom era.
While the abandonment of a floating exchange rate suggests a return to the economic policy of the eighties, the reliance on non-convertibility was a major and new shift. A decade after independence, Daniel and Sims (1986, 36) noted that ‘all governments since independence have been committed to a strong and convertible currency and there are very few impediments to bringing money in or sending it out’. In his 1991 budget speech, Finance Minister Paul Pora (1990, 4) boasted that, despite the closure of the Panguna mine, ‘our currency continues to be easily convertible’. Economists at the time confirmed that the central bank ‘since its creation has been highly successful in ensuring a freely convertible kina’ (Gupta 1992, 6). Despite the turmoil of the nineties, King and Sugden (1997, 25) awarded the PNG government ‘high marks’ for convertibility. Current-account convertibility continued through the boom years but was brought to an abrupt end in 2014.
The more BPNG has tried to regulate access to foreign exchange (foreign exchange regulations were tightened in 2016 and then in 2022), the more companies have tried to circumvent them, including by buying coffee and other commodities in kina and at a discount to get access to dollars. However, there has been no suggestion that the black market will grow big enough to force a devaluation. Unlike in many other countries with artificially controlled exchange rates, there is no widely quoted black market exchange rate (Davies 2021).
The costs of this shift towards foreign exchange rationing and an overvalued kina are obvious and massive. Why were they incurred? Rationing was made possible as a result of the 2000 Central Banking Act, one of the cornerstone-Morauta reforms (5.1.3), which not only gave responsibility for the exchange rate to BPNG, but also, perhaps inadvertently, removed the requirement that the exchange rate be managed in compliance with the country’s international agreements. When PNG joined the IMF in 1975, it signed up to that body’s articles of association, including article VIII, which forbids foreign exchange rationing. The fact that before, but not after 2000, domestic law required this external commitment be adhered to allowed BPNG to ignore it from 2014 onwards.
The shift to rationing was not entered into with any degree of transparency and public deliberation. In fact, according to BPNG governor Lok Bakani, it was introduced as a ‘short-term measure to a short-term problem’ (Albaniel 2016). The policy of rationing was attractive though and, even as its costs became increasingly obvious, was retained to avoid two features of the nineties: one, a balance of payments crisis; two, significant currency depreciation.
After all, the nineties was seen as a traumatic decade—a time of failure. The large depreciations of the nineties had caused real economic pain to PNG’s urban population, which, though only a small proportion of the total population, often seems much more influential than the rural majority. A weaker kina would mean higher prices for imported food for urban dwellers, and higher prices for overseas schools, health care and holidays for PNG’s elite.
Finally, the Central Banking Act 2000 set the control of inflation as the only legitimate goal for monetary policy. This meant BPNG could ignore the adverse growth consequences of rationing. With monetary policy continuing to be ineffective due to excess liquidity (Figure B36)—ironically driven in part by the inability of businesses to freely convert kina into dollars—the exchange rate was the only instrument BPNG had to control inflation. Again and again over this period, the IMF in its annual surveillance reports recommended to BPNG that it allow the kina to depreciate; consistently the latter responded that this would increase inflation, as it surely would. It was not until the end of 2021 that the Central Banking Act was amended to force BPNG to consider growth as well as inflation when setting monetary (and thus exchange rate) policy—and this amendment was reversed in 2024 (8.3.4).
This amendment, plus the agreement entered into with the IMF in 2023 (8.3.5), had some positive outcomes: an end to denial by the central bank that there was rationing, increased releases of foreign exchange and a modest devaluation against the US dollar starting in the second half of 2023. However, rationing, while reduced, has outlived the end of the bust (Figure 8.4) and, as of the first half of 2024, businesses continued to complain virulently about foreign exchange shortages (Shlezinger 2024). Absent any commitment to return to convertibility, when this problem will end is unclear. Moreover, if and when it does, there is now the clear risk of a return to rationing.
8.3.2 Low resource revenue
The boom of the previous period was explained in Chapter 6 by reference first to high resource revenue flowing to government and then to a construction boom centred around the PNG LNG project (6.2.1). Construction of that project was completed in 2013, but the boom may well have continued had resource revenue held up, or, as was anticipated by many, increased. Instead, resource revenue collapsed to an average of only 1.5 per cent of GDP for the bust, the lowest of the four periods and just a fraction of the 4.9 per cent average seen during the boom (Table 10.10).
Explaining this collapse first requires understanding why PNG LNG did not deliver the massive revenue that was anticipated of it. The ACIL Tasman report commissioned by Exxon (6.2.1) provided projections of corporate tax revenue from PNG LNG of more than PGK1.5 billion from 2014 to 2023 under the base case, and PGK2.5 billion after that (ACIL Tasman 2009). Over time, these projections found their way into both public discourse and government forecasts. Yet, until recently, very little revenue from PNG LNG has actually found its way into the budget. Why (beyond the obvious incentives this consulting group faced given who commissioned the study)?
ACIL Tasman projections were based on USD9 billion capital costs. Actual PNG LNG capital costs were USD19 billion. Operating costs may well have been higher than projected as well. Oil and gas prices fell in 2014, but have since recovered, and, offsetting this, production has been higher than expected. Some have suggested tax havens are the culprit: the company responsible for the sale of LNG is registered in Bahamas, a tax haven (TNJ and Make Exxon Pay Coalition 2018). However, large PNG LNG tax payments in 2022 in response to high petroleum prices cast doubt on this argument. It is also possible that ACIL Tasman did not accurately model the tax regime.
Dividend payments from the PNG LNG project have also been much lower than the projected PGK1 billion per year. Here we must distinguish between profits flowing to Kumul Petroleum, and dividends paid by it to the budget. In late 2019, Kumul Petroleum revealed that since 2014 it had received PGK4.2 billion in profits from the project (Kumul Petroleum 2019), which corresponds to about PGK0.76 billion per year. Of this amount, it only paid about one-third (PGK1.3 billion) in dividends to government. Other claims on profits included payments on the Oil Search/UBS loan (9.1.4). PGK0.8 billion was retained by the company. Building up a national champion is not cheap, and will come at the expense of the budget, at least in the short and medium term.
By 2015, as the reality was sinking in that PNG LNG was not going to deliver to the budget in anything like the way anticipated, Finance Minister James Marape made front-page news with his declaration that ‘LNG is a myth’. But it was not just LNG. Revenue from all resource projects only exceeded PGK1 billion twice between 2015 and 2020.
One reason is that commodity prices fell, but PNG’s commodity price index declined only marginally, back to levels of the mid-noughties, when resource revenue was at record highs (Figures B12 and B25).
Ok Tedi had been the star contributor to government revenue in the noughties, but its annual corporate tax contribution, which had breached PGK1 billion in 2006, fell to less than PGK200 million during the bust, as its production fell. Oil production also continued its slow decline, which left, among the major projects, only Ramu Nickel, which had an extended tax holiday, and the two major gold mines—Lihir and Porgera—which have never paid significant amounts of corporate tax, even when gold prices have been at record highs, for reasons that have never been clear.
While project-specific factors seem to be the most important contributors to the resource revenue drought, one common cause is that the share of the take by the central government has fallen as that by provincial governments and landowners have increased (4.3.2). We should also recall that PNG sold off its equity share in most resource projects over the nineties (5.1.3), and through this period only had a share in two large projects: Ok Tedi (7.1.3) and PNG LNG (9.1.4).
All in all, while we lack a full explanation, we can point to a number of project-specific and sectoral factors that contributed to the collapse in resource revenue flowing to government over this period.
Low resource revenue was also one reason why the sovereign wealth fund (SWF), legislated for in 2015 (7.1.3), was not operationalised over the course of the period. According to that legislation, a portion of resource revenue, no matter how small, should have been saved, but, given the fiscal stress, that was simply ignored. In 2022, when resource revenue rebounded on account of high petroleum prices due to the Russia–Ukraine war, a token deposit was finally made into the SWF, but without any reference to the underlying legislation, which would have required a much more substantial downpayment (Ukama 2022; Leng and Howes 2022).
8.3.3 High deficits
Like the private sector (8.2.3), the government was also surprised by the downturn. Revenue in 2015 was only 79 per cent of the budget target, and only 83 per cent of budgeted expenditure could be financed that year. Indeed, throughout the period, the government found it difficult to set realistic revenue and expenditure targets.
There was no growth in revenue until 2022. Adjusting for inflation, government revenue in 2019 was 2 per cent above that in 2013. That was before the pandemic: real revenue fell in 2020 by a massive 16 per cent, and even in 2021 was 8 per cent below its 2019 level. In 2022, however, on the back of high oil and gas prices, resource revenue jumped from 1.1 to 3.9 per cent of GDP, causing real revenue to rise by 27 per cent in a single year.
We have already attempted to explain the precipitous decline in resource revenue experienced during the tens (8.3.2). Non-resource revenue also performed poorly (Figure B26), reflecting the depressed state of the economy. There was not much by way of tax reform, with little follow-up to the Tax Review Committee established in 2013 (Tax Review Committee 2015a, 2015b)—though it did recommend the resource sector tax reforms implemented during the period (9.1.4). In 2017, a five-year Medium Term Revenue Strategy was put in place that aimed to increase revenue by improving tax administration and compliance (Department of Treasury 2017a).
The Public Money Regularisation Money Act was passed in 2017 to force statutory authorities to remit funds in excess of requirements (set at 10 per cent unless an exception was granted) to the Treasury. However, the Act was ruled unconstitutional by the Supreme Court after it was challenged by the Ombudsman Commission (which wanted to protect its own fee income). A revised version was passed in 2022 exempting the judicial sector, but the extent to which it will be implemented remains unclear.
Given an absence of revenue growth during most of this period, and the fact that deficits were high going into it, there was no room for the government to grow expenditure. In 2019, real government expenditure was equal to its 2013 level (though recall that 2013 expenditure was a 26 per cent increase on 2012 levels) after inflation; this was a permanent increase. Expenditure was little changed (after inflation) in 2020 and 2021, with the decline in revenue due to the pandemic made up for by extra borrowing. But in 2022, with the influx of resource revenue due to the Ukraine war, expenditure growth resumed again, with a single-year real increase of 15 per cent at last taking total expenditure well above peak boom levels, another sign that the bust was over.
There were large deficits and therefore increasing debt during this period. The average deficit for this period was 5.2 per cent, three times or more greater than the average for any earlier period (Table 10.10).
With debt increasing from 25 per cent in 2013 to a peak of 53 per cent in 2021, it is hardly surprising that PNG’s credit ratings were adjusted down (Table 8.1). PNG received its first credit rating in 1998 and has, since then, received ratings in the highly speculative range of B1 to B2 (Moody’s) or B– to B+ (S&P). Higher (B1 and B+) ratings were received during the reform period of the late nineties (though with downgrades in the early 2000s, reflecting poor investor confidence) and during the boom. Lower grades (B2 and B–) came with the fiscal stress of the quiet bust. The IMF’s original assessment of PNG’s risk of debt distress was moderate-to-high in 2006. This was reduced to low by the end of the boom (2012 and 2013), but then increased to moderate in 2018 and high in 2020.
Table 8.1: PNG credit ratings, 1999–2022
|
Agency |
Rating |
Outlook |
Date |
|---|---|---|---|
|
Moody’s |
B2 |
stable |
10 November 2022 |
|
S&P |
B– |
stable |
24 May 2022 |
|
S&P |
B– |
negative |
3 June 2021 |
|
S&P |
B– |
negative watch |
30 April 2021 |
|
Moody’s |
B2 |
negative |
19 April 2021 |
|
IMF |
high |
1 June 2020 |
|
|
S&P |
B– |
stable |
29 April 2020 |
|
IMF |
moderate |
6 April 2020 |
|
|
Moody’s |
B2 |
stable |
15 February 2019 |
|
IMF |
moderate |
3 December 2018 |
|
|
S&P |
B |
stable |
16 April 2018 |
|
Moody’s |
B2 |
negative |
23 March 2018 |
|
IMF |
moderate |
17 November 2017 |
|
|
IMF |
low |
11 November 2016 |
|
|
Moody’s |
B2 |
stable |
25 April 2016 |
|
Moody’s |
B1 |
negative watch |
25 February 2016 |
|
IMF |
low |
18 November 2015 |
|
|
S&P |
B+ |
negative |
8 October 2015 |
|
Moody’s |
B1 |
negative |
18 May 2015 |
|
S&P |
B+ |
stable |
29 October 2015 |
|
IMF |
low |
10 November 2014 |
|
|
IMF |
low |
3 December 2013 |
|
|
IMF |
low |
30 April 2012 |
|
|
S&P |
B+ |
negative |
27 January 2012 |
|
IMF |
moderate |
3 May 2011 |
|
|
IMF |
moderate |
4 May 2010 * |
|
|
IMF |
moderate |
27 February 2009 |
|
|
IMF |
moderate |
18 January 2008 ** |
|
|
S&P |
B+ |
stable |
13 September 2007 |
|
IMF |
moderate |
21 March 2007 |
|
|
IMF |
moderate–high |
13 March 2006 |
|
|
S&P |
B |
stable |
6 December 2005 |
|
S&P |
B |
positive |
21 December 2004 |
|
S&P |
B |
stable |
21 December 2003 |
|
S&P |
B |
negative |
8 October 2002 |
|
S&P |
B |
stable |
6 August 2001 |
|
S&P |
B+ |
negative |
21 March 2001 |
|
S&P |
B+ |
stable |
29 June 2000 |
|
S&P |
B+ |
negative |
1 September 1999 |
|
S&P |
B+ |
negative watch |
26 July 1999 |
|
S&P |
B+ |
stable |
25 January 1999 |
|
Moody’s |
B1 |
stable |
31 December 1998 |
Notes: * IMF (2010); ** IMF (2008). In the range shown in the table, the ratings, in ascending order, for Moody’s are B3, B2, B1 and, for S&P, B -, B and B+. The risk of debt distress as assessed by the IMF is low, moderate or high.
Source: For S&P and Moody’s, see Trading Economics (n.d); for IMF, see IMF (n.d.).
In fact, PNG’s risk of default remained extremely low throughout. Even during the extreme stress of the nineties, there was no question that the government would meet its debt obligations. These ratings were more verdicts on the health of the PNG economy; and, with the bust having ended, debt can be expected to fall and credit ratings rise again.
The real puzzle is that, whereas in earlier periods deficits emerged from time to time but were quickly reduced (Duncan 2002), in this period they were persistently high. Why?
One answer is that attempts to limit deficits and the resultant increase in debt via legislation were unsuccessful. PNG’s Fiscal Responsibility Act (FRA), which was introduced in 2006 (6.3.1), was amended at the end of 2012 to replace the requirement that debt not be increased by a cap on debt to GDP of 35 per cent for 2013 and 2014, and 30 per cent thereafter. When debt reached 38 per cent at the end of 2013,4 the FRA was amended again to extend the higher cap by another year, 2015. PNG’s GDP was rebased upwards in 2016 (8.2), and this fortuitously made it much easier to hit the original debt target. With the debt/GDP ratio at 34 per cent of GDP in 2016 (49 per cent using the old GDP measure), the FRA was once again amended in 2017 to make a permanent cap of 30–35 per cent. This amendment also replaced the FRA’s balanced-budget requirement (which had not been met since 2010) by a ‘zero average annual non-resource primary fiscal balance’. In 2018 and 2019, debt/GDP increased again, reaching 40 per cent by the end of 2019. This required a further amendment, and in 2019, the upper bound on debt in the FRA was increased to 45 per cent. Finally, COVID-19 struck, borrowing was increased, and, in 2020, debt/GDP increased to 49 per cent and the debt limit to 60 per cent. Clearly, the legislative effort to limit debts and deficits did not work, as it was just too easy to amend the legislation whenever there was an actual or potential breach.
Another reason for the failure of fiscal adjustment over this period was the poor state of the economy. Given low growth, and the reluctance of the government to stimulate the economy via depreciation, spending was the only stimulatory tool the government could turn to.
Deficit reform efforts were also undermined by the continued narrative of success and the failure to admit that the boom had come to an end. This in turn allowed demands for salary increases to be met, even when there was no additional revenue to meet those demands (9.2.2). Serious policy efforts to bring down the deficit commenced only towards the end of the period. Under Treasurer Charles Abel, a new Medium Term Fiscal Strategy (Department of Treasury 2017b) was agreed to in 2017 for the period 2018 to 2022, and received backing from the World Bank. However, there was a salary blow out in 2018 (9.2.2), and debt went up relative to GDP rather than down as planned. Ian Ling-Stuckey was appointed in August 2019 not long after Marape became prime minister. He undertook a ‘due diligence’ exercise, with the assistance of the IMF, which found the underlying deficit to be significantly higher than reported due to a build-up of arrears. The 2019 deficit was projected to be 5.8 per cent of GDP. This then became the baseline from which deficit reduction would be measured in future years. However, this second adjustment program was blown off course the next year by the pandemic. Nearly all governments around the world responded to the pandemic by increasing deficits. PNG’s fiscal deficits for 2020 and 2021 were this highest it had ever run.
The most important reason, however, for the unusually high average deficits of this period was foreign exchange rationing (8.3.1). In the nineties, high deficits resulted in an actual or at least potential balance of payments crisis, something no politician wanted. The shift to non-convertibility of the kina in 2014 removed that threat. Politicians could run any level of deficit that they wanted; PNG’s central bank would ensure that the country would not run out of foreign exchange by rationing it as required. It was a vicious circle. High deficits encouraged the introduction and extension of rationing to prevent greater depreciation and a possible run on reserves, and once rationing had been introduced, it in turn encouraged the maintenance of high deficits.
How were these deficits financed? It was not easy. Recall that the previous period ended with a record reliance on domestic financing. Over this period, commercial banks continued to retain about 40 per cent of their assets in government debt. The government became increasingly reliant on superannuation funds. By the end of the period they too, like the commercial banks, had 40 per cent of their assets in government securities.
There was also a return to deficit financing by the central bank, despite this being outlawed by the Central Banking Act of 2000. Under the so-called ‘slack arrangement’, between 2014 and 2016 BPNG purchased those government securities that it was unable (as government debt manager) to sell to private buyers. BPNG holdings of government securities rose from PGK0.9 billion in 2013 to PGK3.6 billion in 2016, not as high as the levels seen in the nineties, but not far from it, once adjustments are made for inflation (Figure B35). While this seemed to have no adverse economic effects (no spike in inflation), it did call into question the bank’s independence, as well as its accountability, and was one of the issues dealt with by the BPNG reforms of 2021 (8.3.4).
In the later years of this period, the government turned to foreign borrowing. This was first done through a sovereign bond issue in September 2018 (USD500 million), PNG’s first foray into international commercial debt markets since the early years of independence. PNG also started, in 2018, to turn to official international lenders (8.3.5), and by 2022 the share of domestic to total government debt was 52 per cent, still high by historical standards but below the 77 per cent peak reached at the start of this period (Figure B29). This official borrowing carried much lower interest rates than either commercial foreign or domestic borrowing. Domestic interest rates on government borrowing also fell partly because there was less demand from government, and partly because the government seemed to take a tougher negotiating stance. PNG’s interest/GDP ratio, after rising from 1.1 per cent of GDP in 2013 to 2.6 per cent in 2019 fell to 2.5 per cent of GDP in 2021.
8.3.4 Central bank performance and reforms
In the Central Banking Act of 2000, BPNG was made more independent of political influence, told to focus only on controlling inflation, given control of the exchange rate and prohibited from engaging in deficit financing (5.1.3). BPNG certainly succeeded in keeping inflation moderate, with growth in the consumer price index averaging 4–5 per cent during both the boom and the quiet bust. In other respects it was less successful. The persistence of excess liquidity that first emerged at the end of the nineties (4.4.4) and worsened during the boom years (6.3.2) undermined the effectiveness of monetary policy. This meant that there was no stimulatory impact from BPNG’s reduction of both the cash reserve requirement and the Kina Facility Rate during the pandemic (Figures B34 and B36). While this itself can hardly be blamed on the central bank, its return to deficit financing (8.3.3) was in clear contravention of the Central Banking Act, and its introduction of foreign exchange rationing (8.3.1) was deeply damaging to growth.
BPNG was also slow to recognise the headwinds the PNG economy was facing. It was only in September 2019—after Peter O’Neill had been removed as prime minister, and the new prime minister had described the economy as ‘bleeding and struggling’ (Business Advantage PNG 2019)—that BPNG shifted its monetary stance from ‘neutral’ to ‘accommodating’. It might be argued that this did not matter if monetary policy was ineffective, but it did suggest that the central bank was unwilling to be an independent voice on the economy.
The concentration of power in one individual that the 2000 Central Banking Act provided for was highly unusual by international standards. Loi Bakani had become governor in 2009, and was still there in 2021, having become a very powerful figure in the meantime. In 2021, following a review (Igara, Kamit and Howes 2021), the government amended the Central Banking Act to move towards a more collegial model in which responsibility for monetary policy as well as financial regulation was shifted away from the governor to the board. The amendments also shortened the maximum term of governor from 14 to 8 years, which effectively meant that the incumbent was out of a job. The 2021 amendments also removed the deficit financing ban and returned to the pre-2000 arrangement of a cap on central bank holdings of government debt, on the basis that the earlier ban had proved unworkable and that what mattered about central bank purchases of government debt was not their existence but their volume. The amendments also broadened BPNG’s objectives to target growth as well as inflation (appropriately so, given its role in exchange rate setting), though in 2024 the IMF insisted that the Central Banking Act be further amended to once again give primacy to combatting inflation.
8.3.5 The re-emergence of budget support
Policy-based lending was a major theme of the nineties (5.1.4) and returned with the fiscal stress of this period. This time around, the loans were larger, but the conditions fewer and less onerous.
The Asian Development Bank was the first to move, providing USD100 million to the budget in return for health sector reforms in May 2018 (ADB 2018), and an additional USD159 million in 2021 (James 2020). Given the appalling performance of the health sector over this period—PNG’s immunisation rates plummeted to be the lowest in the world (Howes and Mambon 2021)—it is unclear what the justification for this loan was or what it achieved.
In September 2018, the World Bank (2018) provided USD150 million in return for fiscal reform. The basis for this was the 2018–22 Medium Term Fiscal Strategy and Medium Term Revenue Strategy. A second, follow-up operation of USD50 million was also planned, but was cancelled and the first loan rated a failure after PNG’s fiscal reform strategy went off track (8.3.3; World Bank 2020)
In November 2019, the Australian government provided a condition-free USD300 million loan to PNG through its export finance agency. By 2020, an IMF staff-monitored program (focused mainly on tax administration) was in place, and the Australian government was able to replace the export finance loan by the more conventional vehicle of a direct loan. (The International Monetary Agreements Act requires the Australian government, as against its export finance agency, to only lend to other governments in support of a multilateral program.) Australia provided another AUD140 million at the end of 2020 (Australian Treasury 2020). This was followed by a JPY30 billion, highly concessional loan from Japan in early 2021 (JICA 2021), and by another AUD650 million from Australia at the end of 2021 (Australian Treasury 2022), AUD750 million at the end of 2022 (Australian Treasury 2023), AUD600 million at the end of 2023 (Australian Treasury 2024) and AUD570 million at the end of 2024 (Australian Treasury 2025).
In November 2020, ADB provided the first in an envisaged three loans in support of SOE reform: USD100 million was disbursed in 2020, USD150 million in 2021 (ADB 2021) and USD250 million in 2022 (ADB 2022). These loans supported various legislative amendments—for example, to reduce political interference in the selection of SOE boards—and were made despite little progress on the ground in SOE performance (9.1.1)
The pandemic unlocked additional and largely condition-free foreign funding. The ADB released an additional USD250 million in 2020 (Xinhua 2020), the IMF approved USD364 million also in 2020 (IMF 2020) and the World Bank authorised USD100 million in 2021 (World Bank 2021a).
Finally, in March 2023, after three years on a trial staff-monitored program, the IMF signed off on a loan agreement with PNG worth USD918 million over three years. The agreement has three main aims: elimination of the fiscal deficit by 2027; the mopping up of all excess liquidity, a feature of the PNG economy since the 1990s, by the sale of a large volume of central bank bills; and, on the external account, a more flexible exchange rate and reduced foreign exchange shortages (IMF 2023).
The turn to the IMF, something O’Neill had ruled out, was certainly a significant development. It required the replacement of O’Neill by Marape and also new top management at BPNG, prepared to move away from the foreign exchange rationing regime. Some progress has been made, but whether the IMF-backed reforms will succeed remains to be seen. Normally, when the IMF gets involved, there is a crisis and reforms have to be made. In the complacency of the quiet bust, there was neither an appetite nor even a public narrative in favour of important but difficult reforms.
The IMF program can also be questioned on technical grounds. Mopping up excess liquidity by remunerating the marginal central bank deposit will crowd out private sector lending. The IMF requirement that that BPNG return to having only a mandate for controlling inflation when formulating its monetary and exchange rate policy (8.3.4) ignores the fact that it was this sole focus on inflation that led to rationing and overvaluation in the first place.
All of these foreign official loans offered a lower interest rate than anything PNG could secure commercially abroad or at home. The 2018 USD500 million sovereign bond had a repayment period of 10 years and an interest rate of 8.4 per cent (IMF and IDA 2020, 4). The official loans by contrast have either low or very low interest rates, and typically have extended grace and/or repayment periods. Australia’s 2020 AUD440 million loan was for 15 years, and, although interest rates have subsequently risen, at the time it was made, a 1.39 per cent interest rate (Australian Treasury 2020). Most of the official loans are also, for better or for worse, devoid of the onerous and controversial policy conditions of the nineties, staying away from contentious areas such as privatisation, with countries like Australia and Japan now providing budget support to PNG so that it does not turn to China. However, with international interest rates rising, and the somewhat more stringent conditionality of the IMF loan, the future of official foreign lending to PNG is unclear. Moreover, the more foreign borrowing PNG does, the more costly a devaluation becomes.
1 All data in this and the next paragraph are from the IMF Financial Access Survey.
2 As of November 2021, PGK1.1 billion was reported to be sitting in trust funds for the landowners once they are identified (Pacific Mining Watch 2021).
3 The Madang provincial government and a group of landowners sued the Ramu nickel mine in 2020 to stop the dumping of tailings at sea (Fox 2020). The environmental permit granted for the Wafi Golpu mine was stayed by the courts in September 2021 (National 2021).
4 Calculated using the ‘old’, smaller GDP figure: see the discussion in the text (8.2.1).
Previous Next



