


 menu
Struggle, Reform, Boom and Bust
10
Trends and patterns
What we thought should happen, has not happened … We wanted to see our people healthy, educated and properly fed, like citizens of any sovereign nation in the world. My vision for Papua New Guineans was that they should be able to stand on their own two feet, to do business, as well as other meaningful activities in life, so that they could lead decent lives. Lives that were better than those of their ancestors.
—Minister for Foreign Affairs Michael Somare (2000, 125–7)
New resource projects have been developed. The oil palm and fresh food industries have developed. Small service industries have flourished not just in towns but all over the country … There is growing Papua New Guinean ownership of business. A national entrepreneurial class is developing … But in some areas Papua New Guinea has not done as well as it should. We have not made the most of our resources and our wealth … We have not achieved sustained economic growth, the necessary basis for providing widespread, quality services to people, and for creating income-earning opportunities for our very large population of young people.
—Prime Minister Mekere Morauta (2000, 3)
10.1 Introduction
The economic history of PNG since independence is an important and absorbing story. The most recent histories were written before 2010 and are now out of date. The experience of another decade and a half adds new chapters to PNG’s economic history and provides new perspectives on earlier periods.
This final part of the book brings the preceding four together. This chapter compares the four periods across various dimensions of economic performance. The next two link economic outcomes to policies and to institutions, respectively.
An important contribution of the book is the division of PNG’s post-independence economic history into four parts, the eighties (1975–88), the nineties (1989–2003), the noughties (2004–13) and the tens (2014–22). The book so far has presented PNG’s economic history chronologically, one period after another. This chapter provides a more explicit comparison between, and overview of, the four periods and also tries, at least cursorily, to fill in some of the gaps that remain. It starts with population, economic growth and employment. It then goes to the changing structure of the economy, commodity prices and the government resource take, which are key to any understanding of PNG growth. Subsequent sections examine the resource sector, agriculture, trade and the balance of payments, the financial sector, the exchange rate and inflation, fiscal outcomes and service delivery. We conclude with a summary comparison of the four periods, and an overall, internationally informed assessment.
10.2 Population, economic growth and employment
The more than tripling of PNG’s population (Figure B1) is perhaps the biggest national change since independence. Data on PNG’s population are weak, and the last reliable census was undertaken in 2001 (Connell 1997, 168; Bourke and Allen 2021). Such data as there are suggest population growth is rapid (Table 10.1), about equal to the average for Sub-Saharan Africa in recent years. Some claim that the population is higher than the figures traditionally used (and relied upon in this book). A UN Population Fund study claimed, using satellite data, that PNG’s population was 17 million; the study’s estimate was subsequently reduced in 2023 to 11.8 million and adopted by PNG’s National Statistical Office (Kuku 2023b). It is possible that all early censuses were underestimates and/or that population growth has been higher than estimated over some or all of the post-independence period.
Table 10.1: Population over the four periods
|
Eighties |
Nineties |
Noughties |
Tens |
1975–2022 |
|
|---|---|---|---|---|---|
|
Population (first and last year) (millions) |
2.8, 3.8 |
3.9, 5.6 |
5.8, 7.3 |
7.5, 9.3 |
|
|
Average population growth |
2.4% |
2.7% |
2.7% |
2.7% |
2.6% |
Note: The periods are defined as the eighties (1975–88), the nineties (1989–2003), the noughties (2004–13) and the tens (2014–22).
Source: PNG Economic Database.
In 1991, PNG launched a population policy. It aimed to increase contraceptive prevalence to 63 per cent by 2020. The 2016–18 Demographic and Health Survey revealed that just over one-third of married women aged 15–49 used contraceptives, despite the fact that nearly half said they wanted no more children. On average, in that survey, married women said they wanted three children, and married men 3.6, both well below the fertility rate of 4.4 (Pandey and Howes 2022). Only a few leaders have supported the idea that the fertility rate is a problem (e.g. Samana 1988). Although there have been two more population policies after the first, backing for family planning has never been strong (Connell 1997, 172–5). The still popular Vision 2050 (National Strategic Plan Taskforce 2009) said that PNG’s high population growth rate was acceptable and made no mention of the need to expand the use of contraception.
PNG is an extremely rural country. Official figures (World Bank Group n.d.-a) show that about 14 per cent of the population lives in urban areas, a share virtually unchanged from independence and the lowest of all countries in the world.
The number of non-citizen residents fell sharply from independence levels, with censuses recording 50,500 non-citizens in 1971, 32,760 in 1980 and 20,882 in 2011 (Nelson 2007b; NSO 2015).1 The number has certainly risen more recently, with worker arrivals increasing (8.2.3) and an estimated 20,000 Chinese alone now resident in PNG (9.2.6).
GDP and non-resource GDP growth are close in the first two periods, and almost identical for the post-independence era as a whole, at 3 and 3.1 per cent, respectively (though not for exactly the same period, as non-resource GDP growth is only available from 1983). In the boom, non-resource GDP growth was, on average, 1 percentage point higher than GDP growth as rising commodity prices and PNG LNG construction stimulated output in the non-resource sector. During the quiet bust, non-resource GDP growth was only half of GDP growth, as, while PNG LNG exports boomed, resource revenue to government declined.
Table 10.2: Growth and employment—period averages
|
|
Eighties |
Nineties |
Noughties |
Tens |
1976*–2022 |
|---|---|---|---|---|---|
|
GDP growth |
1.5% |
2.9% |
4.5% |
3.8% |
3.0% |
|
GDP growth volatility |
2.5% |
6.8% |
3.2% |
4.9% |
4.9% |
|
Non-resource GDP growth |
1.3% |
2.7% |
5.6% |
2.0% |
3.1% |
|
GDP per person growth |
–1.0% |
0.2% |
1.7% |
1.1% |
0.4% |
|
Non-resource GDP per person growth |
–1.0% |
0.0% |
2.8% |
–0.7% |
0.4% |
|
Employment growth |
2.1% |
0.6% |
5.0% |
–1.3% |
1.5% |
Notes: *GDP begins in 1976, employment in 1978 and non-resource GDP in 1983. Employment is only in the formal sector and excludes the public service. All these GDP growth rates are real (using the appropriate deflator). Volatility is measured by the standard deviation.
Source: PNG Economic Database.
Given the capital-intensive and enclave nature of the largely foreign-owned resource sector, non-resource GDP per person is our preferred measure of national economic activity and the closest thing we have in the book to a measure of average living standards. Growth in it was negative or zero in all periods except the boom, when it grew at an average of 2.8 per cent. The annual average growth for this variable for the post-independence period as a whole is just 0.4 per cent per year.
Formal sector employment (Figure B16) is another proxy for living standards. It it is also less than population growth, except in the third, boom period. The share of foreign workers in the total workforce is growing (8.2.3), and, if we take that into account, growth in the employment of nationals must be even slower.
Data on private sector wages are only available for the eighties, where there was a slight decline in average wages controlling for inflation (McGavin 1993, Table 3.6), and for this century (Blunch and Davies 2024). With wage deregulation and high inflation, real wages must have fallen sharply over the nineties. Adjusting for inflation, and depending on the estimation method used, private sector wages fell rapidly by an average of 7.6–8.6 per cent a year between 1999 and 2002, then grew rapidly during the boom years (7.9–8.4 per cent between 2003 and 2013), but then fell by 0.6–0.8 per cent a year on average from 2014 to 2018, the most recent year for which data are available (Blunch and Davies 2024).
Government salaries were protected in the eighties by indexation (McGavin 1993, Table 3.7), fell sharply in the nineties and then increased this century. Comparisons of average government salaries in the eighties and in the tens suggest very little change. McGavin reports an average government salary of PGK54,000 (converted into 2022 prices) for 1991 (McGavin 1993, Table 3.7), and more recent data give an average of PGK56,700 for 2019.2
Of course, these are imperfect measures, and we say more about the non-income dimensions of living standards later in this chapter (10.11) and about income inequality in the next (11.8). But, as per the Morauta quote with which this chapter began, only sustained economic growth can provide ‘the material basis for achieving high levels of the basics of human wellbeing’ (Pritchett 2022).
10.3 The structure of the economy
The growing importance of the resource sector relative to the rest of the economy (increasing resource dependency) is one of the biggest changes in PNG since independence (Figure B3). The average share of the resource sector in nominal GDP has increased in every period, from 10 per cent in the first, to 26 per cent in the last (Table 10.3). The agriculture, forestry and fishing sector makes up about a quarter of non-resource GDP (Figure B4). Manufacturing represents a small and declining share. Construction is the most rapidly growing sector, with growth during the boom doubling its share of non-resource GDP, which has stayed high since. Wholesale and retail trade, and transport have both become less important.
Table 10.3: The structure of the economy—period averages
|
Eighties |
Nineties |
Noughties |
Tens |
1980*–2022 |
||||||
|---|---|---|---|---|---|---|---|---|---|---|
|
Growth |
Share |
Growth |
Share |
Growth |
Share |
Growth |
Share |
Growth |
Share |
|
|
Resource sector |
10.4% |
3.5% |
16.8% |
–0.6% |
20.3% |
11.8% |
25.9% |
5.1% |
18.2% |
|
|
Non-resource sectors (as share of non-resource GDP) |
||||||||||
|
Agriculture, forestry and fishing |
1.6% |
22.8% |
2.9% |
24.4% |
3.3% |
25.4% |
2.1% |
23.9% |
2.6% |
24.2% |
|
Manufacturing |
1.6% |
4.4% |
1.2% |
4.0% |
4.3% |
3.1% |
–0.5% |
2.4% |
1.6% |
3.5% |
|
Utilities |
3.1% |
0.7% |
2.8% |
0.9% |
5.3% |
1.3% |
3.2% |
1.4% |
3.9% |
1.0% |
|
Construction |
–3.2% |
3.0% |
7.9% |
4.3% |
10.2% |
9.0% |
–0.9% |
9.1% |
4.9% |
6.1% |
|
Wholesale and retail |
5.0% |
19.0% |
0.5% |
17.5% |
4.2% |
14.6% |
1.5% |
12.9% |
2.3% |
16.2% |
|
Transport |
6.3% |
6.7% |
–1.0% |
6.8% |
6.3% |
3.4% |
–0.6% |
2.9% |
1.8% |
5.2% |
Notes: *Shares start in 1980, and growth rates in 1983. Growth is adjusted for inflation using the appropriate deflator. First period resource sector growth is excluded as it is only from 1983 to 1988, from just before the opening of Ok Tedi to just before the closing of Panguna. It shows annual average growth of 10.1 per cent which is unrealistically high for the entire 1975–88 period.
Source: PNG Economic Database.
10.4 Commodity prices and exports
PNG is a commodity exporter, and its commodity exports have increased significantly since independence (Figure B5), from an average of 23 per cent of GDP in the first period to 32 per cent in the second to around 40 per cent in the third and fourth (Table 10.4). Moreover, PNG is increasingly a resource exporter, with the average share of resources in total commodity exports (Figure B6) increasing from 56 per cent in the first period to 84 per cent in the last. Fluctuations and trends in global commodity, and especially resource, prices are therefore fundamental to PNG’s economic performance.
Table 10.4: Commodity prices and exports—period averages
|
|
Eighties |
Nineties |
Noughties |
Tens |
1976*–2022 |
|---|---|---|---|---|---|
|
Commodity exports/GDP |
22.9% |
32.1% |
39.5% |
39.3% |
32.5% |
|
Share of resources in commodity exports |
56.0% |
72.1% |
78.0% |
83.9% |
73.2% |
|
Export price indices (2012 = 1) |
|||||
|
All commodities index |
|||||
|
Average |
0.70 |
0.42 |
0.87 |
0.90 |
0.68 |
|
Growth |
–2.5% |
–1.4% |
8.1% |
2.2% |
1.2% |
|
Resource index |
|||||
|
Average |
0.40 |
0.34 |
0.87 |
0.91 |
0.58 |
|
Growth |
1.2% |
–0.1% |
9.8% |
2.3% |
2.3% |
|
Non-resource index |
|||||
|
Average |
1.76 |
0.78 |
0.86 |
0.85 |
1.08 |
|
Growth |
–5.6% |
–3.4% |
2.6% |
1.0% |
–1.2% |
|
Government resource take (ratio of government resource revenue to resource GDP) |
16.6% |
14.5% |
22.9% |
5.9% |
15.1% |
Note: *Government resource take starts in 1980.
Source: Index constructed by authors using price data from the World Bank and commodity data from PNG Economic Database (see Figure B12 for details).
Table 10.4 also summarises trends in our PNG commodity export price index (Figure B12). Resource and agricultural price indices have behaved differently. The non-resource commodity price index fell over the first two periods before only partially recovering in the third. This was especially damaging to growth in the first period when agricultural exports were almost as important as resource ones. The resource index was broadly flat in the first two periods, before rising sharply in the third, and, on average, even higher in the fourth, despite the dip in resource prices at the end of the boom. The all commodity price index fell from the eighties to the nineties but reached new highs in the noughties and tens.
The fact that commodity prices were falling over the first two periods helps explain their low growth. And the main reason for the acceleration of economic growth at the start of the third period is that commodity (specifically, resource) prices rose to a new high. Commodity price trends provide a less convincing explanation for the growth slowdown in the fourth period because the commodity price index stayed high; indeed, on average, it was higher in the fourth period than the third.
High resource prices are a necessary but not sufficient condition for economic growth in PNG. Prices have to be high in relation to resource projects that, if they yield high profits, yield high government revenue. We call these ‘revenue-ready’ projects (6.2.1). A variable that captures this is also shown in Table 10.4 (and Figure B26), namely the government resource take or the ratio of government resource revenue to resource GDP (Davies and Schrӧder 2022). This is about 50 per cent higher during the boom than in the earlier two periods. Although commodity prices stayed high in the fourth period, the government resource take plummeted in this period—down to 5.9 per cent, less than half of the post-independence average of 15.1 per cent—ending the boom and helping to explain the bust that followed.
10.5 The resource sector
Growth in the resource sector can be measured in different ways. We have already seen that, in real terms, the sector has grown at an annual average rate of 5.1 per cent since independence (Table 10.3). The information content of this estimate is limited, however, by the huge changes in composition of the resource bundle (Figures B10 and B11), and by its non-consideration of changing prices (Figure B14). As Table 10.5 shows, gold and copper were of roughly equal importance in the first period. Ok Tedi and Panguna produced both. In the nineties, gold production almost tripled as first Porgera and then Lihir came on line, whereas copper production stabilised as, although Ok Tedi expanded, Panguna was closed. Oil production started and peaked in the nineties, accounting for 30 per cent of resource exports in that period. Oil production halved in the noughties and halved again in the tens. Nickel and cobalt mining started in 2013–14 as did, more importantly, LNG production, which is now half of total resource exports. Gold is another third, and the remaining one-sixth is divided up between copper, nickel and cobalt, and oil.
Another way to measure growth in the resource sector is to value it in terms of domestic currency, adjusted for inflation (Figure B15). This is also shown in Table 10.5, which reveals that, adjusted for inflation, resource exports grew sixfold between the first and last period, again corresponding to an annual average growth rate of about 5 per cent. The real value of copper exports is about the same as at independence, but gold exports have almost increased fourfold, and petroleum exports, which were absent at independence, are now worth more than three times the value of all first period resource exports.
Table 10.5: Resource exports—period averages
|
Eighties |
Nineties |
Noughties |
Tens |
1976*–2022 |
|||||||||||
|---|---|---|---|---|---|---|---|---|---|---|---|---|---|---|---|
|
Volume |
Share |
Value |
Volume |
Share |
Value |
Volume |
Share |
Value |
Volume |
Share |
Value |
Volume |
Share |
Value |
|
|
Gold |
24 |
53% |
2,851 |
56 |
46% |
5,245 |
59 |
47% |
8,842 |
61 |
33% |
9,466 |
48 |
46% |
6,228 |
|
Copper |
179 |
47% |
2,207 |
171 |
24% |
2,541 |
167 |
28% |
5,648 |
84 |
7% |
2,067 |
159 |
29% |
3,036 |
|
Nickel and cobalt |
- |
- |
- |
- |
- |
- |
2 |
1% |
88 |
31 |
6% |
2,139 |
5 |
1% |
438 |
|
Crude oil |
- |
- |
- |
22,674 |
30% |
3,810 |
11,293 |
25% |
4,786 |
6,366 |
5% |
1,627 |
11,058 |
16% |
2,601 |
|
LNG/condensate |
- |
- |
- |
- |
- |
- |
- |
- |
- |
9,598 |
48% |
15,467 |
1,493 |
7% |
3,026 |
|
All resources |
|
100% |
5,060 |
|
100% |
11,595 |
|
100% |
19,364 |
|
100% |
30,766 |
|
100% |
15,330 |
Notes: *Shares and values start in 1977. Silver and alluvial gold are excluded as they are not available for all years. Volumes are in tonnes for gold, thousands of tonnes for copper, nickel and cobalt and thousands of barrels for oil and LNG/condensate. Values are measured in kina million in 2022 prices. Shares are measured by value.
Source: PNG Economic Database.
10.6 Agriculture
Growth in the value of agricultural commodity exports has been much slower than of resource exports (Figure B15 and Table 10.6).
Overall, production of traditional cash crops, other than palm oil, has stagnated or fallen (Figure B7). The production of copra, copra oil, rubber and tea has declined since independence, while that of coffee and cocoa has stagnated (Table 10.6). One reason traditional cash crops have not done well is that their purchasing power has fallen. Adjusting for inflation, in the last period, coffee and cocoa prices were less than one-half of their value in the first period (Figure B13). Nevertheless, these crops remain very important to PNG households. According to the 2016–18 Demographic and Household Survey, some 25 per cent of households grow coffee, 20 per cent cocoa and 16 per cent copra.
Palm oil, log exports and fish production have all grown rapidly (Figure B8), and between them now make up two-thirds of PNG’s non-resource commodity exports (Figure B9). Non-traditional cash crops (‘other agricultural products’, such as vanilla) have also done well and make up another 10 per cent.
These bright spots have to be distinguished between. Despite rapid growth, log exports cannot be considered a success with only modest revenue for government and few local benefits. In the words of a World Bank (2004, 23) report:
Logging has … little long term beneficial impact on landowners, although they bear the environmental costs. Personal income is directed to immediate consumption, and community income tends to be squandered by so-called landowner companies who purport to represent the landowners. Whilst new large scale sustainable logging projects may offer the opportunity for landowners to receive a sustainable income, the level of income under current arrangements is generally too small to impact significantly on rural living standards. It is evident that in general landowners are not able to manage their affairs in the democratic way they are expected to with regard to their organization, and the management of cash flows from logging projects for long term benefits.
Table 10.6 assesses the aggregate success of non-resource commodity exports over time by measuring their kina value, adjusted for inflation. The fourth period average is 1.5 times the first period average, compared to six times for resource exports (Table 10.5).
Table 10.6: Non-resource commodity exports—period averages
|
Eighties |
Nineties |
Noughties |
Tens |
1976*–2022 |
|||||||||||
|---|---|---|---|---|---|---|---|---|---|---|---|---|---|---|---|
|
Volume |
Share |
Value |
Volume |
Share |
Value |
Volume |
Share |
Value |
Volume |
Share |
Value |
Volume |
Share |
Value |
|
|
Cocoa |
30,362 |
18% |
72 |
34,980 |
8% |
34 |
44,450 |
10% |
521 |
33,978 |
6% |
326 |
35,402 |
11% |
480 |
|
Copra |
90,292 |
8% |
334 |
53,673 |
3% |
128 |
22,560 |
1% |
47 |
41,301 |
2% |
91 |
55,940 |
4% |
157 |
|
Copra oil |
35,273 |
6% |
227 |
38,700 |
4% |
181 |
42,580 |
4% |
206 |
15,676 |
1% |
67 |
34,761 |
4% |
176 |
|
Coffee |
48,015 |
41% |
1,544 |
64,053 |
24% |
1,092 |
60,460 |
17% |
923 |
46,987 |
10% |
590 |
56,368 |
25% |
1,075 |
|
Rubber |
4,015 |
1% |
40 |
3,440 |
1% |
22 |
4,470 |
1% |
51 |
3,056 |
0% |
15 |
3,791 |
1% |
32 |
|
Tea |
6,500 |
3% |
116 |
6,153 |
1% |
55 |
5,500 |
1% |
36 |
771 |
0% |
4 |
5,294 |
1% |
57 |
|
Cash crops (excl. palm oil) |
214,458 |
77% |
2,985 |
201,000 |
41% |
1,828 |
180,020 |
32% |
1,785 |
141,769 |
19% |
1,093 |
191,557 |
46% |
1,977 |
|
Palm oil |
63,146 |
8% |
321 |
238,173 |
17% |
795 |
431,750 |
28% |
1,532 |
582,368 |
28% |
1,690 |
280,418 |
18% |
1,007 |
|
Other agricultural products |
0% |
- |
6% |
255 |
10% |
543 |
10% |
593 |
6% |
317 |
|||||
|
Marine products |
- |
0% |
- |
6 |
3% |
116 |
52 |
9% |
460 |
154 |
20% |
1,215 |
39 |
6% |
376 |
|
Logs/timber |
908 |
15% |
563 |
1,788 |
33% |
1,544 |
2,732 |
22% |
1,165 |
3,449 |
23% |
1,303 |
2,025 |
24% |
1,158 |
|
Total |
100% |
3,869 |
100% |
4,538 |
100% |
5,485 |
100% |
5,893 |
100% |
4,835 |
|||||
Notes: *Shares and values start in 1977; marine products start in 1990. Shares are measured by their value, and, in the case of timber, include other forest products (whereas only the volume of logs is recorded). Volumes are in tonnes except for logs, which are in thousand cubic metres. Values are measured in kina million in 2022 prices, adjusting nominal values by the CPI.
Source: PNG Economic Database.
There is a lack of data on food crops and buai, but no doubt their sale is very important and has grown (Bourke 2005b). The 2011 Census found that 66 per cent of rural households engage in the sale of food crops and cooked food, and that a stunning 44 per cent grow betel nut, up from only 8 per cent in 1990 (NSO 2015, 75). With more fresh food for sale, food markets have developed. Sharp (2019) notes several big changes: the rise of resellers (intermediaries) and of large-scale trading, more long-distance trading, more haggling and competitive behaviour, growth in the number of smaller (‘corner’) marketplaces, an increase in supply from commercial farming and the increased sale of store goods in fresh food markets.
Even less is known about subsistence agriculture, though research has repeatedly shown that those households exclusively reliant on subsistence are the worst off (Harvey and Heywood 1983), as cash crops allow households to improve the quality of their diet (Schmidt, Mueller and Rosenbach 2020). Around the time of independence, the theory of subsistence affluence held that rural households had enough to eat, giving rise to the idea that there was no poverty in PNG (2.2.4). However, more recent survey data indicate that both food poverty (Gibson 2014; Schmidt 2019) and hunger (Pandey and Howes 2021) are widespread phenomena in PNG. This remains a controversial claim (Bourke 2021), but internationally comparable data rank PNG the 15th most food insecure country in the world (Table 10.14). Whether or not quantities are sufficient, it has long been recognised that the quality of diets in PNG is low, with insufficient intake of protein and micronutrients (Heywood and Heywood 1990). Alarmingly, almost one in two children in PNG are stunted; this is the fourth-highest rate in the world (Hurney 2017).
ANU geographer Bryant Allen has been visiting the same villages, Tumam and Ngahmbole, near the town of Dreikikir in the province of East Sepik since 1971. After a 2016 visit, he wrote of these villages:
Economically, they are stuck and seem likely to be stuck, for as long as can be foreseen. With the exception of very short-term boom prices for vanilla, the number of cocoa trees or vanilla vines that can be managed by individual families will never provide them with cash incomes that will allow them to build permanent houses, with electricity and running water. They will have to continue to grow most of their own food. They will not be able to afford to buy fertilisers … Reliable family planning is not available from the health centre, despite an expressed desire by men and women to reduce family sizes. There is never likely to be a local source of paid employment at Dreikikir that will enable most people to live in their villages but earn a cash income ‘off the farm’. (Allen 2018, 115)
10.7 Trade and the balance of payments
Exports grew relative to the economy over the nineties and noughties, before falling over the tens due to lower resource prices and then picking up again as resource prices recovered (Table 10.7 and Figure B19). Imports grew over the first three periods, but collapsed in the fourth, where, as a share of GDP, they have fallen to three-quarters of the average for the post-independence period (Figure B19). The fourth period also stands out for its massive current account surplus, reflecting high exports being used to fund large capital repayments, especially related to the PNG LNG project, rather than imports. (Capital flows beyond those relating to foreign direct investment have always been limited in PNG. Superannuation funds are allowed to invest a portion of their funds offshore. The PNG stock market is illiquid, and only domestic financial institutions participate in the government bond market.)
Foreign exchange rationing, one of the causes of import compression, was used to protect foreign exchange reserves during the downturn of the fourth period (8.3.1). Foreign exchange reserves fell relative to imports from 4.5 months in 1976 to 2.3 in 1988 (Table 10.7), and were further run down in the second period leading to crisis (Figure B22). They recovered during the boom and were protected during the bust by rationing.
Table 10.7: Exports, imports, the current account balance (CAB) and foreign exchange (FX) reserves—period averages
|
Eighties |
Nineties |
Noughties |
Tens |
1976–2022 |
|
|---|---|---|---|---|---|
|
Exports/GDP |
28.5% |
38.1% |
44.4% |
41.6% |
37.5% |
|
Imports/GDP |
37.2% |
37.4% |
47.5% |
28.3% |
37.8% |
|
CAB/GDP (average) |
–4.8% |
2.4% |
–1.2% |
13.6% |
1.8% |
|
FX/imports (months) |
4.0 |
1.8 |
4.4 |
4.2 |
3.4 |
|
FX/imports (months) (first, last) |
4.5, 2.3 |
2.4, 2.3 |
2.6, 3.7 |
4.6, 4.6 |
Source: PNG Economic Database.
10.8 The financial sector
Commercial bank deposits have increased relative to the economy (Figure B32), with the peak (an average of 32 per cent of GDP) coming during the boom years of the noughties (Table 10.8). Private lending has been more constant at around 12 per cent of GDP. However, the period averages hide the volatility, with a collapse in private lending during the nineties (from 19 per cent in 1989 to 7 per cent in 2003), recovery during the boom (to a high of 17 per cent in 2013) and then another decline. Bank holdings of government debt have increased, but not enough to fully utilise available deposits. This has led to a situation of excess liquidity, which first became evident in the late nineties (Table 10.8 and Figure B36). In the final period, the banks parked more than one-fifth of their deposits at the central bank.
Table 10.8: The financial sector—period averages
|
Eighties |
Nineties |
Noughties |
Tens |
1977*–2022 |
|
|---|---|---|---|---|---|
|
Deposits/GDP |
17.1% |
20.2% |
31.5% |
29.1% |
23.6% |
|
Deposits/GDP (first, last) |
17.6%, 17.8% |
19.9%, 14.7% |
17.1%, 38.7% |
33.1%, 27.8% |
|
|
Private lending/GDP |
12.6% |
12.8% |
12.2% |
12.4% |
12.5% |
|
Private lending/GDP (first, last) |
6.8%, 16.2% |
18.5%, 6.5% |
6.0%, 17.1% |
14.7%, 11.4% |
|
|
Government lending/GDP |
2.6% |
6.2% |
8.4% |
11.2% |
6.7% |
|
Share of comm. bank deposits at BPNG |
5.0% |
6.0% |
13.4% |
22.1% |
12.3% |
|
Interest rate spread |
2.68 |
7.34 |
9.23 |
7.90 |
6.66 |
|
Number of bank branches |
52 |
53 |
69 |
82 |
62 |
|
Number of bank agents (first, last) |
298, 286 |
264, 87 |
87, 337 |
393, 589 |
Notes: *The interest rate spread (the difference between the average lending and average deposit rate) and the number of bank branches and agents start in 1976. Data on agents missing for most of the noughties, so first and last year shown rather than average.
Source: PNG Economic Database.
The stability of the financial sector was threatened by political interference in the nineties. Tackling this was the signature success of the Morauta reforms. PNG’s financial sector today is stable, but not supportive of economic growth. PNG’s central bank governor noted at the start of the eighties that PNG’s interest rates (on loans) were ‘relatively low by international standards’ (ToRobert 1982, 150). Today, they are, by the same standards, very high. Following deregulation of the banks in the eighties, deposit rates fell but lending rates stayed high, leading to interest rate spreads more than doubling (Table 10.8), and PNG’s banks becoming among the most profitable in the world, which reflects the lack of competition in the sector.
Financial inclusion went backwards in the nineties with little growth in the number of bank branches, and a reduction in the number of bank agents, but has improved this century (8.2.2).
10.9 The exchange rate and inflation
Inflation has been moderate in PNG except in the second period during which it equalled almost 10 per cent, reflecting pass-through from the rapid depreciation (Table 10.9).
The kina was largely stable in the first period, depreciated precipitously in the second, recovered some of its value in the third and then lost that value in the fourth (Figure B31).
Table 10.9: The exchange rate and inflation—period averages
|
Eighties |
Nineties |
Noughties |
Tens |
1975*–2022 |
|
|---|---|---|---|---|---|
|
USD/PGK (first and last) |
1.26, 1.21 |
1.16, 0.28 |
0.31, 0.45 |
0.41, 0.28 |
|
|
Nominal appreciation (against USD) |
–0.3% |
–9.3% |
4.9% |
–5.1% |
–3.4% |
|
Nominal appreciation (NEER) |
0.4% |
–4.9% |
2.3% |
–2.4% |
–1.6% |
|
Real appreciation (REER) |
–1.7% |
–2.1% |
4.1% |
0.3% |
0.0% |
|
REER (first and last) |
133.2, 116.6 |
119.8, 85.1 |
87.9, 127 |
122.8, 130.8 |
|
|
Inflation |
6.4% |
9.6% |
4.4% |
5.1% |
6.8% |
|
Relative inflation |
–2.1% |
2.8% |
1.8% |
2.8% |
1.6% |
Notes: *The REER (real effective exchange rate) starts in 1980 and the NEER (nominal effective exchange rate) in 1979. Both are indices with 2010 = 100. Inflation is measured from 1978. Relative inflation is REER–NEER.
Source: PNG Economic Database.
The real effective exchange rate (REER), which takes account both of movement in nominal exchange rates and differences between domestic and international inflation rates,3 shows gradual depreciation in the first period, more rapid depreciation in the second, but then an appreciation back to the level of independence during the third period and no change in the fourth period (Table 10.9). The REER in 2022 is remarkably close to the REER in 1980 (the first year for which data are available).
10.10 Fiscal outcomes
Revenue has been falling relative to GDP, except during the boom, where it was pushed up by a massive surge in resource revenue. It was 20 per cent on average during the first period and only 17 per cent in the last (Table 10.10), which reflects the sharp fall in foreign aid relative to GDP (Figure B25). The non-resource sector has become more heavily taxed over time (Figure B26), and, for the post-independence period as a whole, the government non-resource take (non-resource revenue relative to non-resource GDP) is slightly higher than the resource revenue rate (resource revenue relative to resource GDP) (Table 10.10).
Table 10.10: Government revenue, expenditure and borrowing—period averages
|
Eighties |
Nineties |
Noughties |
Tens |
1976*–2022 |
|
|---|---|---|---|---|---|
|
Revenue/GDP |
20.2% |
19.3% |
22.3% |
17.0% |
19.7% |
|
Revenue growth |
1.3% |
0.4% |
7.2% |
0.5% |
2.1% |
|
Non-resource own revenue/GDP |
12.0% |
13.5% |
14.2% |
13.6% |
13.2% |
|
Resource revenue/GDP |
1.7% |
2.4% |
4.9% |
1.5% |
2.5% |
|
Aid/GDP |
6.5% |
3.4% |
3.2% |
1.9% |
3.9% |
|
Aid/revenue |
32.3% |
17.5% |
14.2% |
11.3% |
19.7% |
|
Aid growth |
–5.3% |
–0.4% |
–2.5% |
1.4% |
–1.7% |
|
A. Government non-resource take |
14.1% |
16.2% |
17.7% |
18.1% |
16.5% |
|
B. Government resource take |
16.6% |
14.5% |
22.9% |
5.9% |
15.1% |
|
B/A |
1.18 |
0.89 |
1.29 |
0.33 |
0.91 |
|
Expenditure /GDP |
21.9% |
21.0% |
22.1% |
22.0% |
21.7% |
|
Expenditure growth |
1.1% |
0.4% |
9.7% |
0.6% |
2.6% |
|
Deficit/GDP |
1.7% |
1.7% |
–0.1% |
5.2% |
2.0% |
|
Interest/GDP |
1.7% |
2.6% |
1.2% |
2.2% |
2.0% |
|
Debt (first, last) |
|||||
|
% GDP |
17.3%, 24.1% |
26.3%, 38.6% |
37.3%, 24.9% |
26.9%, 48.2% |
|
|
% domestic share of debt |
25.2%, 20.6% |
26.3%, 31.6% |
39.1%, 72.1% |
74.5%, 52.4% |
|
Notes: *Revenue and expenditure growth are adjusted for inflation and start in 1977. The government resource take is the ratio of resource revenue to resource GDP. The government non-resource take is the ratio of non-resource own revenue (excluding aid) to non-resource GDP.
Source: PNG Economic Database.
PNG ran modest fiscal deficits in the first two periods, surpluses in the third, and its largest deficits in the fourth (Figure B27). Deficits stayed large in the fourth period because foreign exchange rationing removed the risk that a high fiscal deficit would lead to a balance of payments crisis (8.3.1). Debt and interest payments have generally increased relative to GDP and revenue, though they fell during the boom (Figure B28). Government debt has been increasingly domestically financed, though there was a return to foreign funding of government debt in the last period (Figure B29).
Government expenditure, although it has bounced around year-to-year (Figure B23), has been remarkably constant over the four periods, with period averages restricted to the range of 21–22 per cent of GDP.
10.11 Service delivery
Public services have to be financed either by revenue or by borrowing, and their cost increases with the size of the population. Since government borrowing is limited, revenue per person, adjusted for inflation, is one measure of the capacity of the state to deliver public services. Despite a recovery in the third period, revenue per person has fallen significantly since independence (Figure B38 and Table 10.11). The fourth period revenue per person average is 80 per cent of the first period average.
Another measure is government recurrent goods and services per person. This removes salaries, interest and development spending from total expenditure, and focuses on the residual, which is the non-salary recurrent costs of running government. It includes expenditures on such items as drugs for hospitals, textbooks for schools and road maintenance. It is a particularly useful measure for PNG because it is net of salaries: real salaries fell over the nineties, but we do not know how much by. Data on this variable, shown in Figure 5.1, are not available for the first period. It collapsed over the nineties from PGK 1,208 in 1989 (2022 prices) to PGK367 in 2003, which is consistent with observations regarding a sharp decline in service delivery over that decade (5.2.2). Goods and services per person spending recovered during the boom to PGK1,074 (in 2013), but then collapsed again during the bust to PGK693 (in 2022).
These are all financial input measures. Long time series on non-financial inputs are limited, but one that is available is the number of medical doctors. This shows a fairly constant and very low ratio of doctors to patients. Another output variable for which a long time series is available is childhood immunisation (Figure B39). This shows improving levels in the first three periods followed by a rapid decline in the fourth.
Table 10.11: Service delivery indicators post-independence—period averages
|
Eighties |
Nineties |
Noughties |
Tens |
1975*–2022* |
|
|---|---|---|---|---|---|
|
Revenue per person |
2,350 |
2,057 |
2,168 |
1,866 |
2,120 |
|
Goods and services per person (first and last) |
1,208, 367 |
484, 1,074 |
1,018, 693 |
||
|
Doctors per million |
70 |
64 |
50 |
63 |
63 |
|
Immunisation rates (%) |
|||||
|
DPT |
36.7 |
59.5 |
62.0 |
40.4 |
51.5 |
|
Hepb3 |
|
38.0 |
65.7 |
41.4 |
47.5 |
|
Measles |
30.3 |
56.8 |
71.6 |
45.6 |
54.2 |
Notes: *Revenue per person is measured in 2022 kina and starts in 1977; goods and services per person are recurrent only, are measured in 2022 kina and start in 1989; data on doctors are up to 2021; the DPT (diphtheria, pertussis, tetanus) immunisation rate starts in 1980, measles in 1983 and Hepb3 in 1990. The immunisation rates are the percentage of children aged 12–23 months who have been vaccinated. See also the notes to Figure B39.
Source: PNG Economic Database.
More generally, although life expectancy in PNG has continued to improve and infant mortality has continued to decline over the post-independence period (as they have in nearly every country in the world), health services have worsened. Prior to independence, there were impressive improvements in PNG’s health indicators (Hetzel 1974).4 Up to the mid-eighties, it could be said that the ‘regime of public health in Papua Guinea is remarkable’ (Denoon, Dugan and Marshall 1989, 5). But, writing two decades later, Thomason and Kase (2009, 117) recorded ‘a slow but steady decline in the [health] services available to rural people’. A systematic study of health and education facilities between 2002 and 2012 found that ‘PNG’s primary schools have expanded rapidly over the last decade, but that fewer services are now provided by its health clinics’ (Howes et al. 2014, v). In 2024, the deputy secretary of the Department of Health stated that public health indicators were at ‘an all-time low’ (Islands Business 2024). Meanwhile, non-communicable diseases (NCDs) have spread and today PNG has one of the highest rates of premature mortality from NCDs in the world (Table 10.14).
School enrolments have increased over the independence period. The share of 6–20 year olds in school increased from 37 per cent in 1996 to 50 per cent in 2006 and 65 per cent in 2016–18 (Pandey and Howes 2022, 171). However, while literacy has increased, the quality of education services provided has fallen. A Canadian husband and wife team who taught in PNG in 1972 recalled that the school they worked at—Kerevat National High School—‘was in excellent condition and well run’ and that the standard of education was high. Returning to the same school 38 years later (in 2010), they observed an:
education system in failure … rife with government corruption and plagued by inadequate funding, poor English skills of teachers, low curriculum standards, inappropriate assessment practices and a lack of teacher competence and professionalism. (Romanyshyn and Romanyshyn 2010, 1)
10.12 Summary period comparisons
Of the four periods, the third and fourth are opposites in terms of economic performance; the first and second are opposites with respect to volatility; and the fourth is the most unusual in terms of macroeconomic settings and outcomes.
The noughties were the best of times, and the tens were the worst (Figure 10.1). The noughties were a boom across multiple dimensions. This period stands out for its large, positive growth in economic outcomes, whether non-resource GDP, employment, tax revenue or commercial bank deposits. The fourth period stands out for its negative growth in formal private sector and SOE employment, real non-resource GDP per person growth and real deposits. Real revenue growth is only positive in the fourth period because of the rapid increase in resource revenue in 2022, which ended the bust. The fourth period has the worst growth performance in employment and deposits. Non-resource GDP per person growth is slightly worse in the first period, but the data for the latter are only from 1983 to 1988. The second period has marginally slower real revenue growth, again because of the rapid resource revenue growth of 2022.
The first and second periods are opposites in terms of volatility (Figure 10.2). The nineties were PNG’s most volatile period, the eighties its least. The second period had the highest growth variability, the highest inflation and the most depreciation. The first period had the lowest growth volatility and the most currency stability. The first period had average rather than low inflation, but this is because of high average global inflation in these early years (Table 10.9).
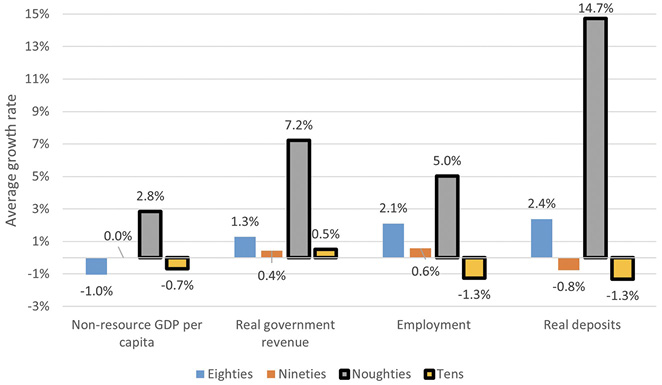
Figure 10.1: The best and worst of times—the noughties and the tens. An analysis using period average growth rates.
Notes: Non-resource GDP per person starts in 1983; government revenue in 1977; employment in 1978; and deposits in 1977. Appropriate deflators are used. Noughties and tens columns are highlighted to show their contrasting performance.
Source: PNG Economic Database.
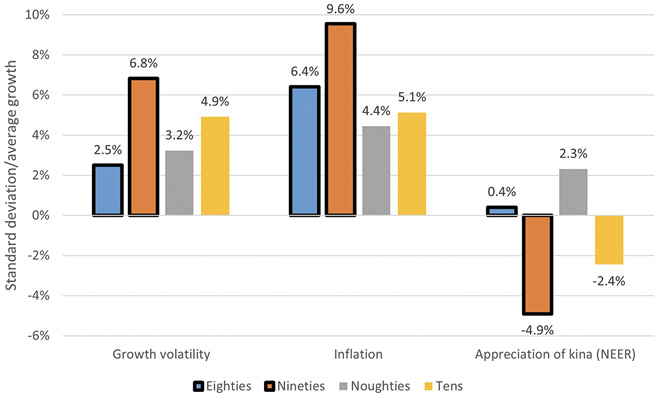
Figure 10.2: The most stable and volatile of times—the seventies/eighties and the nineties. An analysis based on growth volatility, inflation and depreciation
Notes: Growth volatility measured using standard deviation for real GDP. Inflation and nominal appreciation are average growth rates. GDP data start in 1976, inflation in 1977, nominal exchange rate data in 1975 and relative inflation in 1980. Eighties and nineties columns are highlighted to show their contrasting performance.
Source: PNG Economic Database.
Finally, on a number of macroeconomic variables, the fourth period is the most unusual or distinctive (Figure 10.3). It has (by far) the highest average fiscal deficit and current account balance (CAB), and the lowest average level of imports and resource revenue, all relative to GDP. These features are all related to this being the only period of currency inconvertibility. The low level of resource revenue put pressure on the kina, which the Bank of Papua New Guinea resisted by introducing foreign exchange rationing. This allowed the government to run high deficits without risking a balance of payments crisis. But it also compressed imports, contributing to the record current account surplus, though the primary reason for the latter was debt repayments from the PNG LNG project financed by LNG exports.
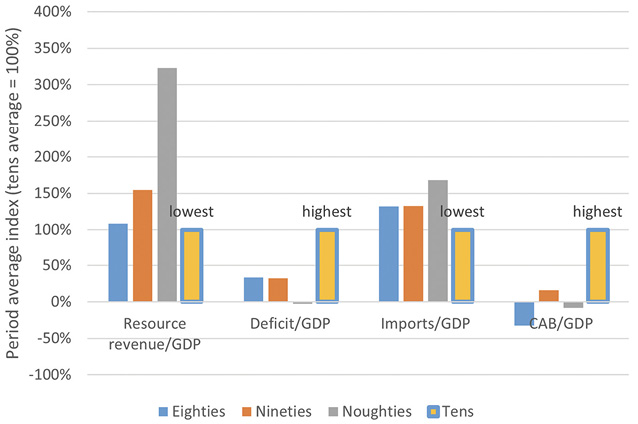
Figure 10.3: The most unusual of times—the tens. Index analysis, setting the average in the tens to 100%
Note: Variables start in 1976.
Source: PNG Economic Database.
We can learn a lot from these characterisations. One key lesson is that rapid growth in PNG is possible, but only if the conditions are right. These conditions include not only high commodity prices, but also ‘revenue-ready’ resource projects that ensure a high government resource take when resource prices are high (10.4). This combination was present in the noughties, but not in the other three periods. The first two had low and falling commodity prices, and the fourth had high commodity prices, but a low government resource take. Of course, there were also other reasons for low or high growth, including declining aid in the first two periods, the PNG LNG construction in the third, foreign exchange rationing in the fourth, and more generally the policy and institutional factors discussed in the next two chapters. That said, high commodity prices and revenue-ready resource projects emerge from this study as the best short-run predictors for rapid growth in PNG.
The noughties were a boom period worldwide. A natural group of comparator countries are the resource-rich countries of Sub-Saharan Africa. A World Bank study (Cust, Ballesteros and Zeufack 2022) defines the boom period for these countries as 2004–14 (very similar to our 2004–13) and looks at how these countries fared during, before (1993–2003) and after (2015–18) their boom, looking at both GDP and non-resource GDP. The results are shown in Table 10.12 with PNG added in.
Table 10.12: Pre-boom, boom and post-boom growth rates in Africa and PNG
|
GDP avg. growth rate (%) |
Non-resource GDP avg. growth rate (%) |
|||||
|---|---|---|---|---|---|---|
|
Pre-boom |
Boom |
Post-boom |
Pre-boom |
Boom |
Post-boom |
|
|
Resource-rich Africa |
4.6 |
5.4 |
2.7 |
4.5 |
5.8 |
2.5 |
|
Non-resource-rich Africa |
2.9 |
4.2 |
3.8 |
3.2 |
3.5 |
3.2 |
|
PNG |
2.9 |
4.5 |
3.8 |
2.7 |
5.6 |
2.0 |
Notes: For the African countries, pre-boom is 1993 -2003, boom is 2004 -14 and post-boom is 2015 -18. For PNG, the dates are as per this book: 1989 -2003, 2004 -13 and 2014 -22, respectively. There are 26 resource-rich African countries and 22 non-resource-rich ones. Resource-rich countries have at least 20 per cent of exports or 20 per cent of government revenue from the resource sector. PNG easily meets this criterion in terms of exports. All GDP growth rates are in constant prices, local currencies.
Source: African figures are for Sub-Saharan African countries only (Cust, Ballesteros and Zeufack 2022).
One of the main messages of the World Bank study is that, for resource-rich countries, ‘the growth record was strong during the boom but collapsed once commodity prices fell’ (Cust, Ballesteros and Zeufack 2022). This is true for PNG if we look at non-resource GDP. In the resource-rich African countries, non-resource growth fell from 5.8 per cent during the boom to 2.5 per cent after it. In PNG, the fall was even more dramatic, from 5.6 to 2.0 per cent. However, if we look at GDP growth, while growth halves in the African resource-rich countries after the boom (from 5.4 to 2.7 per cent), there is little decline in the PNG growth rate (just 4.5–3.8 per cent) due to the commencement of LNG exports in the post-boom era.
The World Bank study also finds that ‘the resource boom did not equip resource-rich African countries with enough savings to sustain economic growth after the boom ended’ (Cust, Ballesteros and Zeufack 2022, 50). PNG did not save enough during its boom either (6.3.1).
10.13 Overall assessment—an international perspective
While each period is quite distinctive, overall the post-independence development record has been disappointing. Writing in the late nineties, John Connell (1997, 317) concluded that ‘neither consistent growth nor sustainable development have been achieved’. (These are the last words in the main text of his book.) Since then, average growth has improved slightly, but, for the post-independence era as a whole, non-resource GDP per person has only averaged 0.4 per cent per year, and formal sector employment growth only 1.5 per cent, well below the population growth rate.
How does PNG’s growth and development experience post-independence look from an international perspective? PNG is a lower-middle-income country. Its 2022 GDP per capita is given by the World Bank as USD3,116 in current prices. The PNG government has itself held up Botswana and Malaysia as two other resource-rich countries whose growth record it aspires to emulate. Figure 10.4 updates a graph from the PNG government (GoPNG 2010). Clearly, PNG has been left behind by these two good performers, which at the time of PNG’s independence were as poor or poorer than it, but which today are upper-middle-income countries.
Although this is a comparison favoured by the PNG government, it is not one that is fair to the country. The next graph (Figure 10.5) gives a good idea of the diversity of growth experiences around the world, especially among poorer countries. The vertical axis shows the long-term average growth rate over 40 years, from 1980 to 2020, for the nearly 150 countries for which these data are available. The horizontal axis shows their per person GDP in the base year, 1980. That the graph makes roughly the shape of a triangle indicates that poorer countries exhibit greater diversity in their growth performance than richer ones.
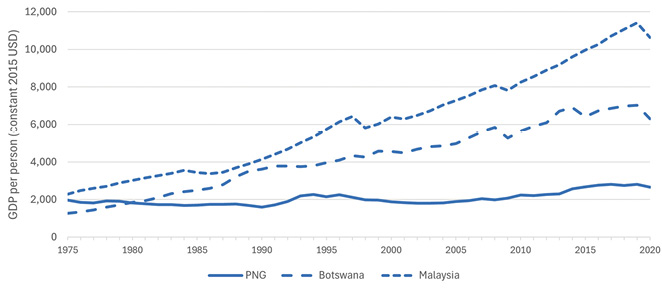
Figure 10.4: GDP per person in PNG, Botswana and Malaysia, 1975–2020
Source: World Development Indicators.
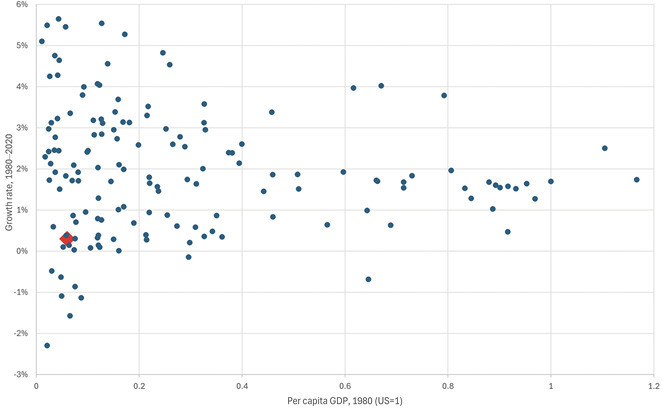
Figure 10.5: GDP per person in 1980 and GDP per person growth rate, 1980–2020, for a large number of countries, with PNG represented as a diamond
Note: PPPs used to calculate per person GDP. Horizontal axis truncated at 1.2.
Source: Calculated from PWT10 (Feenstra, Inklaar and Timmer 2015), except for PNG, on which see text below.
PNG is not included in the database from which this graph is constructed. However, in 1980, PNG’s GDP per person was only 6 per cent of the US’s using market exchange rates.5 Therefore, on the horizontal axis, PNG would fall very much to the left-hand side, that is, as one of the poorest countries in the world in 1980. On the vertical axis, PNG’s growth performance is by no means the worst in the world, but it is certainly towards the bottom end of the performance ranking. PNG’s non-resource GDP average growth between 1983 (the first year for which this measure is available) and 2020 is 0.3 per cent in local currency, using constant prices. A handful of countries (eight) have done worse with negative growth. PNG has avoided that fate, but is in the next group of about a dozen poor countries with 0–0.5 per cent growth.
Table 10.13 zeroes in on these comparator countries. It shows those with starting GDP per person in 1980 of 20 per cent or less of the US’s and subsequent average growth that is positive but no more than 0.5 per cent. There are 12 such countries (apart from PNG). They are all in Africa except for Nicaragua. They all have smaller populations than PNG except for Côte d’Ivoire and Cameroon. Some are resource exporters, but only the Republic of Congo and Mauritania are resource-dependent economies like PNG. Of these countries, PNG’s political regime is the most durable. It is the only one with no coups, civil wars or periods of one-party rule. All the countries with negative growth over this period are also characterised by political regime instability.
Table 10.13: Population and democracy disruptions for countries with similar growth rates and starting points to PNG
|
GDP per person |
||||
|---|---|---|---|---|
|
Growth rate, 1980–2020 |
Share of US, 1980 |
Population 2020 (million) |
Disruption to democracy |
|
|
Côte d’Ivoire |
0.39% |
12% |
26.8 |
Coup |
|
Togo |
0.38% |
6% |
8.4 |
One-party rule |
|
Congo |
0.33% |
12% |
5.7 |
Coup |
|
Liberia |
0.30% |
8% |
5.1 |
Coup |
|
Papua New Guinea |
0.30% |
6% |
8.8 |
None |
|
Nicaragua |
0.29% |
15% |
6.8 |
Civil war |
|
Sierra Leone |
0.14% |
6% |
8.2 |
Civil war |
|
Cameroon |
0.14% |
12% |
26.5 |
One-party rule |
|
Guinea-Bissau |
0.10% |
5% |
2.0 |
Coup |
|
Sao Tome & Principe |
0.09% |
12% |
0.2 |
Coup |
|
Comoros |
0.08% |
11% |
0.8 |
Coup |
|
Gambia |
0.03% |
7% |
2.6 |
One-party rule |
|
Mauritania |
0.01% |
16% |
4.5 |
Coup |
Notes: Countries selected from Figure 10.5 are those with a starting GDP relative to that of the US of 20 per cent or less and a long-term average per person growth rate of 0–0.5 per cent. The disruption to democracy variable shows one type of deviation from democracy, if any, the country experienced over the period.
Source: For first three variables, PWT10 (Feenstra, Inklaar and Timmer 2015) and World Development Indicators except for PNG growth and population, from the PNG Economic Database. Non-resource GDP per person growth used for PNG (1983–2020). Disruption to democracy from various sources.
Resource dependency is another interesting variable for international comparisons. PNG’s resource dependency ratio (resource sector GDP to total GDP) has almost tripled over the post-independence period (Figure B3). According to UN data, it is the sixth most resource dependent, based on the same ratio (Howes and Leng 2023). A few resource-intensive economies are missing from this database, but the message is clear: PNG has become one of the most resource-dependent economies in the world. The fact that it ranks just above Saudi Arabia on this indicator speaks volumes.
We have already started a discussion of service delivery indicators in PNG from an international perspective (10.11). On some broad measures, PNG does not appear to do too badly. Life expectancy is estimated by the World Bank in 2021 at 65, just below the average for lower-middle-income countries (67). Adult literacy is estimated for 2010 (based on the 2011 Census) at 62 per cent, well below the lower-middle-income country average for that year of 73 per cent, but above the low-income average of 54 per cent. But there are a number of indicators where PNG does very poorly indeed. Table 10.14 provides data on international rankings for 14 indicators relating to education, health, household infrastructure, poverty and violence. PNG’s ranking is the worst of all countries for which data are available (typically 100 or more) for immunisation and access to improved drinking water. It is a bottom-five country for universal health coverage, probability of premature death from NCDs, improved sanitation, grid connections, child stunting and households with children out of school. It is a bottom-10 country for rates of intimate partner violence, doctors per person and poverty. And it is a bottom-20 country for the share of households without an educated adult, severe food insecurity and the lack of a government monopoly over violence.
Table 10.14: PNG standard of living and service delivery indicators—international rankings
|
Value (%) |
Ranking (1 = worst) |
No. countries ranked |
Year |
Source |
||
|---|---|---|---|---|---|---|
|
Education |
||||||
|
1 |
Households with unenrolled children |
41.8 |
5 |
88 |
2016–18 |
Baxi, Naidoo and Tandon (2024) |
|
2 |
Households without educated adults |
39.7 |
16 |
122 |
2016–18 |
Baxi, Naidoo and Tandon (2024) |
|
Health |
||||||
|
3 |
Universal health service coverage |
30 |
3 |
223 |
2021 |
WHO and World Bank (2023) |
|
4 |
Probability of premature mortality from non-communicable diseases |
36 |
4 |
183 |
2022 |
WHO (2022) |
|
5 |
Child immunisation rates |
35.7 |
1 |
191 |
2019 |
Howes and Mambon (2021) |
|
6 |
Doctors per million |
63 |
7 |
193 |
2021 |
World Development Indicators |
|
Household infrastructure |
||||||
|
7 |
No connection to the electricity grid |
83.1 |
3 |
120 |
2016–18 |
Baxi, Naidoo and Tandon (2024) |
|
8 |
No improved sanitation |
88.0 |
4 |
99 |
2016–18 |
Baxi, Naidoo and Tandon (2024) |
|
9 |
No improved drinking water |
60.6 |
1 |
112 |
2016–18 |
Baxi, Naidoo and Tandon (2024) |
|
Poverty and gender inequality |
||||||
|
10 |
Severe food insecurity |
30.6 |
15 |
122 |
2016–18 |
Baxi, Naidoo and Tandon (2024) |
|
11 |
Consumption below the poverty line |
39.3 |
10 |
122 |
2016–18 |
Baxi, Naidoo and Tandon (2024) |
|
12 |
Stunting in children under five years |
49.5 |
4 |
132 |
2016 |
IFPRI (2016) |
|
Violence |
||||||
|
13 |
Intimate partner violence |
31.0 |
6 |
177 |
2018 |
GIWPS and PRIO (2023) |
|
14 |
State monopoly over violence |
N/A |
11–17 |
137 |
2022 |
Bertelsmann Stiftung (n.d.) |
Notes: 1. At least one school-age child up to the age of Grade 8 is not at school. 2. No adult in the household (at age of Grade 9 or above) has completed primary education. 3. Combines 14 indicators of health service coverage. 4. Probability of dying between age 30 and 70 from cardiovascular disease, diabetes, cancer or chronic respiratory disease. 5. Average (value and ranking) for three childhood immunisations: DPT, Hep3 and measles; the variable is measured as percentage of 12–23 month olds immunised. 6. Data are from 2021 or latest available year. 8. Neither flushed toilet leading to a piped sewer system or septic tank nor composting toilet. 9. Drinking water sourced from a pipe, borehole or protected well. 10. Households answer yes to seven or more of the standard eight Food and Agriculture Organization food insecurity questions. 11. Household imputed to be poor based on non-monetary indicators in the 2016–18 DHS based on relationship between monetary poverty and the same indicators in the PNG 2009 Household Income and Expenditure Survey. 12. Stunting is the percentage of children under five years of age whose height for age is below two standard deviations from the median of the WHO Child Growth Standards. 13. Intimate partner violence is the percentage of ever-partnered women who experienced physical or sexual violence committed by their intimate partners in the preceding 12 months. 14. PNG scores a 4 on a scale out of 10 with six other countries in the Bertelsmann Stiftung Transformation Index ranking for 2022 on the state’s monopoly on the use of force, which indicates that the ‘state’s monopoly on the use of force is established only in key parts of the country. Large areas of the country are controlled by guerrillas, paramilitaries or clans’ (BTI 2022).
Source: See table. All the Baxi, Naidoo and Tandon (2024) sources rely on data from the PNG 2016–18 Demographic and Health Survey (DHS) and compare these results to DHS findings from other countries.
For at least some of these indicators, the very low rankings are the result of relative or absolute decline in PNG’s performance, and so cannot be said simply to be the product of the country’s difficult geography.
For example, in 1975, the ratio of doctors to population put PNG 43rd from the bottom in a global ranking of countries, and at about the average ratio for the ‘least developed’ country grouping, about 85 per million. Over time, most countries have been better serviced by doctors. But PNG has gone backwards. The 2019 figure for PNG is 63 per million, seventh from the bottom, and just a quarter of the average for least developed countries.
Likewise, PNG was an above-average performer for immunisation, but whereas the average low-income and lower-middle-income country has seen its immunisation record consistently improve, PNG has seen a massive slide in performance. Figure 10.6 illustrates using the vaccine for measles.
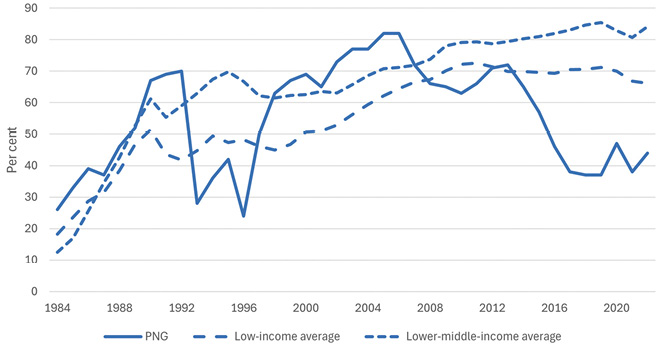
Figure 10.6: Immunisation rates for measles—PNG, low-income and lower-middle-income countries 1984–2022
Notes: The rate is the percentage of children aged 12–23 months who have been vaccinated.
Source: World Development Indicators.
In summary, PNG has enjoyed an unusual level of political regime stability, but its growth and development performance has nevertheless been disappointing, both relative to expectations at independence and from an international perspective. Growth has been slow, the economy has become much more resource dependent, and some important indicators of living standards and service delivery are alarmingly low and, in some cases, have fallen, either relatively or absolutely.
1 Figures for other census years for the non-citizen population are 25,620 in 1990 and 19,235 in 2000 (Nelson 2007b).
2 Combining the government payroll with the published number of government staff.
3 The REER can also be defined as the ratio of the price of tradeables to non-tradeables. While data on this were collected in PNG, there is not a complete series.
4 ‘Comparison between the two periods 1952–62 and 1962–67 shows a striking fall (54%) in deaths due to malaria, bacillary dysentery and tuberculosis’ (Hetzel 1974, 216).
5 The graph uses purchasing power parities, but this gives a similar ratio for 1990, the first year for which these data are available.
Previous Next



