


 menu
Ten Thousand Years of Cultivation at Kuk Swamp in the Highlands of Papua New Guinea
14
Phase 4: Major Disposal Channels, Slot-Like Ditches and Grid-Patterned Fields
Tim Bayliss-Smith, Jack Golson and Philip Hughes
Introduction
Phase 4 in its wider context
This chapter focuses on the evidence for a distinctive new phase of swamp drainage at Kuk Phase 4, which took place between about 2000 and 1100 years ago. Elsewhere in the Pacific region at this time, there were changes in landuse that have been seen as symptoms of agricultural intensification, often involving enhanced water control and the formation of island beds or pondfields for the cultivation of taro, Colocasia esculenta. The evidence comes from both Polynesia (e.g. Kirch and Lepofsky 1993) and Island Melanesia (e.g. Spriggs 2002). In New Caledonia, for example, which was first colonised by Austronesian-speaking settlers 3000 years ago, extensive pondfield terracing began during the period assigned in New Guinea to Kuk Phase 4, and this intensification process continued into recent times (Sand 2012: 172). Archaeologists have disagreed about whether these changes in the wider region are independent of each other or whether they reflect the movement of crops, techniques and ideas from place to place. The New Guinea highlands have generally been regarded as largely autonomous in their trajectory of change, but by Phase 4 times some external influence becomes a possibility.
Swamp drainage in the highlands was certainly a widespread phenomenon in Phase 4 times, but direct evidence for the plants being cultivated remains sparse. We suggest that in the highlands they included bananas, taro and indigenous yams (Dioscorea alata, D. nummularia and D. bulbifera), all long-established starch staples, plus sugarcane and green vegetables. It is unlikely that by this time highlanders would have been in possession of the lesser yam, Dioscorea esculenta, which some scholars believe to be of Southeast Asian origin. There is evidence to suggest that its arrival in the Pacific was later than that of the pottery, pigs and other items of Southeast Asian derivation that appeared in the Bismarck Archipelago with Austronesian colonists around 3300 years ago in the archaeological context of the Lapita culture (Spriggs 1997: 88; Summerhayes 2010: 13, 25–26; cf. Denham, Bronk Ramsey and Specht 2012: 43–44).1
How quickly did these Austronesian innovations spread to the New Guinea mainland? In a comprehensive review, O’Connor et al. (2011) find no support for claims for the presence of pottery and pigs in mainland New Guinea in the early to mid Holocene, nor indeed before 3000 cal. BP, given the sparseness of the evidence for interaction between the mainland and the Bismarck Archipelago during the Lapita phase there (2011: 19–20).
The situation was already changing, however, at least as far as the south coast of Papua was concerned. For Wari Island, off the tip of the tail of Papua some 60 km southeast of Samarai, Negishi and Ono (2009: 46–48) described a ceramic sequence starting between some 2800 and 2600 years ago, with pig present in two middle layers, the upper of them dating between about 2300 and 2000 years ago. This was followed by the appearance of the first results from recent substantial excavations at Caution Bay, 20 km northwest of Port Moresby. Here essentially the first Lapita pottery on the New Guinea mainland was found at sites belonging to a period dated on the calibrated results of a set of radiocarbon dates to between about 2900 and 2500 cal. BP (David et al. 2011; McNiven et al. 2011), the end date now able to be replaced by one of 2600 cal. BP as the result of further dating (Bruno David, pers. comm., 2014). These sites are said to ‘contain not only Lapita assemblages, but also rich ceramic sequences variably covering individual horizons and long cultural sequences’ (David et al. 2012: 73) extending after 2000 BP, the date when previously settlement of southern Papua by Austronesian-speaking pottery makers was thought roughly to have begun (David et al. 2012: 73–75).
The relevance of this survey for our study of Kuk is that it reopens the possibility of external influences in Phase 4 times. The presence of pig bone at some of these lowland sites provides the earliest possible date for the appearance of pig in interior Papua New Guinea, whether in association with the lesser yam or not. McNiven et al. (2012: 146) suggest that pigs were present in the Caution Bay area by at least 2500 years ago on the basis of finds at the Edubu 1 site, which is consistent with the information from Negishi and Ono (2009) on pig bone finds on Wari Island cited above. We return to this subject in Chapter 15, section ‘Artefacts, houses and pigs’.
Soil tillage as an innovation
Between Phases 3 and 4 there is an interval stratigraphically marked by two tephras, Mun (NP) and Baglaga (Y), and a change in the composition of the swamp deposits from black clay to the formation called ‘garden soils’, as discussed in Chapter 6 (cf. Figs 6.10, 6.11). The very sporadic occurrences of Mun ash are found at the stratigraphic break, with the more common and more continuous Baglaga appearing just a few centimetres above it. At an early stage of the Kuk investigations, Golson (1977a: 621–622) argued that this stratigraphic change was linked with an important development in the practice of dryland agriculture, in the form of soil tillage.
Soil tillage was an important innovation that responded to problems in dryland agriculture following the progressive replacement of local forest by grassland, as discussed in Chapter 9, section ‘Mid to late Holocene’. Grassland soils are not only relatively infertile, they are also more difficult to cultivate. Soil tillage would have been a necessary step towards making areas of grassland productive, by removing roots from fallows and by increasing soil aeration. This would have provided an improved dryland system for the cultivation of bananas, yams and sugarcane.
The first unit of the garden soils above the stratigraphic change is a soft, silty clay containing soil aggregates and this is interpreted by Hughes and Golson (Chapter 6, section ‘Garden soils’) as the result of erosion from local catchments where soils were being disturbed with the introduction of tillage. In the same chapter, however, Denham offers a different explanation for the change in the composition of the swamp deposits, seeing it as due to weak soil formation on slowly accumulating sediments (see Denham 2003a, vol. 2, Appendices E6 and E7).
Figure 6.10 (and the following explanatory text) treats this change as representing a stratigraphic event, not a pedological process. It shows its location and sets out the evidence for its date in calibrated radiocarbon years: after a late stage of black clay formation dating within the age range 2730–2360 BP and before the horizon underlying Baglaga tephra that formed within the age range 2710–2120 BP. We adopt a date of 2500 years ago for the stratigraphic break and look at what happens during the period following this from the viewpoint of both dryland and wetland agriculture.
Taro in the wetlands
In the major highlands valleys where people had little access to forests suitable for swiddens, taro (Colocasia esculenta) was probably becoming less important than in Phase 3 times. We interpret the appearance of tillage at Kuk as signalling the cultivation of grassland soils for a range of crops including bananas and yams. Even before the onset of Phase 4, dryland taro would have been restricted to small patches of enriched soils, for example adjacent to houses, in wet gullies and in places made fertile by short woody fallows. Taro is limited to such sites today in the upper Wahgi Valley (Powell et al. 1975: 11–12; Stewart and Strathern 2002: 290) and elsewhere (Bowers 1968: 80–81; Waddell 1972: 57, 63; Clarke 1977; Sillitoe 1996: 341–344; see Fig. 11.11). In the Lamari Valley in the eastern highlands, where the retreat of forests meant that people were obliged to use grassland soils for both taro and yams, taro cultivation is restricted mainly to sites made productive by the irrigation water provided by bamboo piping (Boyd 1981: 78).
Taro’s need for fertile soils has been much emphasised. From an extensive review based on his own and others’ observations, Clarke (1977: 160) noted that highlanders only select for taro certain places that they are sure will be suitable, such as patches cleared from bush, gullies and old house sites. Even in such places, taro is always planted in newly cleared soil, often after minimal tillage, and is never replanted in the same place for a second crop. For the Wola, who live at around 1700 m in Southern Highlands Province, Sillitoe (1996: 340) noted that ‘gardens put down a second time to taro or a varied intercrop will not give worthwhile yields, wherever the site and whatever the soils except for the occasional exceptionally fertile pocket’.
As well as soil problems, taro is also vulnerable to pest attack, particularly in dryland sites where the corms suffer damage from the larvae of Papuana beetles that thrive in areas of cane grass (Miscanthus floridulus) (Fig. 14.1). Four species have been identified that attack taro corms and shoots in the highlands: Papuana trinodasa Prell., P. tibialis Arrow, P. woodlarkiana Montr. and P. biroi Endrodi (Gagné 1982b: 486; French 2006: 93). It is beetle attack that makes taro cultivation difficult and unrewarding today in the deforested regions of the highlands and the problem is only avoided if the crop is planted in forest swiddens or in wetlands (Bayliss-Smith and Golson 1992b: 13–15). In the southern highlands, Sillitoe (1996: 252) notes that in the taro gardens of the Wola Papuana beetles cause ‘considerable local damage’. In the Bimin Valley of the Telefomin district of Sandaun (formerly West Sepik) Province, cultivators making taro gardens at 1800–2000 m do not generally suffer any Papuana beetle damage if they restrict their plantings to forest swiddens (Bayliss-Smith 1985b). Out of a sample of 90 corms grown in swidden gardens within the closed forests of Bimin, only two were found to have holes made by beetle larvae, but more significant damage was reported from lower sites cleared from a fallow vegetation of open bush and Miscanthus cane grass (Bayliss-Smith 1985b: 108, 110). Such sites today are not regarded as suitable for taro and are relegated to sweet potato cultivation.

Figure 14.1 Specimens of Papuana woodlarkiana and a photograph showing damage by Papuana beetles to taro corms harvested at Baisu Corrective Institution.
Baisu is located in the upper Wahgi wetlands 4 km east of Kuk. The drainage and cultivation of taro here represent a useful analogue for Kuk Phase 4. At Baisu repeat harvests of taro from the same ground can be achieved by using Lindane pesticide; we argue that at Kuk in prehistory a swamp fallow would have been needed to eliminate infestations of taro beetles (Bayliss-Smith 1985a; Bayliss-Smith and Golson 1992a).
Source: Upper image, www.lescoleopteres.com/coleoptera-dynastidae-C-21_26.html (with permission); lower image, photograph by Tim Bayliss-Smith.
The same environments that confer protection from beetles generally also provide higher levels of fertility and soil moisture. For example, in the Mount Hagen area near Kuk taro gardens are of two types: pana me at the forest margin or within secondary forest regrowth and pana ui in swamps that require drainage (Powell et al. 1975: 11). Even in such sites, which are normally less vulnerable to beetle attack, the taro plants require some protection: ‘flat stones are laid near the stalk on the surface of the ground in order to prevent beetles from boring holes into the tubers’ (Powell et al. 1975: 21). Taro is almost never replanted on the same site, perhaps because the soils become infertile as Clarke (1977) suggested, but also because beetle infestation becomes a threat.
Experimental studies confirm these ethnographic observations. After ditching and tillage, swamp soils cultivated in 1980 at Baisu Corrective Institution 4 km east of Kuk produced good crops of taro. Yields ranged from 14–24 tonnes per hectare per year (average: 21 t/ha/yr), but in all cases the crop was protected from damage by the use of Lindane insecticide, applied at the time of planting and again at mid growth (Bayliss-Smith and Golson 1992a: 13–14). Experimental plots established on the Kuk Station that were also treated initially with Lindane had a comparable yield of 18 t/ha/yr, but adjacent plots without Lindane protection were ravaged by beetles and achieved a yield of only 3 t/ha/yr of corms mostly riddled with the holes of Papuana larvae. Indeed, it proved difficult in the untreated plots at Kuk to grow taro at all, despite persistent replanting in the first two months after the initial planting. All too often the taro setts would be attacked before any root system was established and their underground parts eaten away. Of the 140 plants in the control plots only 77 (55 per cent) survived to harvest, whereas the 120 Lindane-treated plants all survived and flourished until harvested 52 weeks later (Bayliss-Smith and Golson 1992a: 14).
The scale of damage to taro in drained soils and grassland sites is confirmed for other highlands regions. In his dryland experimental plots near Mount Hagen, Bill Clarke (1977: 163) planted root crops on a soil cleared from Miscanthus grassland and locally regarded as ‘good’. Sweet potato plots yielded 18 t/ha/yr but taro plots produced only 4.4 t/ha/yr and 42 per cent of the taro plants were destroyed by beetles. Another site with a ‘poor’ soil that was previously cultivated for sweet potato produced a minimal 0.8 t/ha/yr of taro with heavy beetle damage and almost half of the plants not surviving to harvest (Clarke 1977: 163). Experiments by Swift (1985) at Wau Ecology Institute produced similar results in six different plots, with taro yields averaging 2.95 t/ha/yr. Five plots experienced beetle damage affecting up to 60 per cent of plants, the larvae boring holes into corms and causing parts to rot, so reducing the edible portion (Swift 1985: 75).
Both the Mount Hagen and the Wau taro trials were located in areas of forest disturbance and widespread grasslands and the soils at each site had previously been cultivated. The same is true of the drained fields at Baisu and the plots at Kuk Station in the trials of 1980. As a result, in all four cases we can invoke a decline in soil fertility as well as a build-up of local Papuana beetle populations, making sustained taro production almost impossible without the use of Lindane insecticide.
We believe that these various findings have far-reaching implications for our interpretation of Phase 4 at Kuk. Dryland soils under grassland would have been problematic for taro, although, after soil tillage, more or less suitable for yams and bananas. The wetlands, despite the logistic problems of drainage, offered an attractive alternative. Waterlogged conditions eradicate taro beetles and also produce high soil fertility from alluvial and organic deposits. Drainage makes available these pest-free fertile soils for taro cultivation, but it also permits the invasion of beetles especially where there are nearby grassland habitats for Papuana spp., which is the scenario proposed for Kuk as a result of the extensive forest clearances that had taken place by 2500 years ago. After a single taro crop was taken, the increasing insect damage and declining soil fertility would have obliged the cultivators to shift their efforts to another site. Once the drainage system was no longer maintained, a swamp fallow could be quickly reestablished, which would eliminate taro beetle infestation. Some years later, provided the site was recycled before fading memory and the infilling process had eliminated all trace of its drainage network, then the former ditches could be reexcavated with comparatively little effort.
Perhaps the cultivation of Kuk Swamp in Phase 4 was dominated by a cycle of taro followed by swamp fallow, or perhaps Phase 4 landuse may have been not unlike the pana type of mixed garden found today in the upper Wahgi Valley (Stewart and Strathern 2002: 290), but without the introduced maize:
Pana gardens are planted with many different kinds of vegetables. They may have Colocasia taro and bananas as their main crops. The crops develop at different times, greens and cucumbers first, then maize, New Guinea asparagus [Setaria palmifolia], and later taro, then finally bananas and sugarcane. A pana garden therefore lasts for quite a long time. It needs fertile soil, and often is cut into tree fallow for this reason.
In the past, wetlands provided an alternative to tree fallows, especially for those communities lacking access to secondary forest, and we can interpret Phase 4 as evidence of the spread of pana-type gardens from drylands into the swamps. The attractions of wetlands like Kuk would have been greatly enhanced in times of drought and it is this aspect of the Phase 4 context that we now review.
Responses to drought
Up until the last few years, it has been difficult to investigate the influence of Holocene climatic fluctuations on agricultural change in New Guinea. The indirect indicators of past climates in the highlands, principally pollen and sediments from lake cores and swamp deposits, revealed interesting long-term trends in vegetation cover and erosion rates, but these trends could largely be explained as the outcome of human impacts on the landscape rather than climatic factors. In the analysis of pollen, for example, the methods available are not yet sensitive enough to allow us to detect short-term fluctuations in climate such as those associated with ENSO, the El Niño–Southern Oscillation (Haberle 1998a: 9).
The possibility that swamp drainage in New Guinea was a response to drought was an idea first explored by Brookfield (1989), who suggested that ENSO events seemed to be intensifying in the late Holocene. Following the construction of a proxy El Niño record extending back for 2000 years in equatorial Peru, Simon Haberle (1998a: 9) made a comparison with the pollen and archaeological record from New Guinea and concluded that:
[s]wamp cultivation occurs during periods of greatest climatic variability. Periods of chronic drought stress may have initiated the need for greater ground-water control leading to the development of grid patterns of field ditches, seen in Phase 4 and onwards at Kuk Swamp.
In contrast to the Phase 4 period, Haberle argued, the period that followed between about 800 and 1000 years ago seems to have been a time of warmer and more stable climate, corresponding to the Mediaeval Warm Period of the northern hemisphere. He pointed out that at Kuk there is no evidence for swamp cultivation at this time (Haberle 1998a: 9, Fig. 11; cf. Haberle and David 2004: 176, Fig. 5).
We can get some idea of the response of highlanders to droughts in the past by considering the impact of ENSO fluctuations during the 20th century. The severe droughts of 1940–41, 1982–83 and 1997–98 all caused crop losses and localised food shortages. Losses were particularly serious during the intense 1997–98 event, especially in the zone above 2000 m where repeated frosts damaged the sweet potato crop. Rebecca Robinson (1999, 2001) monitored the effects of the 1997–98 drought around Lake Kopiago in Southern Highlands Province (altitude 1320 m). Local responses included a widespread burning of fallow vegetation to make new gardens (most of which failed), followed by long-distance mobility to exploit pandanus and famine foods, and also the reclamation of wetlands as an alternative to dryland cultivation. She found (Robinson 1999: 157) that:
[w]etlands at Kopiago are a highly productive zone, but subject to crop losses from flooding. In dry spells new ditches are excavated. In droughts short term mid- or deep-swamp gardens, sometimes with incomplete ditches, are made to provide human food and pig fodder during the drought. These gardens have to be abandoned when regular rains recommence.
In 1997, very little rain fell after April. After five months of drought, most people in the Kopiago Basin were relying on famine foods to replace their diminishing supplies of sweet potato. The margins of Lake Kopiago receded and in October some people began to establish ditched or partially ditched gardens in the deep swamp. Sweet potato crops were harvested within four months, though some of these gardens, for example at Konapia Kana, were abandoned after being flooded in March 1998 when the rains returned. Elsewhere, for example at Kale Kana where a denser network of deeper drains had been dug, the new gardens remained viable until they were flooded in August 1998 (Robinson 1999: 83, 89–90; 2001: 192).
These observations match those of patrol officer McBride in 1960, who noted that the best crops he had seen were grown in the drained swamplands of the Kopiago Basin and in the upper Tubudu Valley. Ditches to drain the swamps were dug in dry weather and the crops took only four months to mature: ‘three crops are grown a year on one site; four if the land does not become flooded’ (B. McBride 1960, cited by Robinson 1999: 30).
The response to drought at Kopiago relates to an economy dominated by sweet potato and pig husbandry, whereas at Kuk in the past taro was probably a major staple. Taro takes longer than sweet potato to mature, so that any lowering of the watertable needs to be prolonged if swamp cultivation is to be productive. For example, on drained wetlands at Baisu, 4 km east of Kuk, taro was being harvested in 1980 on average 50 weeks after planting (Bayliss-Smith and Golson 1992a: 14). However, the yields at Baisu were remarkably high, averaging 21 tonnes per hectare, which is two to three times better than rain-fed taro grown on dryland sites in a regime of forest-fallow swiddens (Bayliss-Smith 1985a: 299). It is clear from these data that wetland drainage could offer substantial rewards to farmers at Kuk in prehistory, if there were sufficient labour and skills and an appropriate form of social organisation. Could it be that a period of unusually intense El Niño droughts provided a particular incentive for swamp drainage to be initiated?
El Niño and Phase 4
Ethnographic analogies based on sweet potato and the Kopiago Basin may not be easily transferable to Kuk Swamp in the pre–sweet potato era, but it is worth noting that the initiation of Phase 4 drainage in the period following the stratigraphic break of 2500 years ago did occur at a time of extreme El Niño phenomena. ENSO events can be reconstructed from the record of sea-surface temperatures that is preserved in oxygen isotope ratios in Porites corals, including fossil corals on islands offshore from Madang and Wewak on the north coast of New Guinea (Gagan et al. 2004; McGregor and Gagan 2004). All of the coral records available show large and protracted isotope anomalies indicative of severe and frequent El Niño events during the period between about 2500 and 1700 years ago. The record from Madang shows a four-year El Niño 2500 years ago that is almost twice the amplitude of the 1997–98 event (Tudhope et al. 2001). The record from Muschu Island near Wewak dated to about 2040 years ago is even more remarkable. It shows a severe seven-year El Niño ‘longer than any recorded Holocene or modern event’ (McGregor and Gagan 2004: 14). There is confirmation from work in southern China that suggests there was a high incidence of regional droughts during the period around 2100 years ago (Yancheva et al. 2007). An oxygen isotope record of a coral from Christmas Island also reveals an extreme El Niño, at least double the severity of the 1997–98 event and dated to 1700 years ago (Woodroffe, Beech and Gagan 2003).
If a prolonged drought in 1997–98 dried up Lake Kopiago and encouraged a phase of ditch digging in the former wetlands, it is worth speculating in what way communities living beside the upper Wahgi swamps might have responded to a seven-year drought 2000 years ago. The spread of grasslands in the highlands was already well advanced by that time, as we have seen. Golson (1977a: 624) originally proposed that Phase 4 at Kuk represented an ‘experiment’ in wetland cultivation made necessary by the degraded character of vegetation and soils in the Wahgi, a problem only somewhat mitigated by the innovation of dryland tillage. In later publications, the incentives for wealth and status enhancement through wetland drainage have been emphasised (e.g. Golson 1982; Golson and Gardner 1990; Bayliss-Smith and Golson 1992a), but the new evidence for severe droughts during the period under review may mean that the case for subsistence crisis needs to be reopened. At the very least, we can envisage frequent and severe droughts as providing a strong incentive for large-scale drainage, so providing a context for renewed drainage activity.
Forest foraging and high-altitude cultivation
Drought might also have increased the search for food from higher altitudes. One important tree crop is nut pandanus, karuka (Pandanus spp.), especially P. julianettii, which is cultivated in open forests between 1800 and 2600 m, but also wild karuka like P. brosimos, with an altitudinal range from 2400 to 3100 m (see mean altitudinal ranges in Table 4.4). Flowering and fruiting of P. julianettii is irregular and is stimulated by periods of dry weather (Bourke et al. 2004: 39–41). As noted above, Robinson (1999: 25) observed during the 1997–98 drought that many people in the Lake Kopiago region migrated to higher altitudes to take advantage of the pandanus nut harvest. Ole Christensen recorded in his 1972 fieldnotes that during periods of food shortage in the Wurup Valley of the upper Wahgi, men would move up to the forests in search of karuka; they would live in rockshelters close to the pandanus groves or in bush huts, eat karuka nuts and carry the remainder back to lower altitudes for their families (cited by Donoghue 1988: 49–50, who says, however, that it is unclear whether the latter activity concerns the harvesting of wild or high-elevation cultivated varieties).
If El Niño started to intensify 2500 years ago, then we might expect to see also an increased exploitation of resources like karuka from nearby montane forests. Direct evidence for such use is available from sites in the Manim Valley, a side valley off the Wurup Valley 12–15 km south-southwest of Kuk, where Christensen (1975) studied the deposits in four rockshelters. Our survey of the four sites is mainly based on Donoghue’s (1988) analysis of Christensen’s archaeobotanical data. However, we draw attention to the discussion in Chapter 10, section ‘Nut- and fruit-bearing trees’ and to Table 10.2, which is the source of the radiocarbon chronology used here.
We start with the Manim 2 site at 1770 m, where the wild nut pandanus Pandanus antaresensis, with a wide altitudinal range of 1000 to 2350 m, was dominant among the organic remains from first occupation, before the radiocarbon date ANU-1375, with a calibrated age range of 11,800–10,300 BP, late in the Pleistocene. Its disappearance just after the radiocarbon date ANU-1373, with a calibrated age range of 7000–6350 BP, is seen as indicating a shift of site-based activities to ones related to an agricultural zone. There was a sudden massive but short-lived increase in the sedimentation rate at the Manim shelter around 2750–2150 BP (the calibrated range of ANU-1370), attributed by Hughes (1985: 400) to the tillage of grassland then adjacent to the site.2 Around the same time (ANU-1326, with a calibration range of 2750–2350 BP), the gardening zone reached the Kamapuk shelter (2050 m altitude) and species of wild pandanus, notably P. iwen from Nothofagus forest above the site, appeared in the deposits. At higher levels Etpiti (2200 m) and Tugeri (2450 m) came into use, the former after the calibrated date range of ANU-1323, 2350–2000 BP, the latter after that of ANU-1321, 2700–2350 BP. We can conclude that, at this time of intensified El Niño, cultivation was extending upslope into former montane forest and the high-level rockshelters started to be used for overnight stays by people seeking access to resources beyond the limits of cultivation, though nut pandanus was not involved in the first activities there (Donoghue 1988: 85 for Etpiti, 88 for Tugeri).
These changes in resource use after 2500 years ago at Wurup may be matched elsewhere in the highlands, although they are not easy to detect in pollen diagrams. However, the record for Sirunki and Inim (2500 m) shows renewed forest disturbance probably for gardens, starting at an inferred date about 2000 years ago (Walker and Flenley 1979: 339–340; cf. Golson 1996: 164). At other sites in the Wahgi Valley, there are similar indications of renewed deforestation starting 1900 years ago (Haberle 2003: 155). Movements of population to intensify the use of resources at higher altitudes would be one likely response to prolonged drought in the upper Wahgi, just as the cultivation of wetlands would be another.
Agricultural use of the high-altitude zone is suggested by the evidence from Tambul in the upper Kaugel Valley, some 45 km southwest of Kuk, where Phase 4 ditches have been recorded in the valley floor at about 2200 m altitude, on land belonging to the High Altitude Experiment Station (Golson, fieldnotes, 1976). This site is too high for yams and bananas, but taro and sugarcane can be grown today, although their yields are low (Bayliss-Smith 1988). In experimental plots that Bayliss-Smith established adjacent to the Phase 4 site at Tambul, taro averaged 3.6–5.2 tonnes per hectare (Bayliss-Smith 1985a: Table 5), less than 25 per cent of the yield obtainable in the Wahgi swamps. We can conclude that in the zone above 2000 m lower yields and fewer crop species were clear disadvantages, but were compensated by ready access to pandanus nuts, hunting and other forest resources (Bayliss-Smith 1985a: 311).
To summarise, the occasionally drought-prone Wahgi landscape was dominated by grasslands made productive through soil tillage. Its peoples were strongly dependent on bananas and yams, while intermittently they engaged in high-altitude foraging. This was the wider context for the initiation of a new phase of drainage at Kuk, known as Phase 4.
Evidence
Dating Phase 4
Phase 4 represents the onset of a new and distinctive system of wetland management, marked by the digging of new disposal channels along new lines, whose subsequent cleaning out removed potential evidence of their initial construction. As we shall see, however, indications were preserved at some places of at least two subphases of use, the earlier phase beginning between the fall of Baglaga (Y) and Kuning (Sandy 2) tephras. The chronology of these events is not very tight (Table 7.2). There are radiocarbon dates with calibrated age ranges Before Present (BP = AD 1950) on samples from above Baglaga tephra of 2110–1820 (at Ambra crater near Kuk, Sniderman, Finn and Denham 2009: Table 2, OZF144) and of 2340–1925 (at Tambul, Denham et al. 2003: Table S1, Y ash, ANU-3213) and from below Kuning tephra of 1690–1420 (Ambra crater, Sniderman, Finn and Denham 2009: Table 2, Sandy 2 OZF143). Here we adopt 2000 years ago as an approximate date for the beginning of the phase.
The close of Phase 4 is much more precisely defined in that there is no trace of this drainage phase after Olgaboli (Q) Tephra was erupted from the Long Island volcanic centre. Radiocarbon samples from Kuk and elsewhere date this event between 1230 and 970 cal. BP or AD 720 and 980 (see Table 7.2). Olgaboli ash occurs widely across the central highlands. At Kuk it is sometimes found deep in the fill of Phase 4 ditches that had only recently been abandoned, or perhaps were still functioning when it fell but were never used again. Here we use 1100 years ago as an approximate date for both the fall of Olgaboli ash and the end of Phase 4.
The geography of Phase 4
Like Phase 3, Phase 4 was not just a local event. Ditches from this period and of the same type as those at Kuk described below have been found at some other sites in the upper Wahgi, such as Kana near Minj on the valley floor (Muke and Mandui 2003: 182–183) and Draepi-Minjigina 20 km northwest of Kuk at 1885 m (Powell et al. 1975: 46; see Chapter 13, section ‘Regional processes in the upper Wahgi Valley and beyond’ and Fig. 13.11). The evidence from Tambul, at 2280 m altitude, has been noted earlier in this chapter. Phase 4 was not detected at the Manton site on Warrawau Tea Estate, admittedly in a very limited investigation.
In Southern Highlands Province, at Haeapugua near Tari, ditches were dug in marginal wetlands in the period 2500 to 2000 years ago, but the deeper-lying central swamps remained unutilised until sweet potato times (Ballard 2001: 296). The earliest linear ditch feature at Haeapugua was dated to about 2400 years and it represents the first evidence for systematic agriculture in the Tari Basin (Ballard 1995: Appendix C10, 40). Tim Denham (2003a: 343; 2005a: 347–348) suggests that the Haeapugua ditch and also some features of similar age at Kana and Warrawau correspond to late Phase 3 features at Kuk.
It would appear from this evidence that by about 2000 years ago there was widespread agricultural activity in Western Highlands and Southern Highlands Provinces, certainly at wetland sites. Pollen diagrams for the Wahgi Valley show a major expansion of grasslands at the expense of forest and forest regrowth after 1900 years ago (Haberle 2003: 155). While direct evidence is not yet forthcoming, everywhere the likely crop in wetlands was taro. In an exploratory investigation of phytoliths at Kuk, Sam Wilson (1985: 93–95) identified banana phytoliths in sediment samples from Phases 1–4, but had less success in distinguishing between sections of the genus (see Table 10.1 note 7).
The archaeological evidence from Kuk
Phase 4 ditches have been investigated in some detail using the original field records for three areas of the site (Fig. 14.2): block A9 near the southern margins of Kuk Swamp (Bayliss-Smith and Golson 1992a, 1992b); blocks A10 and A11, which are lower-lying (Bayliss-Smith and Golson 1999); and blocks C9 and D7, D8 and D9 located in the deeper swamp.
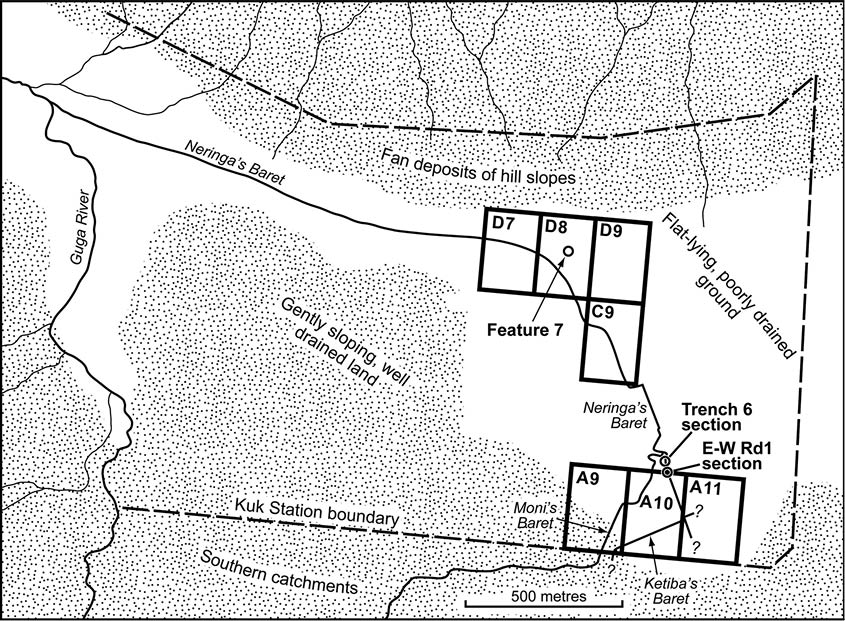
Figure 14.2 Map of Kuk Station showing the major disposal channels of Phase 4, Neringa’s Baret and Moni’s Baret, a possible minor disposal channel, feature 7 (cf. Fig. 14.7), and the Kuk Station blocks referred to in this chapter.
Block A9, blocks A10 and A11 and blocks C9, D7, D8 and D9 constitute three sample areas where an analysis of field ditch size and shape was carried out.
Source: Drawing by Philip Stickler based on field data in the Kuk archive, 1972–76.
The record from the swamp margins (A9) is the most difficult to interpret, as some Phase 4 ditches there were recut, and not always along the same line (Golson 1976: Fig. 8; Bayliss-Smith and Golson 1992a: Fig. 10; see Fig. 14.3 here). Moreover, the margins of Kuk Swamp were also subject to heavy use in Phases 5 and 6, obliterating some of the earlier evidence. A much clearer record survives in the low-lying parts of blocks A10 and A11, which have well-preserved networks of ditches with Olgaboli Tephra in their fill, indicating use of this area right up to the end of the phase. The records from the deepest swamp blocks C and D are patchier.
In the three areas where they were investigated, the Phase 4 ditches and fields are remarkably uniform in their size and shape. The field ditches are linear and meet each other at right angles, generating a distinctive grid-like pattern. Altogether this phase gives the appearance of a systematic and perhaps more specialised use of wetlands based on a well-tried technology. As discussed above, it is possible to argue for an indirect influence from incoming Austronesians, given the chronology for broadly similar forms of wetland agriculture elsewhere in the Pacific.
Whether in low-lying or more elevated sites, ditch depths and field sizes show no consistent variation, implying that hydrology and agronomy are only part of the explanation for the layout of these systems. The digging of the field ditches and their spacing seem to have been more a repetition of habit than a response to local drainage needs. Each planting area (‘plot’, ‘garden’ or ‘field’) that is defined by the grid network of ditches is of such standard design that it may reflect social norms more than functional considerations. Before discussing such interpretations, we first present the evidence, starting with the major disposal channels, followed by the minor ditches and the fields or gardens that they define.

Figure 14.3 A slot-type field ditch of Phase 4 partly recut on a different line.
The ditch runs south beneath the raised floor of House F of Phase 6, the southern part of which is intact at the top of the picture. The area in front of this has been excavated to the top of grey clay, at which level the outlines of various earlier features were clearly visible and investigated. These included the bottom half of a Phase 3 ditch in the foreground, where the Phase 4 slot ditch was subsequently dug across it. The scale across the slot ditch just in front of the unexcavated house floor is graduated at 100 mm intervals.
Source: Photograph by Murray Woods, Kuk archive, 1972.

Figure 14.4 Map of the eastern half of Kuk Station showing details of the course of Neringa’s Baret and Moni’s Baret.
The course of Neringa’s through the two right-angled turns at the junction of N–S Rd 4 and E–W Rd 2 is inferred, not demonstrated, because it appears that all traces of the Phase 4 fill along this alignment were removed when it was recut as Wai’s Baret in Phase 5 and Phase 6 times (see Fig. 15.4 and Fig. 16.3). There is no other channel in this area that could be an alternative course of Neringa’s. Inset 1 highlights the right-angled change of direction in the line of Neringa’s Baret, whose SW–NE segment we had called Ketiba’s Baret. Inset 2 does the same for the juncture of the two major Phase 4 channels into a single course, in which, a little to the north, there is a slight kink that is perpetuated in Simon’s Baret of Phases 5 and 6 (Fig. 15.4 and Fig. 16.3). Feature 7 is a possible forerunner of Korowa’s Baret, the minor disposal channel of Phases 5 and 6 that collected the waters entering the swamp from the slopes of Ep Ridge to the north (Fig. 15.4 and Fig. 16.3).
Source: Jennifer Sheehan, CartoGIS Services, College of Asia and the Pacific, ANU.
Major disposal channels
As in previous phases, a precondition for agricultural use of Kuk in Phase 4 was the successful evacuation of water away from the swamp, and on this occasion two major channels, the one called Neringa’s Baret and the other Moni’s Baret, were dug to take the water towards an outfall at the Guga River (Figs 14.2 and 14.4).
Neringa’s Baret
The alignment and fills of this major channel have been studied in detail. Initially (e.g. Bayliss-Smith and Golson 1999: 221), Neringa’s Baret was interpreted as having two tributary channels joining it at right angles in block A10 and feeding in water from the southern swamp—Ketiba’s Baret from the west and an unnamed channel from the east. We now suggest that Ketiba’s Baret was part of the main channel, which was provided with a right-angled bend and became Neringa’s. This is because it is appreciably longer than the other two ditches associated with it.
Ketiba’s was identified in the walls of the Station’s southern boundary drain emerging from the major southern catchment of Kuk Swamp, 300 m from its right-angled transformation into Neringa’s. The unnamed tributary channel that joins Neringa’s from the east was not found 100 m away in the walls of drain A11d/e (Fig. 14.4 Inset 1), close to the eastern boundary of Phase 4 activity at Kuk (see below). Finally, a proposed continuation of the line of Neringa’s Baret south beyond the right-angled bend of Ketipa’s/Neringa’s, indicated on Figures 14.2 and 14.4, was not certainly identified in the southern boundary drain, suggesting that it might have run less than 125 m beyond the Ketiba/Neringa corner (Fig. 14.4).
From the right-angled bend, Neringa’s moves northwest in a straight line across the northern end of the A blocks and into the B blocks. In the southern part of block B10, it follows a winding course then makes a short kink to the northeast (Fig. 14.4 Inset 2) before resuming a straight northwest course. From the middle of the B blocks, it is inferred that the course of Neringa’s Baret was recut in Phases 5 and 6 to form the northerly continuation of Wai’s Baret, the major disposal channel of those phases (Fig. 15.4). From the northern end of the B blocks to just into the southern end of the C blocks no traces of channel fill of Phase 4 age have been identified and it is presumed that this is because the Phase 4 fill was removed by the recuttings of Phase 5 and 6 times. Crucially, detailed inspection of the stratigraphy along drain B10a/b revealed that the two crossings of Wai’s (Fig. 15.4) were the only major channels present, i.e. there is no other channel that could be an alternative course for Neringa’s. At the junction of N–S Rd 4 and E–W Rd 2, the inferred course of Neringa’s makes two right-angled turns (Fig. 14.4; see also Fig. 15.4 Inset 2) before continuing northwest across the C blocks and northwest, then west, across the D blocks.
From the right-angled bend at Ketiba’s to its outfall at the Guga, Neringa’s Baret extends for a distance of 2.4 km. Over this distance it has a fall in level of 5.5 m, suggesting an average hydraulic gradient of just 1: 440 (Bayliss-Smith and Golson 1999: 222). This rather gentle slope implies the need for a careful grading of the base for the channel to maintain its hydraulic efficiency.
The straightness of its course and the presence of several sharp right-angled corners show that Neringa’s Baret was indisputably artificial. Its highly distinctive character may mean that it served as a land boundary of some sort as well as leading water from the southern catchment to the Guga River outfall. The right-angled corner in block A10 appears to have been aligned to avoid a low tephra-mantled hillock immediately to the northwest of it. During Phase 4 times, this hillock, although only 1–2 m high, would have been a prominent feature in an otherwise flat landscape and could have been used for purposes of orientation.

Figure 14.5 Section across Neringa’s Baret at the south wall of trench 6 in block B10e (see Fig. 14.2 for location).
The section shows two subphases of Neringa’s Baret, the earlier channel with a lens of Kuning tephra in the fill just above its base, the later and somewhat narrower channel having Olgaboli Tephra preserved at the base and the edge of its fill. Note the presence of an early and a late Phase 5 ditch in Neringa’s Baret fill as shown by the lie of Tibito ash in relation to the two bases.
Source: Drawing by Ian Agnew from a draft based on a 1974 scale drawing by Jim Rhoads in the Kuk archive.
We have evidence about Neringa’s Baret from various parts of the Kuk site. An excavation by Jim Rhoads in block A10h along the northern flank of the above-mentioned hillock revealed a minimum of two subphases of use. The earlier channel was at least 2.5 m wide and just over 1.0 m deep below the estimated level of the contemporary ground surface, while the later one was narrower, but originally almost as deep. However, by the time Olgaboli Tephra fell it had partially infilled and was only 0.6 m deep.
Evidence that Neringa’s Baret was a channel with at least two subphases was also provided by a further excavation by Rhoads in B10e (Fig. 14.5). In this case, a lens of Kuning (Sandy 2) tephra lay 0.18 m above the bottom of the earlier channel. Based on the calibrated age range, 1690–1420 BP, of the only dated surface on which this ash fell, at Ambra crater, it would be possible to argue that Neringa’s Baret was initially excavated not long before the fall of Kuning tephra. Alternatively, Neringa’s Baret may have originated earlier, with evidence of an initial cut removed when, not long before the Kuning ashfall, the channel was cleaned out and deepened. In either case, the initial excavation of Neringa’s Baret—which ushered in Phase 4—would have occurred towards the end of the period of extreme El Niño drought events between 2500 and 1700 years ago. In its later subphase, the channel looks to have been slightly narrower than the initial one. Olgaboli ash is preserved at the edge of the channel fill at a depth of 0.5 m below the estimated level of the contemporary ground surface.

Figure 14.6 Section across Neringa’s Baret at the north wall of the north drain of E–W Rd 1, showing a smooth U-shaped perimeter (see Fig. 14.2 for location).
In relation to its contemporary land surface, the channel at this point is 2.1 m wide and 1.2 m deep and has a cross-sectional area of about 2 m2. It shows no evidence of different subphases of Phase 4, presumably because the latest cleaning of the channel, which occurred not long before the fall of Olgaboli Tephra, removed any trace of them. A lens of Tibito Tephra sits on the shoulder of an intrusive ditch. When first recorded in mid-1973, the wall of the ditch was clearly drawn as cutting the ash layer. That is, the ditch was seen as a Phase 6 structure, possibly a house ditch. This date fits well with the description of the ditch fill as loose and root-penetrated, though its status as a house ditch was not confirmed.
Source: Drawing by Philip Stickler based on a draft prepared by the authors from 1973 field recordings in the Kuk archive.
The most complete cross-section of Neringa’s Baret recorded was at the point where it was crossed by the north drain of the modern E–W Rd 1 (Fig. 14.6). Here the channel has a smooth U-shaped perimeter 2.1 m wide and 1.2 m deep below the presumed contemporary surface. We estimate the channel’s cross-sectional area to be 2 m2 at this point. There is no evidence in this cross-section for different subphases of Phase 4, presumably because the latest cleaning of the channel, which occurred not long before Olgaboli Tephra fell, had removed any trace of them. In this profile Olgaboli Tephra lies up to 0.3 m above the base.
About 600 m downstream to the northwest, where traces of several major disposal channels intersect the modern E–W Rd 3, there is the remnant of an earlier channel that could have been Neringa’s Baret, most of which was subsequently reused for the digging of Wai’s Baret in Phases 5 and 6 (see cross-section E of Figs 15.2 and 15.7). Extrapolating the channel’s bank form from this remnant, a cross-sectional area of about 4.0 m2 can be estimated. On the basis of this evidence it would appear that Neringa’s Baret became a more substantial channel downstream towards the outlet.
Moni’s Baret
In contrast to Neringa’s Baret, we have very little information about this disposal channel. It is inferred to follow the alignment of Nema’s Baret (see channel 108 of Fig. 13.7) through blocks A9 and A10 to the southern end of B10 (Fig. 14.4). It is well preserved as it crosses the southern boundary drain of the station, with Olgaboli Tephra capping its fill. In the swamp to the north, however, much of the original fill has been replaced by younger material accompanied by Tibito Tephra. This may have resulted from natural scour along the line of the channel after it was abandoned, or from its reuse in Phase 5, or both. On entering block B10, Moni’s deviates from the line of Nema’s and follows a highly sinuous course to join Neringa’s at a right angle (Fig. 14.4 Inset 2). This sinuosity is hard to explain, but there is no doubt that much of the channel was artificially cut into the grey clay rather than being incised by a naturally meandering stream.
We cannot say whether Neringa’s and Moni’s Barets operated simultaneously or whether one lay abandoned while the other was in operation. The fact that Moni’s and Neringa’s Barets focus on the removal of water coming in from the south into the same segment of swamp favours the second of the two alternatives. This is particularly so in the light of the fact that only limited land was drained to the east of Neringa’s Baret in Phase 4.
Minor disposal channels
In addition to the major disposal channels, there are others of slightly smaller size. They are tributaries of the major channels but are not so deep. On the other hand, they are clearly more substantial than the widespread network of very small channels that we term field ditches. These minor disposal channels seem to occupy an intermediate position in a hierarchy that runs from the major disposal channels, Neringa’s and Moni’s Barets, to field ditches that may again have larger and smaller examples. This hierarchy of ditches has ethnographic parallels in modern drainage practices found in, for example, the Tari Basin of Southern Highlands Province (Ballard 1995: 96; cf. Chapter 5, section ‘Wetland drains’).
An example of a presumed minor disposal channel thought to be joining Neringa’s Baret from the east was recorded in block D8 in the northern part of the site (Figs 14.2 and 14.4). Called Feature 7, it was exposed in cross-section in drain D8e/f (Fig. 14.7). Its location and direction are similar to those of Korowa’s Baret of Phase 5 (Figs 15.2 and 15.4) and Phase 6 (Fig. 16.3). This runs westwards towards Wai’s Baret along the bottomlands of the swamp between the gentle upward slope of the surface to the south and its more pronounced rise to the north (see Fig. 6.8), intercepting runoff from the northeast of the swamp and from the streams that flow southwards from Ep Ridge. The presumed role of Feature 7 in the hydrology of Phase 4 would have been to remove water from the field ditches that defined gardens established along the northern margins of Kuk Swamp. It can be roughly reconstructed from a discontinuous lens of Olgaboli Tephra, 30 mm in thickness, which outlines some of the channel base as it existed at the end of Phase 4 (Fig. 14.7).

Figure 14.7 Section across a wide channel complex in the east wall of drain D8e/f, showing the outline of Feature 7 (4L), interpreted as a late Phase 4 minor disposal channel cut into the fill of the latest channel of the complex, its base marked by Olgaboli Tephra.
Traces of Olgaboli ash were also visible in the west wall partner of the feature, which is thought to have flowed westwards as a tributary of Neringa’s Baret in the northern part of Kuk Swamp (see Figs 14.2 and 14.4), in much the same way as the better known Korowa’s Baret of Phase 5 (Figs 15.2 and 15.4) and Phase 6 (Fig. 16.3). The channel complex is difficult to interpret, but the presence of Kim (R) tephra suggests that it goes back to Phase 2, unless the ash occurs in a secondary context.
Source: Drawing by Philip Stickler based on a draft prepared by the authors from 1975 field recordings in the Kuk archive.
Extrapolating from somewhat incomplete evidence, we can estimate that Feature 7 was originally about 3 m wide and 1 m deep, with about 0.1 m of infill in the final minor disposal channel at the time of the tephra fall. At this time, the disposal channel’s cross-sectional area was about 0.7 m2, which is considerably smaller than Neringa’s Baret, the major disposal channel that it joins, but an order of magnitude larger than most of the field ditches.
Field ditches: Shape and size
There is a striking difference between the size and shape of Phase 4 field ditches compared to those of the preceding Phase 3. We were able to generate a large sample of Phase 4 ditches from the systematic record of those that were positively identified in the walls of station drains, especially those with lenses of Olgaboli Tephra in their fill. Some particular examples of ditch cross-sections are shown in Figure 14.8.

Figure 14.8 Examples of Phase 4 minor field ditches in blocks A10 and A11 in cross-section.
The drawn ditches (top) range from early to late Phase 4 in age by the evidence of the lie of Olgaboli Tephra in their fills. The two ditch photographs (bottom) repeat the features of shape shown in the line drawings and reveal the character of the ash dipping over the ditch fill. The one at the left shows the west wall of drain A10f/g at its north end, the one at right shows the west wall of drain A11a/b about 80 m from the north end. The pegs were part of the process of ditch and stratigraphic record, the upper two pegs here marking the level from which the ditches could clearly be seen to have been dug and the third peg at the base. In the picture to the right, the falling level of grey clay to the north of the ditch indicates the presence of one of the runnels defining the island beds of Phase 2 (see Fig. 12.8b). The ranging poles are graduated at 200 mm intervals.
Source: Drawing by Michael Young after Bayliss-Smith and Golson (1999: Fig. 11.5) (reproduced with permission) and photographs by Jim Rhoads 1974 (left), Ron Lampert 1973 (right) from the Kuk archive.
All of the field data were corrected for width distortion using the following methods. For each field ditch an accurate cross-section was drawn using the field sketch, the field measurements (made in centimetres), data from the levelling survey and knowledge of each ditch’s direction of flow. Direction could be estimated because in most cases the same ditch could be traced in both west and east walls of the north–south Station drains, enabling the degree of obliqueness of its intersection with the drain to be assessed. Unlike in earlier phases, in Phase 4 the field ditches articulate to form grid networks, most of the ditches running either WSW–ENE or NNW–SSE. In the latter case, the intersection with Station drains was too oblique for an accurate cross-section to be attempted, but in the former case, the field measurements of width could be adjusted to produce an accurate cross-section drawn perpendicular to direction of flow. From the plans of these cross-sections, widths and depths were estimated to the nearest centimetre by direct measurement. By counting squares on the graph paper that was used for drawing the plans of the ditches, an accurate measurement could be made of their cross-sectional area (in metres squared).
This work was carried out for three sample areas of Kuk Swamp (Fig. 14.2)—block A9 near the southern margin, blocks A10 and A11, which are somewhat lower-lying, and blocks C9, D7, D8 and D9 in the deep swamp, where people might have encountered more severe drainage problems. In fact, to a remarkable degree, the differences between field ditches measured in the three sample areas were small and probably not significant. It would seem that Phase 4 ditches were dug in very much the same way in all parts of the swamp, and in the descriptions that follow we refer only to the aggregate sample.
From these data it is clear that in Phase 4, the field ditches were significantly narrower features than they had been in the previous phase. To describe ‘the typical Phase 4 ditch’, we use modal rather than mean widths because, for all measures of width, the sample does not have a normal distribution around its mean. Statistics for ‘the average Phase 4 ditch’ are distorted by the presence in the sample of some ditches that are much wider than more typical ones. Their larger size appears to be sometimes by design, because they were more important or had been recut along a slightly different line and thereby widened, but sometimes their greater width is merely because the cross-section happens to be located close to a junction where widths flare out as two ditches approach each other at right angles.
The width of ditches was measured at three points in their cross-section. Maximum width (Wmax) was measured at the top of black clay and gives a mode of 410 mm and a mean of 473 mm (Fig. 14.9). In either case, this statistic is less than half the equivalent measure for late Phase 3 ditches where Wmax averaged 905 mm. For each Phase 4 ditch, its width was also measured 10 mm above the lowest point of the base (Wbase) and 100 mm above this same point (W100mm). The mode for Wbase is 70 mm (mean 94 mm), while the mode for W100mm is 160 mm (mean 215 mm). These ditches are indeed the ‘slot-type barets’ that Golson (1976: 212) originally described, narrow gutter-like features with steep sides and rounded bases (see Fig. 14.8).
The narrower shape of Phase 4 ditches may partly result from better preservation of the original form. If taro were the principal crop of Phase 4, then the ditches would be exposed to subaerial erosion for only one crop, lasting perhaps for one year before fallowing. This short cycle of cultivation may contrast with Phase 3, when longer-term crops like bananas may have been cultivated for several years. The longer that drained fields are subject to erosion and human activities, the more likely that their edges will become blurred, perhaps contributing to the wider forms that we see both in Phase 3 and, subsequently, in Phase 5 (see Fig. 15.14).
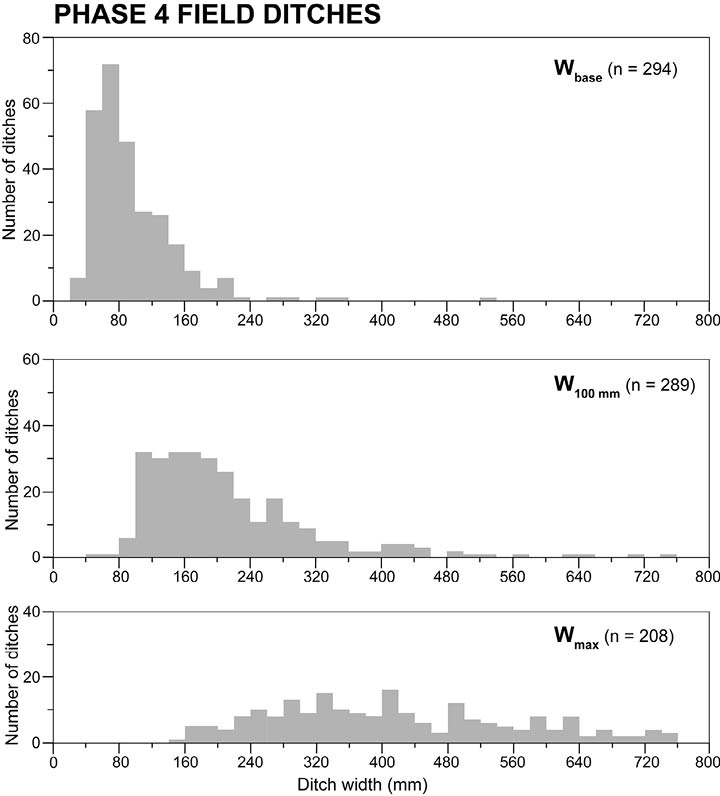
Figure 14.9 Bar charts showing the widths of Phase 4 field ditches.
Wbase is measured 10 mm above the lowest point of the base; W100mm is measured 100 mm above the base; and Wmax is measured at the top of the black clay level.
Source: Drawing by David Williams based on measurements and calculations by Tim Bayliss-Smith.
Ditches in Phase 4 were also shallower than they had been in late Phase 3 (Fig. 14.10). Maximum depth (Dmax) was defined as depth below the top of black clay and the modal depth is 350 mm (mean 351 mm) compared to a mean of 528 mm in the previous phase. The shallowness suggests a limited capacity to lower the water tables in adjacent fields, but also a limited need to do so if taro was the crop (see Fig. 11.11).
For ditches where all dimensions were preserved and recorded, we can also estimate the cross-sectional area of the channel from the top of the black clay level down to the base. As a result of the variations in width discussed above, cross-sectional area differs somewhat, but the great majority of ditches are less than 0.2 m² and the modal size category is 0.08–0.10 m² (see Fig. 14.10).
We can summarise by saying that the small field ditches that define the Phase 4 planting beds are remarkably uniform in size and shape. They are mostly linear, gutter-like features, deeper than they are wide and crossing each other at right angles (Fig. 14.11). Most have steeply sloping sides and rounded bases and their shape would suggest that a heavy digging stick was used to produce them (Figs 14.3 and 14.8). As we discuss below, these ditches form grid-like networks defining rectangular planting surfaces that we could call beds, gardens or fields.
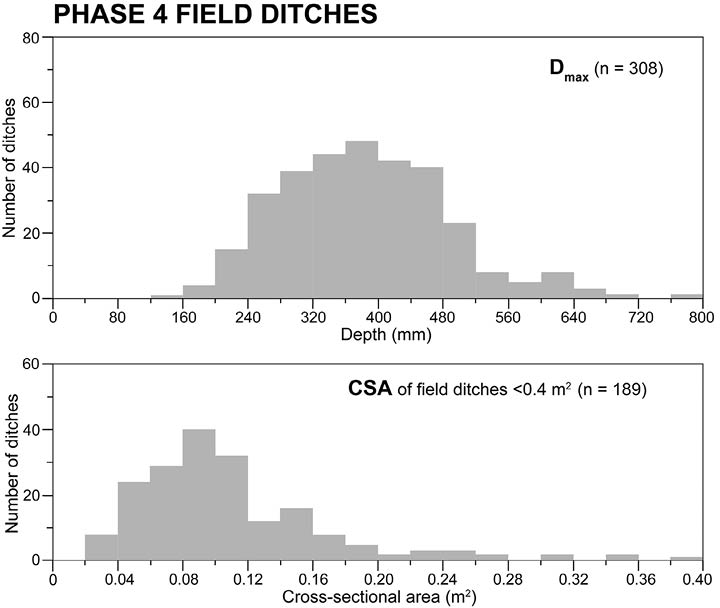
Figure 14.10 Bar charts showing the maximum depth (Dmax) and cross-sectional area (CSA) of Phase 4 field ditches.
Dmax is measured as depth below the top of black clay. CSA is the channel’s cross-sectional area below the same level.
Source: Drawing by David Williams based on measurements and calculations by Tim Bayliss-Smith.

Figure 14.11 Two views of the same slot ditches exposed beneath Phase 6 houses and cut through by the deep perimeter ditches of these: left, looking west and right, looking south.
The houses are B and C of the cluster at the north end of blocks A9g and A9h (see Fig. 16.3 Inset and Figs 17. 1 and 17.5) and the raised floor of House C has been partly removed to show the southerly continuation of the ditches first seen on the strip of ground between it and House B. Even so, it is difficult to interpret the pattern that emerges, though we presume that we are dealing primarily with Phase 4 field ditches by their shape and the presence of Olgaboli Tephra, though possibly not all of the same age within Phase 4. The ranging pole in both pictures is graduated at 200 mm intervals.
Source: Photographs by Ron Lampert, Kuk archive, 1972.
The field ditches articulate with larger disposal channels. We can establish the relationship between the disposal channels and the field ditches by looking at levels in block A10. Here Neringa’s Baret, the major disposal channel, was excavated to a depth of 300 mm below the bases of the field ditches and at least 700 mm below the surfaces that were being cultivated at the time of Olgaboli Tephra. These differences in level suggest that Phase 4 was organised around a hierarchy of ditch sizes, varying in depth and importance according to their functional roles.
The depth of field ditches is not related to the local ground elevation. For example, in blocks A10 and A11, the depths of individual ditches range from 200 to 650 mm below the level of black clay, while the level of the ground surface into which they are dug varies by more than a metre across these two blocks. For a sample of 104 ditches that were measured, there was no statistical relationship between ditch depth and the elevation of the ground surface into which they were dug (Bayliss-Smith and Golson 1999: Fig.11.7). This lack of correlation is true also when we compare ditches at the swamp margins (A blocks) with those in deeper areas of the swamp (C and D blocks). These findings seem to indicate that in Phase 4, ditch depth was not affected by local swamp elevation, perhaps because the whole of Kuk Swamp was relatively dry when the ditches were dug so that low-lying areas were not in any need of deeper drainage. Perhaps the large investment in digging deep disposal channels was so effective that all parts of the swamp, high and low, were equally well drained. An alternative possibility is that field ditches were more important as markers of field boundaries than as drainage features. Perhaps their rationale was more social than hydraulic.
Fields and fallows
These minor ditches define small gardens or fields that can be reconstructed from their exposures in the walls of the north–south drains of the Station (Fig. 14.12). The fields average about 13.5 m by 9 m and are highly standardised in size and shape. As with ditch depths, we do not find that fields in low-lying areas are any different in their dimensions from those around the swamp margins, which suggests that the ‘design’ of the system was in relation to social norms rather than hydraulic requirements.
Not all of Kuk Swamp was used during Phase 4. We estimate that about 75 hectares of the 125 ha total area of archaeological investigation show at least one episode of Phase 4 drainage. The area that was never used in Phase 4 is in the eastern part of the site, on land remote from the northwest-flowing Neringa’s Baret (Figs 14.2 and 14.4). Although the intensity of our drain digging and the detail of its archaeological record decreased eastwards and especially northeastwards across the site, we established through inspection of drain walls that there was no Phase 4 ditching in block A12, little in the eastern half of block A11 and none in at least the eastern three-quarters of block B12, whereas, closer to the line of Neringa’s Baret, there was good Phase 4 evidence in the western half of block B11. While, with a single exception, we dug no drains in blocks C and D10–12, drains in blocks C9 and D7–9 to the west did show evidence of Phase 4 ditching.
The single exception referred to above, drain C12e/f, towards the eastern boundary of the Station (Fig. 14.4), deserves individual comment. Roughly halfway south along the drain from E–W Rd 3 we found what the fieldbook describes as ‘a most surprising appearance’ of a Phase 4 field ditch, oriented WSW–ENE, with substantial Olgaboli Tephra in its fill. It is slightly larger than the average for Phase 4 field ditches found in other parts of Kuk Swamp. Whether it signals the start of a new area of drainage activity to the east is unknown for lack of any other evidence.

Figure 14.12 Evidence (left panel) for the intersection of Phase 4 field ditches with the Station drains in blocks A10h and A11a; and reconstruction (right panel) of the layout of these field ditches in the same area. The reconstruction also shows the major disposal channel, Neringa’s Baret, with its SW–NE segment, Ketiba’s Baret.
Source: Drawing by Michael Young after Bayliss-Smith and Golson (1999: Fig. 11.4), reproduced with permission.
It would also seem that not all Phase 4 field systems were in simultaneous use, as demonstrated by the position of Olgaboli Tephra in the infill of many of the field ditches. Tephra occurs in some places near to the base of the features, but in others it lies close to the contemporary land surface (for examples see Fig. 14.8). This disparity suggests we should envisage Phase 4 as a kind of shifting cultivation system, with the land made usable by the major disposal channels being in reality a mosaic of productive gardens and fallow plots.

Figure 14.13 A grid of taro gardens at 2125 m altitude on swampy land by the Kaugel River at Kiripia near Tambul, some 45 km SW of Kuk.
Source: Photograph by Tim Bayliss-Smith, 1980.
More important than fertility loss, drained soils under taro cultivation quickly become infested with Papuana beetles, which severely damage the crops and can only effectively be dealt with by allowing gardens to go into swamp fallow, as discussed above. This cycle of drained garden followed by swamp fallow represents modern practice in the upper Kaugel wetlands near Tambul, 40–50 km southwest of Kuk and 2100–2200 m above sea level (see Fig. 14.13). In the Kaugel Valley, only if a period of reuse occurs within about 20 years of abandonment is it possible for the cultivator to relocate the former ditches because of their soft fill and so exhume the former drainage network. A cycle of wetland drainage and fallow is also suggested by Robinson (1999: 55), who found at Bitsamu in the Kopiago Basin (1320 m) that disused ditches faintly visible on 1967 air photographs could no longer be seen in 1995 at ground level. In this case, completely new ditches had to be dug. Reuse of former lines of drainage makes the task of reclaiming land for a new garden easier than if a completely new network has to be made.
Artefacts
None of the wooden tool types associated with agriculture in the ethnographic record of the upper Wahgi (see Chapter 19) were found preserved in the swamp gardens of Phase 4 at Kuk. This is likely to have been because the subsequent drainage works of Phases 5 and 6 disrupted the waterlogging that would have ensured their survival. However, an example of a woman’s light digging stick was found at Draepi-Minjigina in a Phase 4 ditch sealed in by Olgaboli ash (Golson and Steensberg 1985: 376) and we have already said that the gutter-like character of the Phase 4 field ditches suggests that they were made with the men’s heavy digging stick. The so-called hastate spade of Phase 3 age found at Tambul (see Fig. 13.12) shows that paddle-bladed implements were likely to have been in use for trenching and ditching in Phase 4 at Kuk, as they definitely were in Phases 5 and 6 (see Chapter 19, sections ‘Long-handled paddle implements’ and ‘Shorter paddle tools’).
Stone axes would have been used for clearing trees, if trees were present, and for chopping grass stems. Axel Steensberg (1980: 53–59) has reviewed the tools and practices employed by highlanders to deal with the grassland sod when establishing gardens on dryland or drained swamp, including demonstrations of swamp grass clearance that were organised at Kuk (see Chapter 19, section ‘Digging sticks and tools of clearance’).
Interpretation
Labour and yields in Phase 4
Phase 4 in the wetlands appears to be a specialised and relatively intensive production system and it presumably had a dryland counterpart, although evidence for landuse outside the wetlands is always difficult to find. Our guess is that wetland taro production was a supplement to dryland yams and bananas, cultivated by means of tillage of grassland soils, and with some limited hunting and foraging.
A possible ethnographic parallel to the Phase 4 system at Kuk was provided in 1980 by the taro fields at Baisu Corrective Institution, 4 km east of Kuk, discussed above. Measurements by Bayliss-Smith (1985a: 310, Table 5) of the yield of harvested taro and the input of labour required showed that about 3300 hours of work were needed per hectare of cultivated wetland. This work was rewarded by an annual yield ranging from 14 to 25 tonnes per hectare of taro corms, the average being 21 tonnes. This yield is comparable to that recorded at Kuk Station for taro grown in 1980–81 in plots protected from Papuana beetle damage, which averaged 18 t/ha/yr. Both yield figures are much higher than that recorded for unprotected plots at Kuk, and also higher than the yield reported by Clarke (1977: 160, 163, Table 1) for taro grown in dryland sites near Mount Hagen. Here soil deficiencies and beetle damage reduced yields to 4.4–5.3 tonnes per hectare on ‘good’ sites under tall grass and, unsurprisingly, less on poorer ones.
Adjusting the Baisu figures to take account of the differences in efficiency between steel and wooden spades, a total of 4000 hours per hectare for the Phase 4 system can be estimated. These figures can be compared with modern taro swiddens elsewhere in the highlands. The comparison indicates that between three and four times more labour is needed for drained cultivation of grassy swamps than for shifting cultivation in forests, but in return the food yields are about doubled (Bayliss-Smith and Golson 1992b: 19–20).
All these findings suggest an intensive use of labour in Phase 4 that was compensated by high returns. Unfortunately, we cannot compare wetland taro with any reconstructed landuse system for dryland sites centred on the cultivation of yams and bananas. Today, unlike the sweet potato, these crops are little grown in deforested valleys like the Wahgi, so that data on their productivity are lacking. Nor can we be certain about the gendered division of labour. Ethnographic analogies would suggest that the major disposal channels would have been men’s work, while other tasks might have been shared. In the Kaugel Valley today, making small field ditches with digging sticks is women’s work, but larger ditches are dug by men. In the Wahgi, the ethnographic evidence suggests that ditching was always men’s work. Everywhere, highlands ethnography emphasises the primary role of women in planting, weeding and harvesting.
Digging the major disposal channels
In addition to the labour costs of field ditching and cultivation, we must consider also the major disposal channels. Calculations show that initiating these channels would have required quite a substantial investment of labour (see Chapter 5, section ‘Social contexts for wetland drainage’). As we have noted, Neringa’s Baret covered 2.4 km from its right-angled bend in the A blocks northwest to its Guga outfall. If we assume its cross-sectional area averaged 2 m2, then each kilometre of length would have required the digging out of about 2000 m3 of saturated peat and clay.
We estimate, using ethnographic and experimental data from a range of sites and adjusting for the use of wooden spades and digging sticks, that productivity levels for men would have been about 0.5 m3 per hour, over a working day of perhaps five hours. Each kilometre of major disposal channel therefore required about 800 man-days of digging, which represents about 2 months of work for a gang of 16 men. To dig the whole of Neringa’s Baret working six days per week would thus have required an investment of about five months’ work by these 16 men (correcting the original estimates of Bayliss-Smith and Golson 1999: 222).
These figures have implications both for leadership and social organisation. As John Burton (1984: 88) has remarked in relation to stone-axe quarrying at nearby Tuman, ‘non-ranked, non-hierarchical societies can organise themselves for large-scale productive ventures when a range of conditions are met’. These conditions include peaceful relations with neighbouring groups; ideologies of male solidarity and female support; and enough men who can remember the skills previously acquired so as to ensure technical success. Like the equivalent disposal channels of Phase 3 and perhaps earlier phases, we conclude that the scale of Neringa’s Baret signals that it was an important community project in Phase 4. It should therefore be seen as a form of ‘landesque capital’ and it was through this capital formation that Kuk Swamp became an enhanced landscape for future agricultural production.
Implications for surplus production
It also becomes possible to estimate, using the Baisu data, the potential for surplus production from the Phase 4 wetlands (Bayliss-Smith and Golson 1992a: 13–17). An average annual taro yield of 21 tonnes per hectare gross would generate enough food energy to support a total population at Kuk of either 162, 240 or 480 people, depending on the assumed level of dependence on the production from wetlands (75 per cent, 50 per cent and 25 per cent respectively). These calculations use a conservative estimate of the proportion of wetland area in use at any one time, based on a 1: 19 ratio of years of cultivation to years of swamp fallow. The model also assumes that 75 ha of swamp was under this cycle of intermittent use at Kuk, based on the portion of the archaeological site of 125 ha that shows evidence of use in Phase 4 (see Bayliss-Smith and Golson 1992a: 13–17 for the detail of the calculations).
The above population estimates relate to a situation with no pigs (see Chapter 15, section ‘Artefacts, houses and pigs’). If, however, the pig had arrived in the highlands by this time and the Kuk community of Phase 4 fed a portion of its taro surplus to maintain domestic pigs, then the human carrying capacity is somewhat diminished. However, in such a case the incentives for wetland drainage would become clearer, because pigs can be used as valuable exchange items to generate wealth and prestige, as exemplifed in the sweet potato economy of recent times. In the deforested landscapes of the Wahgi Valley floor, hunting and foraging would have become unrewarding, giving added value to any domesticated sources of fat and protein in the diet.
Whatever the scenario, it is clear that Phase 4 had a significant potential to support a larger population than the preexisting dryland system within the degraded grassland landscape of the Wahgi Valley floor (although our lack of precise knowledge of the dryland sphere must always be remembered). Phase 4 also had potential for wealth generation and hence to be an engine for social change, with or without the presence of pigs as a medium of exchange.
The social organisation of Phase 4
Direct evidence for Phase 4 societies is lacking, but we can make some progress by considering the societal implications of the Phase 4 system. There was, firstly, the intensification of labour use that wetland landuse demanded and, secondly, the boost to food energy production that it had the potential to provide. In relation to labour intensity, we have already indicated the heavy work inputs needed for cultivating wetland taro. At the beginning there would be need for a group of workers, probably men, organised to plan and dig the major disposal channels. This initial investment would be followed by more individual and incremental efforts by both men and women, digging the field ditches, tilling the soil, planting crops, weeding and harvesting. In the upper Kaugel Valley today, the sod is broken and turned by the men with heavy digging sticks and the resultant clods are pulverised by the women. Perhaps the field ditches would have been men’s work, again with the use of heavy digging sticks, while some of the lighter tasks were women’s responsibility.
Early interpretations focused on the likely role of population pressure in persuading people to intensify their agriculture through wetland drainage (Golson 1977a), but subsequently the positive role of incentives was emphasised (Golson 1982: 135). It was Modjeska (1977) who first pointed out that the surplus of root crops (we assume taro) that was gained by cultivating drained soils must have constituted a resource that could be used for status enhancement through exchange, whether or not pig husbandry was implicated in this process.
Kuk as a Phase 4 ‘hotspot’?
Arguments like these persuaded Modjeska (1977: 85–89) to suggest the Wahgi wetlands were what we might call a ‘hotspot’ of social change in the highlands, with privileged access to sites suitable for the intensification of food supplies. Modjeska envisaged the emergence of sedentary communities of up to 600 people living adjacent to their wetland cultivations, with the potential for both conflict and exchange with neighbouring groups, including the swidden cultivators of the valley slopes. Applying this model to the Kuk situation, we might see Phase 4 as allowing the early development of a distinctive social structure, including the systems of big-man leadership and the gendered division of labour that were so characteristic of the sedentary agrarian societies of the highlands in the 20th century.
Intensive cultivation today in the highlands is also driven by aspirations for wealth and enhanced status. For example, the high cash price that consumers will pay for root crops is frequently a motive for valley floor drainage projects. One example is the drainage system at Kiripia (2125 m altitude) in the upper Kaugel Valley, designed for taro production and mapped in 1980 (Bayliss-Smith 1985a: 295; Fig. 14.13). The landscape of drainage for taro at Kiripia certainly resembles closely the field systems that we can reconstruct for Phase 4 at Kuk (Fig. 14.12), apart from the tighter grid of field ditches at Kiripia, an adjustment perhaps to the cooler and damper environment of the upper Kaugel Valley. In addition, however, the underlying motives of the people who drain the wetlands at Kiripia may also constitute a parallel case to Kuk.
For an archaeological test of the ‘hotspot’ model, we need to look for evidence of regional exchange. We need to demonstrate that there was an expansion of exchange systems centred on the Wahgi. We also need to show that this expansion was occurring at the same time as the landuse intensification signalled by Phase 4 drainage because it was fuelled by the surplus taro production that drainage generated. Unfortunately, most ‘trade’ items of that period would have been perishable and so unlikely to survive as evidence: meat, plumes, furs, artefacts of wood or fibre, salt. However, the lithic evidence—polished stone or the raw materials for stone axe production—is a rare exception and it provides us with an opportunity to test the ‘hotspot’ hypothesis (Golson and Gardner 1990: 405–407).
At European contact in the 1930s, the Tuman quarries of the middle Wahgi and others in the Jimi Valley north of the Sepik-Wahgi Divide were prime sources of high-grade stone in the central highlands. The full story is told in Chapter 21, section ‘The age of the axe trade in the upper Wahgi’, but the implications of the issues of Phase 4, in the upper Wahgi, are set out here. John Burton has graphed the occurrence of polished axe stone at two of Christensen’s Manim Valley rockshelters, Kamapuk and Etpiti, to show the entry of material from these modern quarries, in their case predominantly the Tuman source, into the archaeological record and its steady rise to almost complete dominance in the two assemblages (Burton 1984: 227–228, Table 10.8, Fig. 10.15; cf. Burton 1989: 256). Unfortunately, chronology is provided by only two radiocarbon dates, one at each site, and is thus not as tight as could be wished.
Quarried axestone made an appearance in level 8 at Kamapuk, the level below that with the first pandanus nuts at the site and a radiocarbon date (ANU-1326) calibrating to an age range of 2750–2350 BP. At Etpiti the first quarried stone was also found immediately below a radiocarbon-dated level, level 7, with a calibrated age range of 1350–1050 BP (ANU-1324; for both sets of calibrations consult Table 10.2 and see note 4 below it). At both sites the quarry stone joined other stone types sporadically present from the beginnings of site utilisation. Also at both sites fragments of quarry stone were found that were large enough to be recognisable as belonging to planilateral axes (Burton 1984: 228) of the sort well known in the upper Wahgi at the time of European contact. The earliest of these at Etpiti was in the radiocarbon-dated level 7 and at Kamapuk in level 4.
As Burton admits (1984: 228), the trend he has identified, signalling the development of large-scale axe-stone quarrying to serve regional exchange systems and not just local demand, needs confirmation at other stratified sites. However, despite its chronological looseness, the evidence suggests a beginning for this development that matches quite well the dates for Phase 4. This intriguing observation supports the idea that wetland drainage at Kuk needs to be viewed in the context of wealth generation, not subsistence crisis.
A role for big-man leaders
Social structure in prehistory is notoriously difficult to reconstruct, and in the Phase 4 case we have not much basis for speculation beyond the organisational requirements of the drainage itself and ethnographic analogy. As already discussed, the Phase 4 major disposal channels are quite substantial investments. Digging Neringa’s Baret, we estimate, would have required the sustained efforts of a gang of 16 men over a period of about five months. Had it been a part-time project, it would of course have taken longer. To maintain the enthusiasm and solidarity of such a group, and to release so many men from other tasks, it seems likely that some form of authority and charisma would need to be exerted, by the kind of leader we might compare to the big-man of modern times.
Ethnographic accounts of the initiation of major channels are lacking, but in the Baliem Valley in the 1960s the cleaning out of an already existing channel was done by a cooperative work party (Heider 1970: 40).
Some men stand in the ditches, up to their waist in water and mud, cutting into the mud with the broad-bladed digging sticks and heaving it onto the banks with their hands; other men or women on the banks then spread this mud out evenly with their feet.
Heider goes on to talk about the reopening of old gardens in no-man’s-land on the swampy valley floor after peace was restored by the government in 1961 (1970: 42). Just as warfare in the Wahgi today can lead to the abandonment of agriculture in disputed areas, so in the Baliem the breakdown of political alliances can have the same effect. Episodes of swamp drainage can therefore reflect the vicissitudes of local politics rather than being a response to regional economic or ecological problems.
In the relatively egalitarian societies that today characterise the New Guinea highlands, organising a cooperative project is a delicate and sometimes fragile enterprise. The exhortations of big-men are easily ignored and opportunities for genuine coercion are few. Both men and women can withhold their labour unless convinced of the collective benefits of what might otherwise be construed as a boost to the status of just one individual, the big-man himself. Perhaps wetland drainage was also subject to these various vicissitudes, dependent as it was on collective labour for the initiation and then the maintenance of the major disposal channels. Moreover, success in large-scale drainage may depend on peace and the maintenance of regional alliances, which may break down.
The vulnerability of the cooperative enterprise to breakdown, because of warfare and the relatively weak position of big-man leaders, is a factor that might help to explain the complete abandonment of Phase 4 after the fall of Olgaboli Tephra from the sky about 1100 years ago. We can only speculate about the effect of such an extraordinary event on local alliances, exchange networks and the bonds between leaders and followers, but one obvious effect—the short-term fertility boost of tephra to soils and agriculture in the dryland sphere—may have been enough in itself to inhibit wetland cooperation for a generation or more.
Dryland agriculture after Phase 4
The initial effects of a tephra fall are damaging to crops and food shortages or famine are likely to ensue (see Chapter 8 for a review of the effects of a tephra fall on plants, animals, buildings and health). However, the longer-term effects are more positive. In several oral histories that recount the Time of Darkness, in other words the fall of Tibito Tephra, possibly in the AD 1660s, informants indicated the beneficial effects. In Enga, for example, ‘[t]o everyone’s surprise the plants grew at a great rate and gave unheard-of yields of food’ (Blong 1982: 119). This effect of a boost to soil fertility has been noted in various volcanic eruptions around the world (Blong 1982: 169). At Kuk, the improved productivity of dryland agriculture may have mitigated the damage to wetland gardens caused by the fall of Olgaboli Tephra (but see Chapter 8, sections ‘Longer-term impacts’ and ‘Soil replenishment’).
The sustainability of dryland agriculture may have been boosted further by the innovation of tree fallowing, specifically the planting of Casuarina, for which Golson (1977a: 624–625) noted a marked rise in importance in the pollen record after the fall of Olgaboli Tephra and the end of Phase 4 drainage at Kuk. In a later detailed review of the evidence, Haberle (1998a: 8) shows this change to be synchronous in all sites in the upper Wahgi Valley and some 300–400 years later in the Kainantu region of Eastern Highlands Province.
The deliberate planting of Casuarina oligodon and the protection of seedlings of this and other fast-growing trees like Trema and Dodonaea are widely reported in the highlands (Golson and Gardner 1990: 399). The practice may have started because of the need to provide handy supplies of timber for firewood, fencing and building in circumstances of deforestation. However, the ability of these trees, particularly Casuarina as a nitrogen-fixing legume, to restore fertility in otherwise treeless landscapes would have recommended their use in fallowing. Citing Bourke (1997) on the danger of emphasising fallowing rather than timber production as the reason for tree planting, Haberle (1998a: 10) admits that it is impossible to discriminate between the two motives in the pollen record. In a subsequent publication, Bourke and Allen (2009: 246) report that planting Casuarina oligodon in fallows is most important in central Simbu Province, in adjacent parts of Eastern Highlands Province, in the Simbai and Kaironk areas of Madang Province and in the Oksapmin district of Sandaun Province, but is not a practice in the three other highlands provinces, Western Highlands, Southern Highlands and Enga, where it is found around the edges of fields, around houses and in small plantations. Whatever the reasons behind it, Casuarina’s increased presence in the pollen diagrams after around 1100 years ago is good evidence for advanced deforestation.
We can therefore envisage various alternative scenarios for the end of Phase 4 at Kuk. One model would emphasise the fragility of intragroup social structures in the Wahgi Valley, with group cooperation successfully mobilised for drainage projects under big-man leadership, but with these arrangements easily undermined by individualism reasserting itself. A second model would emphasise fragile intergroup politics, with drainage outfalls easily disrupted by warfare or the breakdown of alliances, especially after a traumatic event such as the fall of Olgaboli Tephra. A third model would emphasise, instead, new projects within the dryland sphere, projects that eventually proved more attractive to both individuals and leaders after the boost to dryland agriculture provided by the fall of Olgaboli Tephra, especially if followed by the initiation of Casuarina woody fallows. For whatever combination of reasons, after the ashfall 1100 years ago, the Wahgi wetlands were not brought back into use and drainage efforts lapsed for more than three centuries.
Conclusion
Draining the Wahgi swamps was a daunting task in Phase 4, not so much because of the heavy labour demands of wetland cultivation (the dryland sphere may also have been problematic in its low yields and heavy requirements for soil tillage), but more because of the difficult initial investments required in planning and digging the disposal channels. To enable collective enterprises of this kind to go ahead, political arrangements at the regional scale needed to be favourable, in particular secure alliances with neighbours to protect vulnerable drainage outfalls. At a local level, too, however strong a big-man might have been, his leadership was short-term and individualism was easily reasserted.
We can therefore see the drained wetlands of Phase 4 as a rather fragile social landscape, vulnerable to the breakdown of the necessary political conditions. In our view, drainage is more an expression of cooperation and male solidarity under big-man leadership than the result of separate households responding in isolation to a subsistence crisis. We should also stress the positive advantages that wetlands offered, as insurance against the uncertain yields from dryland agriculture vulnerable to El Niño drought and to declining soil fertility, as well as a means towards surplus production, intensified exchange between groups and status enhancement for embryo big-men. The archaeological evidence currently available could support any or all of these scenarios and a more certain explanation for Phase 4 at Kuk will need more data from further fieldwork and laboratory studies.
1 This is because of the inability of linguists to reconstruct a word for Dioscorea esculenta in Proto-Oceanic, the language thought to be associated with the Austronesian-speaking migrants who initiated the Lapita culture. See also Chapter 4, footnote 4 and Chapter 10, footnote 1.
2 ANU-1370, 2380±110 (Christensen 1975: Table 1), is not included in Table 10.2, but is calibrated in the same way as the radiocarbon dates in that table; see Table 10.2, note 4.
Previous Next