


 menu
China's New Sources of Economic Growth: Vol. 2
8. China’s Transition to a More Innovative Economy: Progress and Challenges
Shang-Jin Wei, Zhuan Xie and Xiaobo Zhang1
Introduction
After more than three decades of high growth based on the exploitation of low-wage and demographic advantages interacted with incremental market-oriented reforms and international openness, China now confronts higher wages and a shrinking workforce. Future growth will therefore depend increasingly on innovation and increased productivity. We assess the likelihood of China making this transition, using matched firm-level data on patent applications, receipts and citations and a survey of manufacturing firms. We find that embracing new international opportunities and adaptation to rising labour costs are two leading factors in China’s increasingly innovative economy. As a result, Chinese exports are increasing in quality; and the market share of Chinese exports relative to other countries has increased steadily, even after controlling the unit value. We also find, however, evidence of resource misallocation in the innovation area: state-owned firms receive a greater share of innovation subsidies, but private firms are the more successful innovators. The transition to an innovation-led economy would presumably progress even faster if this resource misallocation could be tackled.
Over the period 1980–2015, China’s economy grew at an average annual rate of 8.7 per cent, increasing real per capita income by a cumulative rate of 1,759 per cent, or from $714 in 1980 (in 2011 international purchasing power parity (PPP) dollars) to $13,277 in 2015 (based on the International Monetary Fund’s World Economic Outlook (WEO) data). Only one other economy, Equatorial Guinea, grew by as much over the same period.
For 25 consecutive years from 1990, China’s economy grew at more than 6 per cent a year. No other country has grown at that uninterrupted rate for even 20 years since 1980 (the starting year of the WEO database), let alone one-quarter of a century. Over the same period, a very short list of economies did grow at or better than that rate for some 10–20 years, but these were not consecutive. Those economies are Ethiopia (17 years); Equatorial Guinea and the Republic of Korea (16 years each); Albania and Turkmenistan (15 years); Armenia (14 years); Maldives and Myanmar (13 years); Georgia, Chinese Taipei and Thailand (all 12 years); Estonia, Latvia and Lithuania (11 years); and Argentina, Azerbaijan, Belarus, Bhutan, Botswana, Iraq, Moldova, Seychelles, Singapore, Sri Lanka, Uzbekistan and Vietnam (10 years). China’s growth performance is spectacular and exceptional.
That exceptional growth was based fundamentally on a combination of low wages and a favourable demographic structure, the potential of which was converted into actual growth through a sequence of domestic market-oriented institutional reforms and greater openness to trade and foreign investment. That, in turn, supported a catch-up process in the direction of the high-income economic frontier (see, for example, Fan et al. 2014). When China began its process of reform and opening up in 1980, its per capita income of $714 ranked it 136 of the 138 economies with sufficient data to be included in the WEO database. Even in 2001, the year China acceded to the World Trade Organization (WTO), and after a long period of sustained growth, per capita income was still lower than in 77 other countries. Throughout the period 1980–2011, the Chinese working-age cohort as a share of the total population was unusually high, partly due to rapid fertility declines associated with strict family planning policies brought in around 1980. Relatively low wages, a large workforce and a favourable dependency ratio formed a powerful combination of fundamentals for economic development. Since 2000, accession to the WTO and an imbalanced gender ratio in the premarital-age cohort have inspired additional entrepreneurship and work effort, which have added perhaps 2 percentage points to the growth rate (Wei and Zhang 2011b).
Since 2011, however, the working-age cohort (aged 15–60) has started to shrink in absolute size (due in part to the family planning policies of the previous three decades). By 2015, China’s income had reached $13,277 (in 2011 international PPP dollars), but the average wage rate in current US dollar terms was higher than that of most economies outside the Organisation for Economic Co-operation and Development (OECD). China’s economy has now reached another crossroad. The importance of these structural shifts helps explain the slowdown in the growth rate of between 6 per cent and 7 per cent since 2014, which will likely moderate further even though the economy is otherwise also affected by a cyclical downturn (e.g. a relatively weak global economy).
A country’s potential growth comes from the sum of the growth of its workforce and the growth of its labour productivity. The Chinese workforce has been shrinking since 2011 (Cai and Wang 2008). Policy changes to extend the official retirement age or to encourage more female labour force participation will at best moderate the decline in the workforce. The relaxation of the one-child policy in November 2015 will, over the next decade and a half, make the dependency ratio worse, without altering the size of the workforce (no couple can give birth to a 16-year-old) (Wei 2015).
Both the Chinese Government and scholars often refer to the challenges facing China in the context of a possible ‘middle-income trap’ (among many others, see OECD 2013; Ma 2016). The ‘middle-income trap hypothesis’ (MITH) claims that only in exceptional cases can a middle-income country ever manage to become a high-income economy thanks to the fact that these economies face a uniquely challenging growth environment. Contrary to the popular hypothesis, however, using a transition matrix analysis and a non-parametric analysis (by regression trees), Han and Wei (2015) are unable to support an unconditional MITH, but they do identify conditions under which growth may be more likely to stagnate or even regress.
Given such factors, growth in labour productivity must become an important driver of overall economic growth. In 2015, China’s investment to gross domestic product (GDP) ratio, at 43.3 per cent, was already high by international standards, making it doubtful continued physical investment would deliver a higher rate of labour productivity growth. Moreover, Bai and Zhang (2014) estimated that returns to investment have in fact shown signs of decline since 2008. Increased productivity could, however, come from reducing resource misallocation (Hsieh and Klenow 2009), including via further reforms to factor and product markets such as reform of state-owned enterprises (SOEs). This area of potential productivity gains is, however, also limited. The pace of future reform is unlikely to be as aggressive as in the past, partly because many of the low-hanging fruits have already been picked and partly because society (read: interest groups) now has greater means to block reforms than in earlier decades. An additional potential source of productivity gains is the discovery of new products, new uses for existing products, new designs and production processes and the conversion of these innovations into new sales or cost reductions.
In this chapter, we study whether China can transition to a more innovation-driven growth model. Specifically, we study three questions. First, how much growth in innovation is actually occurring in Chinese firms? We approach this question from a comparative perspective and ask how China’s rate of innovation compares with that in Brazil, Russia, India and South Africa (the BRICS economies) and also with South Korea. India has a lower per capita income than China but is comparable in population size, and, like China, it has a diaspora with a strong presence in science and technology, academic and elite chief executive officer (CEO) communities in the United States. Brazil, Russia and South Korea all have higher income per capita than China. South Korea, in particular, has experienced a growth miracle that leads China by about 25 years. Its industry includes a string of successful and innovative companies, such as Samsung and LG, and, in many ways, it presents a model that China wishes to emulate.
We draw comparison between China and the selected countries using data on patent applications by and patents granted to firms both at home and in the United States as a proxy for innovative activities. Patent data are sourced from the State Intellectual Property Office of China (SIPO), the US Patent and Trademark Office (USPTO) and the World Intellectual Property Organization (WIPO). We find evidence that China’s performance on innovative activities—as measured by the pace of patent applications, patents granted and citations of patents—has been strong, particularly recently.
Second, we explore what accounts for the relatively rapid pace of innovation by Chinese firms as measured by patent applications. In particular, we explore whether this derives from China granting patents using a threshold lower than international standards, government subsidies for research and development (R&D) activities or disproportionate innovations by state-owned firms that have privileged access to resources. Or do Chinese firms embrace the challenge of rising wage costs and embark on innovation to adjust to the evolving comparative advantage?
China’s accession to the WTO created greater market access for its exports, enabling export firms to better recover the cost of R&D investment, stimulating their innovative activities. We use export data to investigate whether Chinese firms have converted innovation into quality improvement and increased export market shares even in the face of progressively rising labour costs, including in comparison with competitor economies. We report evidence that the market share of Chinese exports does generally increase, even after controlling for the unit cost of its exports relative to those of its competitors. Facing rising labour costs, labour-intensive or routine-intensive firms have recently become increasingly innovative compared with capital-intensive firms. We find that, overall, rising wages and expanding markets are the two most important drivers of China’s explosion in patents.
Third, since a feature of the Chinese economy is the significant presence of SOEs, we investigate possible resource misallocation in the innovation space. We find that although SOEs have received a relatively high share of government subsidies, their performance in innovation is lacklustre compared with that of private enterprises. Furthermore, the elasticity of patent filing or patents granted per renminbi (RMB) of subsidy is significantly higher for private sector firms than for SOEs. We interpret these patterns as reflecting the misallocation of public funds. Interestingly, we also find evidence that SOEs often face higher realised tax burdens than private firms (the sum of corporate income tax and value-added tax as a share of sales or profits). To improve the efficiency of resource allocation, policy reforms should perhaps put weight on simultaneous reductions in discretionary subsidies and taxes.
In the next section, we provide an overview of the sources of past economic growth. In section three, we examine the pace of innovation in Chinese firms, with particular attention to patent data. In section four, we examine the sources of innovation growth—in particular, the possible roles of the misreporting of and/or lax approval processes for patents, expanding market opportunities, subsidies and tax reductions and rising wages. In section five, we implement a robustness check, seeking evidence of quality improvement in Chinese exports in an era of rapidly rising local wages. In section six, we investigate resource allocation efficiency—especially government subsidies to firms of different ownership types—and its role in firms’ innovation. We draw our conclusions in section seven.
Sources of historical growth
China’s rapid growth in the past several decades has been driven by two sets of factors: 1) market-oriented policy reforms (which allowed market-determined output prices and factor prices to progressively replace administrative prices, and the introduction and strengthening of property rights) and the policy of opening up (reducing barriers to international trade and investment); and 2) economic fundamentals—a favourable demographic structure and low initial labour costs. Since we have discussed the wage and demographic factors, we will provide a brief review of the institutional reforms that allowed firms to use the economic fundamentals as a source of growth.
The Chinese growth miracle started with reform of the rural household responsibility system (HRS) in the early 1980s. Under the HRS, farmers were granted land cultivation rights so they could make their own production decisions. With better-aligned incentives, agricultural production and rural incomes increased dramatically in the ensuing years (Lin 1992). In just a few years, hundreds of millions of farmers were released from their land, providing the non-farm sector with a seemingly unlimited labour supply. In the 1980s, China’s labour costs were among the lowest of the developing countries—lower than India and the Philippines. The availability of large numbers of low-wage workers ensured China’s growth model in the subsequent three decades was based on low-cost production.
In the 1980s, township and village–owned enterprises (TVEs) grew rapidly thanks to abundant labour and rising market demand for daily goods after the successful rural reforms. TVEs were largely manufacturing firms in rural areas, and can be regarded as a second-best response to the institutional barriers to free relocation of labour across space; they provided a way for China to accelerate the movement of labour from low-productivity activities in rural areas to higher-productivity manufacturing activities before restrictions on internal migration were removed. Because they are second-best entities, TVEs also carry their own distortions, as their property rights have not always been clearly defined. In the 1990s, the government launched massive TVE and SOE reforms in an attempt to give entrepreneurs more incentives. Most TVEs were privatised. For SOEs, the government adopted a policy of ‘grasping the big, letting go of the small’ by privatising small SOEs and consolidating large ones (Hsieh and Song 2015). After the reforms, TVE employment plummeted from 129 million in 1995 to just 6 million in 2011, while SOE employment dropped from 113 million in 1995 to 67 million in 2011. The number of SOEs declined by 92 per cent, from 744,240 in 1995 to 61,204 in 2014 (Table 8.1).
Table 8.1 Number of Chinese firms
|
Year |
No. of existing firms |
No. of newly established firms |
Private (%) |
SOE (%) |
Foreign (%) |
|
1995 |
4,102,757 |
705,684 |
74.94 |
18.14 |
6.92 |
|
1996 |
4,628,316 |
676,993 |
76.71 |
17.98 |
5.31 |
|
1997 |
5,029,932 |
704,512 |
78.26 |
16.72 |
5.02 |
|
1998 |
5,328,497 |
803,088 |
80.13 |
15.67 |
4.19 |
|
1999 |
5,563,881 |
838,987 |
81.18 |
15.16 |
3.66 |
|
2000 |
5,752,414 |
849,768 |
83.81 |
12.00 |
4.20 |
|
2001 |
5,918,494 |
914,449 |
86.47 |
8.57 |
4.96 |
|
2002 |
6,079,731 |
1,043,979 |
88.04 |
6.82 |
5.14 |
|
2003 |
6,410,225 |
1,237,360 |
89.61 |
5.59 |
4.80 |
|
2004 |
6,896,890 |
1,356,846 |
91.11 |
3.96 |
4.93 |
|
2005 |
7,473,111 |
1,363,405 |
91.42 |
3.40 |
5.18 |
|
2006 |
8,061,934 |
1,361,640 |
92.50 |
2.83 |
4.67 |
|
2007 |
8,658,343 |
1,324,605 |
92.24 |
2.72 |
5.04 |
|
2008 |
9,050,977 |
1,311,798 |
92.50 |
2.74 |
4.75 |
|
2009 |
9,500,295 |
1,530,672 |
95.26 |
1.63 |
3.11 |
|
2010 |
10,230,384 |
1,802,531 |
96.09 |
1.24 |
2.66 |
|
2011 |
11,254,499 |
2,021,418 |
96.58 |
0.95 |
2.47 |
|
2012 |
12,463,854 |
2,002,236 |
96.82 |
0.9 |
2.28 |
|
2013 |
13,544,658 |
2,611,083 |
97.69 |
0.63 |
1.68 |
|
2014 |
15,300,901 |
3,681,347 |
98.35 |
0.40 |
1.25 |
|
Annual growth rate (%) |
|||||
|
1995–2004 |
5.94 |
7.53 |
8.27 |
–10.54 |
2.02 |
|
2004–2014 |
8.29 |
10.50 |
9.13 |
–13.89 |
–5.59 |
|
1995–2014 |
7.17 |
9.08 |
8.72 |
–12.32 |
–2.06 |
Source: Tabulated by the authors based on the China Firm Registry Database.
In the short term, the reform was a painful process; large numbers of urban workers had to leave SOEs. Remarkably, the country avoided a big spike in the unemployment rate. The key was that the de facto privatisation was accompanied by aggressive reforms that lowered the entry barriers for private sector entrepreneurs. The inefficiency of the previous centrally planned, state-dominated economic system, together with high barriers to entry, meant there was a huge level of unexplored or underexplored opportunities for profit-making, and private sector entrepreneurs responded quickly. As a result, almost all of the jobs lost from TVEs and SOEs were offset by new job opportunities in the private sector. The number of private enterprises increased nearly fivefold, to more than 15 million, in the period 1995–2014 (see Table 8.1). By 2011, 193 million people worked in private enterprises (including those who were self-employed)—about three times the workforce in SOEs (NBS 2012). Therefore, in terms of employment share by ownership, the Chinese economy has clearly come to be dominated by the private sector. Indeed, Wei and Zhang (2011b), using firm-level census data for 1994 and 2005, document two 70 per cent rules: first, approximately 70 per cent of the growth in industrial value added came from private sector firms in this period; second, approximately 70 per cent of private sector growth in value added came from the increase in the number of new private sector firms (the extensive margin), while the remaining 30 per cent came from the growth of existing firms (the intensive margin).
China also reformed its financial system to provide local governments with better incentives to develop their economies. Under the arrangements introduced in the early 1980s, local governments and the central government follow a predetermined revenue formula (varying across regions as a result of local bargaining power), greatly stimulating local officials’ incentive to create a more business-friendly environment. The system was reformed further in 1994, with the introduction of a value-added tax and a nationally uniform formula with which to divide revenue collection between the central and local governments. These reforms empowered entrepreneurs and local officials, providing them an impetus to pursue growth.
From the start of the Deng Xiaoping era in 1979, China adopted a development strategy of ‘opening up’ to the outside world. The government set up special zones in the coastal provinces to attract foreign direct investment (FDI) in the 1980s and 1990s, and integration with the global economy was accelerated after the country joined the WTO in December 2001. As China opened up, the external demand for its products increased, which in turn stimulated the growth of private enterprises. China’s open-door policy and abundant cheaper labour attracted massive inflows of FDI. By 2003, China had become the largest recipient of inward FDI. The openness to trade and FDI has facilitated economic growth through many channels and has also had important impacts on the rest of the world (see Feenstra and Wei 2010).
As well as extensive growth in firms and augmented input use, knowledge growth and productivity improvement are key drivers of economic growth. The increase in productivity stems from sectoral innovation and the reallocation of resources (mainly labour) from low to highly productive sectors. Innovation and infrastructure investment are key pillars of intra-sector productivity improvement. The role of innovation in productivity growth has been widely discussed in the literature (Romer 1990). China’s rapid build up in infrastructure gives it some advantage in improving productivity. Even though its first expressway was not built until 1988, China’s total highway length reached 122,300 kilometres by 2015—more than any other country. The story of China’s high-speed rail (HSR) is equally, if not more, remarkable. Starting from nothing in 2005, its constructed length had surpassed 19,300 km by 2015. In 2016, a Chinese HSR company went to the United States to negotiate building the first HSR in that country.2
As well as productivity growth within a firm or sector, structural change can also contribute to economic growth by shifting resources from less productive to more productive sectors, such as from the state sector to the private sector or from the agricultural sector to non-agricultural sectors (Zhu 2012). It is estimated that sectoral productivity increases and structural change accounted for 42 per cent and 17 per cent of economic growth, respectively, during 1978–95 (Fan et al. 2003).
Demographic factors were powerful drivers of China’s growth in the past three-and-a-half decades (and are an important contributor to the recent growth slowdown). China’s fertility rate should have dropped over the same period as its per capita income rose; however, the actual decline was more pronounced than that suggested by international experience because of the family planning policies implemented from 1979. The sharp decline in the fertility rate means there are fewer young dependants to support for a given working-age cohort. The share of prime-age population in the total population rose steadily for three decades, creating a demographic dividend, which in turn contributed to economic growth (Cai and Wang 2008).
The one-child policy yields an unintended consequence in distorting the sex ratio in favour of boys, meaning that as this generation reaches marriageable age, young men face a very competitive environment. To attract potential brides, families with sons choose to work harder, save more and take more risks, including exhibiting a higher propensity to become entrepreneurs (Wei and Zhang 2011a, 2011b; Chang and Zhang 2015; Wei et al. 2016). It is estimated that increasing competition in the marriage market due to sex ratio imbalances has contributed to about 2 percentage points of economic growth per annum (Wei and Zhang 2011b). It is important to note that this additional growth is of an immiserising type: social welfare is likely to decline even though GDP growth increases. The logic for this is explained in Wei and Zhang (2011b): the extra work effort and extra risk-taking that produce a higher GDP growth rate are motivated by a desire to improve one’s chances (or one’s children’s chances) in the marriage market. Yet, the share of young men who will not get married in the aggregate is determined by the sex ratio, and not by the economy-wide work effort, risk-taking or GDP growth rate. In this sense, the extra work effort and risk-taking are futile; utility-maximising households would have happily given up this part of income growth if there were no sex ratio imbalance.
For three decades after the start of market-oriented reforms in the country, China appeared to have inexhaustible ‘surplus labour’ (low-productivity labour in rural areas). Signs of a labour shortage started to emerge, however, in the mid-2000s. According to Cai and Du (2011) and Zhang et al. (2011), wages for unskilled workers have shown double-digit growth since 2003–04, indicating the country might have crossed the so-called Lewis turning point, which means the era of surplus labour is over.
The exact timing of the sharp increase in the wage rate for unskilled workers is a subject of debate. Wang et al. (2011) report a turning point as early as 2000. On the other hand, Knight et al. (2011) and Golley and Meng (2011), for example, point out that barriers to internal migration—especially the rigid household registration system that prevents rural households from moving freely to urban areas—allow additional scope for rural–urban migration if and when the remaining barriers are dismantled. Either way, China is no longer a low-wage country.
Since the onset of the Global Financial Crisis (GFC) in 2008, external demand for Chinese products has weakened. The previous growth model based on exploiting cheap labour is no longer viable. As a result of the strict family planning policies implemented in the early 1980s, the number of entrants to the labour force fell below the number leaving from 2011. The usually favourable dependency ratio has become an unusually unfavourable ratio. Facing rising labour costs and weak external demand, firms have to make a tough choice: to move in, out, down or up. Moving ‘in’ means relocating factories from coastal to inland areas, where wages are lower. Given the pace of convergence within the country, this is at best a temporary strategy. Moving ‘out’ means engaging in outbound direct investment, combining Chinese knowhow with low wages in other countries. No doubt, some Chinese companies are pursuing this strategy. Moving ‘down’ means closing the business, which is an option for individual firms, but not for the country as a whole. Moving ‘up’ means engaging in innovation and upgrading so firms no longer need to depend on low-paid unskilled labour. While firms will employ a portfolio of such strategies, a decisive factor for China’s economic future will be whether its firms can innovate and upgrade, and how fast they can do so. In the next section, we focus on innovation and quality upgrading and ask the question: can China transition to become a more innovative economy?
The pace of innovation as measured by growth in patents
Innovation can take the form of commercial secrets or patents, or it can be about improving business processes or models, in addition to inventing new products. Innovation can also take place outside the commercial space, such as in the cultural sphere. Due to data availability, we focus on patents lodged by firms as a measure of innovation.
Alongside rapid economic growth in China, the number of patents has exploded. The number of patent applications filed with SIPO leapt from less than 100,000 in 1995 to more than 2 million in 2014, with an annual growth rate of 19 per cent—doubling the per capita GDP growth rate in the same period. The annual growth rate of patent filings has accelerated from 17 per cent in the period 1995–2014 to 21 per cent between 2004 and 2014 (see Table 8.2). By 2011, China had overtaken the United States as the world’s most prolific patent filer (WIPO 2012).
Among the three types of patents—invention, utility model and design—the share of applications for invention patents (arguably, the most technically intensive) rose from 26 per cent in 1995 to 39 per cent in 2014. In 1995, foreign patent filings accounted for more than 17 per cent of total applications, but the share of foreign filings dropped to a mere 6 per cent in 2014. The latter suggests that indigenous innovation has played an increasing role in the Chinese economy. Easy approvals, low-quality patent filings, government subsidies, expanded market opportunities and responses to rising labour costs have been offered as potential reasons for this explosion in Chinese patents. But how do these trends compare with the patent gains of the economies noted in the introduction?
Table 8.2 Number of Chinese patent applications, 1995–2014
|
Year |
Total domestic applications |
Of domestic patent applications |
Total overseas applications |
|||
|
Invention (%) |
Utility model (%) |
Design (%) |
Foreign (%) |
|||
|
1995 |
83,045 |
26 |
53 |
21 |
17 |
205 |
|
1996 |
102,735 |
28 |
48 |
24 |
20 |
201 |
|
1997 |
114,208 |
29 |
44 |
27 |
21 |
178 |
|
1998 |
121,989 |
29 |
42 |
28 |
21 |
259 |
|
1999 |
134,239 |
27 |
43 |
30 |
18 |
383 |
|
2000 |
170,682 |
30 |
40 |
29 |
18 |
652 |
|
2001 |
203,573 |
31 |
39 |
30 |
19 |
846 |
|
2002 |
252,631 |
32 |
37 |
31 |
19 |
1,138 |
|
2003 |
308,487 |
34 |
35 |
30 |
19 |
1,368 |
|
2004 |
353,807 |
37 |
32 |
31 |
21 |
2,365 |
|
2005 |
476,264 |
36 |
29 |
34 |
20 |
3,258 |
|
2006 |
573,178 |
37 |
28 |
35 |
18 |
5,293 |
|
2007 |
693,917 |
35 |
26 |
39 |
15 |
6,041 |
|
2008 |
828,328 |
35 |
27 |
38 |
13 |
7,099 |
|
2009 |
976,686 |
32 |
32 |
36 |
10 |
9,766 |
|
2010 |
1,222,286 |
32 |
34 |
34 |
9 |
11,703 |
|
2011 |
1,633,347 |
32 |
36 |
32 |
8 |
14,937 |
|
2012 |
2,050,649 |
32 |
36 |
32 |
7 |
19,627 |
|
2013 |
2,377,061 |
35 |
37 |
38 |
6 |
22,008 |
|
2014 |
2,361,243 |
39 |
37 |
24 |
6 |
26,356 |
|
Annual growth rate of total number of patents in different periods (%) |
||||||
|
1995–2004 |
17 |
22 |
11 |
23 |
20 |
31 |
|
2004–2014 |
21 |
22 |
23 |
18 |
7 |
27 |
|
1995–2014 |
19 |
22 |
17 |
20 |
13 |
29 |
Sources: Tabulated by the authors based on aggregate online data from SIPO (www.sipo.gov.cn/tjxx/) and WIPO (various years).
We start by drawing a comparison between the ease of patent approval in China and that in other countries. Figure 8.1 shows the patent approval rate in BRICS countries, South Korea and the United States. The Chinese ratio of 0.5 is not unusually high, ceteris paribus, indicating it is not especially easy to obtain patent approval. Approved patents have exhibited a pattern of rapid growth similar to that for patent applications. The annual growth rate of patents approved by SIPO between 1995 and 2014 is the same as that for patent applications—that is, 19 per cent (Table 8.3). The number of patents granted by developed countries grew by 28 per cent per annum during the same period. It is widely believed that Chinese firms, individuals and institutions tend to file high-quality patents in developed countries rather than with SIPO. The much more rapid growth in overseas patent applications signals an improvement in Chinese patent quality.
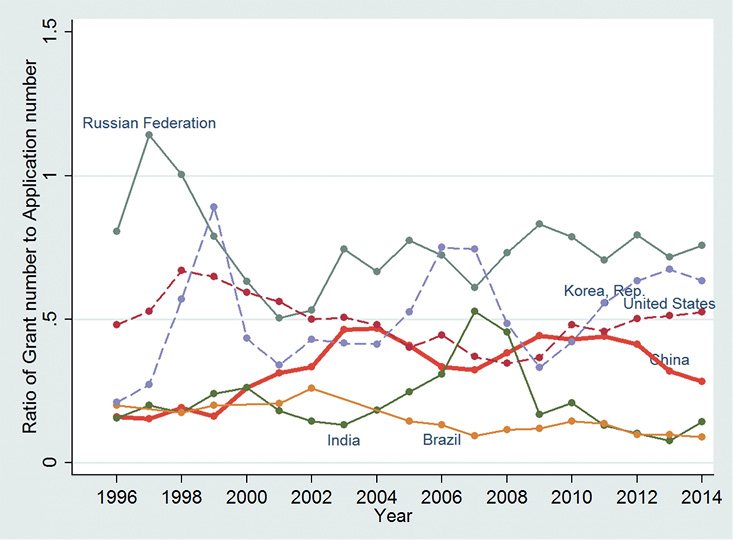
Figure 8.1 Patent approval rates in BRICS countries, South Korea and the United States
Note: The approval rate is defined as grant number in T divided by application number in T–1.
Source: WIPO (various years).
We investigate whether the rapid growth in patents reflects a low starting base. First, we divide the sample into two periods, 1995–2004 and 2004–14, and calculate the annual growth rate for each. If a low initial value is the major cause of the phenomenal growth in patents then we would expect to see a lower growth rate in the second period, when the initial base was much larger. In fact, we observe that the annual growth rate for both patent filings and patent approvals in the second period is 4 percentage points higher than in the initial period.
Table 8.3 Number of patents approved by SIPO and patents granted to Chinese applicants from overseas patent offices, 1995–2014
|
Year |
Total domestically approved patents |
Of domestically approved patents |
Total approved patents overseas |
|||
|
Invention (%) |
Utility model (%) |
Design (%) |
Foreign (%) |
|||
|
1995 |
45,064 |
8 |
68 |
25 |
8 |
99 |
|
1996 |
43,780 |
7 |
62 |
31 |
9 |
97 |
|
1997 |
50,996 |
7 |
54 |
40 |
9 |
91 |
|
1998 |
67,889 |
7 |
50 |
43 |
10 |
95 |
|
1999 |
100,156 |
8 |
56 |
36 |
8 |
126 |
|
2000 |
105,345 |
12 |
52 |
36 |
10 |
157 |
|
2001 |
114,251 |
14 |
48 |
38 |
13 |
225 |
|
2002 |
132,399 |
16 |
43 |
40 |
15 |
334 |
|
2003 |
182,226 |
20 |
38 |
42 |
18 |
362 |
|
2004 |
190,238 |
26 |
37 |
37 |
20 |
524 |
|
2005 |
214,003 |
25 |
37 |
38 |
20 |
539 |
|
2006 |
268,002 |
22 |
40 |
38 |
16 |
847 |
|
2007 |
351,782 |
19 |
43 |
38 |
14 |
1,013 |
|
2008 |
411,982 |
23 |
43 |
34 |
14 |
1,652 |
|
2009 |
581,992 |
22 |
35 |
43 |
14 |
2,234 |
|
2010 |
814,825 |
17 |
42 |
41 |
9 |
3,434 |
|
2011 |
960,513 |
18 |
42 |
40 |
8 |
4,255 |
|
2012 |
1,255,138 |
17 |
46 |
37 |
7 |
6,433 |
|
2013 |
1,313,000 |
16 |
53 |
31 |
6 |
8,337 |
|
2014 |
1,302,687 |
18 |
54 |
28 |
7 |
10,282 |
|
Annual growth rate in different periods (%) |
||||||
|
1995–2004 |
17 |
35 |
10 |
23 |
29 |
20 |
|
2004–2014 |
21 |
17 |
26 |
18 |
9 |
35 |
|
1995–2014 |
19 |
25 |
18 |
20 |
18 |
28 |
Sources: Tabulated by the authors based on aggregate online data from SIPO (www.sipo.gov.cn/tjxx/) and WIPO (various years).
Second, we look at the trend for foreign citations of patents approved by SIPO to gauge the quality of domestically approved patents in China. Although SIPO does not count the domestic citations of Chinese patents, patents granted in developed countries specify all the patents cited, including those approved by SIPO. Table 8.4 reports the number of citations of domestically approved invention and utility model patents in China from 1995 to 2014. During the period 1995–2004, the annual growth rate of foreign citations of Chinese invention patents was 34 per cent, and this accelerated to 49 per cent in the second period, 2004–14. The number of citations of utility model patents resembles that for invention patents, growing at 36 per cent per annum over the whole period. The growth in foreign citations of domestic patents even outpaces the growth of domestic patents, which suggests that at least a share of the Chinese patents filed are of citable quality internationally.
Table 8.4 Foreign patents citations on Chinese domestic patents approved by SIPO, 1995–2014
|
Year |
Invention patents |
Utility patents |
|
1995 |
100 |
65 |
|
1996 |
114 |
62 |
|
1997 |
174 |
100 |
|
1998 |
201 |
98 |
|
1999 |
244 |
125 |
|
2000 |
303 |
198 |
|
2001 |
522 |
357 |
|
2002 |
667 |
440 |
|
2003 |
1,019 |
681 |
|
2004 |
1,358 |
851 |
|
2005 |
1,765 |
1,089 |
|
2006 |
2,984 |
1,830 |
|
2007 |
5,087 |
2,721 |
|
2008 |
9,183 |
4,084 |
|
2009 |
13,347 |
5,097 |
|
2010 |
20,781 |
7,752 |
|
2011 |
30,706 |
11,241 |
|
2012 |
45,364 |
16,132 |
|
2013 |
55,649 |
21,072 |
|
2014 |
71,383 |
23,544 |
|
Annual growth rate in different periods (%) |
||
|
1995–2004 |
34 |
33 |
|
2004–2014 |
49 |
39 |
|
1995–2014 |
41 |
36 |
Source: Tabulated by authors based on WIPO (various years).
Third, we compare patents by Chinese firms approved by the USPTO with patents by firms from other countries approved by USPTO to investigate whether China is an outlier. This could help us to control for differences in quality between patents approved by the USPTO and those granted by SIPO. Table 8.5 presents the number of patents granted by the USPTO to applicants from BRICS countries, as well as from Germany, Japan and South Korea. Of the sampled countries, between 1995 and 2014, China saw the fastest growth in the number of patents approved by the USPTO, with an annual growth rate of 28 per cent. Moreover, as the data in Table 8.5 reveal, the gap in the growth rate between China and the other countries has widened over time. The annual growth rate of Chinese patents approved by the USPTO in 2004–14 reached 33 per cent, 10 percentage points higher than the second-placed country, India. By comparison, patents granted to South Korea, Germany and Japan grew by 14 per cent, 4 per cent and 4 per cent per annum, respectively, during the period.
Table 8.5 Total number of patents granted by the USPTO to (corporate) applicants from BRICS countries, Germany, Japan and South Korea
|
Year |
China |
Brazil |
India |
Russia |
South Africa |
Germany |
Japan |
South Korea |
|
1995 |
62 |
63 |
37 |
98 |
123 |
6,600 |
21,764 |
1,161 |
|
1996 |
46 |
63 |
35 |
116 |
111 |
6,818 |
23,053 |
1,493 |
|
1997 |
62 |
62 |
47 |
111 |
101 |
7,008 |
23,179 |
1,891 |
|
1998 |
72 |
74 |
85 |
189 |
115 |
9,095 |
30,841 |
3,259 |
|
1999 |
90 |
91 |
112 |
181 |
110 |
9,337 |
31,104 |
3,562 |
|
2000 |
119 |
98 |
131 |
183 |
111 |
10,234 |
31,296 |
3,314 |
|
2001 |
195 |
110 |
177 |
234 |
120 |
11,260 |
33,223 |
3,538 |
|
2002 |
289 |
33 |
249 |
200 |
114 |
11,278 |
34,859 |
3,786 |
|
2003 |
297 |
130 |
341 |
202 |
112 |
11,444 |
35,517 |
3,944 |
|
2004 |
404 |
106 |
363 |
169 |
100 |
10,779 |
35,348 |
4,428 |
|
2005 |
402 |
77 |
384 |
148 |
87 |
9,011 |
30,341 |
4,352 |
|
2006 |
661 |
121 |
481 |
172 |
109 |
10,005 |
36,807 |
5,908 |
|
2007 |
772 |
90 |
546 |
188 |
82 |
9,051 |
33,354 |
6,295 |
|
2008 |
1,225 |
101 |
634 |
176 |
91 |
8,915 |
33,682 |
7,549 |
|
2009 |
1,655 |
103 |
679 |
196 |
93 |
9,000 |
35,501 |
8,762 |
|
2010 |
2,657 |
175 |
1,098 |
272 |
116 |
12,363 |
44,814 |
11,671 |
|
2011 |
3,174 |
215 |
1,234 |
298 |
123 |
11,920 |
46,139 |
12,262 |
|
2012 |
4,637 |
196 |
1,691 |
331 |
142 |
13,835 |
50,677 |
13,233 |
|
2013 |
5,928 |
254 |
2,424 |
417 |
161 |
15,498 |
51,919 |
14,548 |
|
2014 |
7,236 |
334 |
2,987 |
445 |
152 |
16,550 |
53,849 |
16,469 |
|
Annual growth rate in different periods (%) |
||||||||
|
1995–2004 |
23 |
6 |
29 |
6 |
–2 |
6 |
6 |
16 |
|
2004–2014 |
33 |
12 |
23 |
10 |
4 |
4 |
4 |
14 |
|
1995–2014 |
28 |
9 |
26 |
8 |
1 |
5 |
5 |
15 |
Note: The figures represent the total number of patents granted to applicants from these countries by the USPTO.
Source: Computed by authors based on data from WIPO (various years).
Assuming that talent is normally distributed evenly across countries, China, as the most populous country, enjoys a larger talent pool than other countries when it comes to generating innovative ideas. Its rapid growth in patents granted since the period of opening up and reform, both domestically and overseas, may have something to do with its large population size. To address this concern, we should control for population size when making the international comparisons. Similarly, the level of economic development also matters for the total number of patents: wealthier countries can afford to devote more resources to R&D and face a stronger necessity to innovate than poor countries. Thus, we should also control for per capita GDP in our comparisons.
For international comparison, we include OECD and BRICS countries in our sample. We regress the total number of invention patents granted by the USPTO on population size (log), per capita GDP (log), country fixed effects, year fixed effects and country × year fixed effects. Figure 8.2 plots the estimated coefficients for the country × year fixed effects for Japan, Germany, South Korea and BRICS countries versus their per capita GDP. The conditional plot reflects the time trend of patents approved by the USPTO from applicants in these countries after controlling for their population size and level of economic development. As revealed in the figure, along with economic growth, China has registered steady growth in invention patents, while other countries, with the exception of India, do not exhibit such a clear trend. In the sample period, India also displays a positive correlation between economic growth and patent growth, but China has come out ahead of India in terms of obtaining patent approvals from the USPTO.
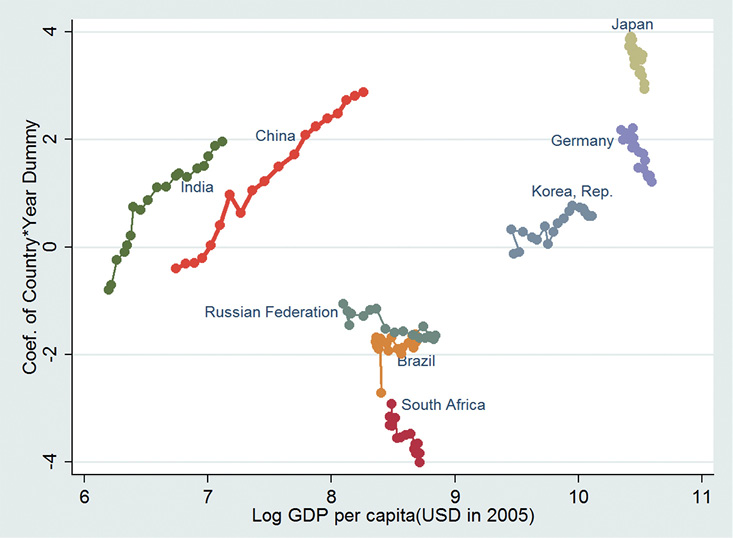
Figure 8.2 Invention patents granted by the USPTO for different countries
Note: Conditional plot by controlling for population, population squared and country and year fixed effects.
Sources: Based on data from OECD and, for BRICS countries, from WIPO (various years).
To understand the value of patents to innovators, it is useful to look at the frequency of citations of a patent by other patent applicants. In Figure 8.3, the total number of citations of patents by country in all patents granted by the USPTO in subsequent years (forward citations) replaces the total number of patents granted in Figure 8.2. Once again, China and India demonstrate a clear upward trend with GDP growth. Because China grew faster than India, the growth in citations of Chinese patents appears more remarkable in the figure. By comparison, the patterns are not apparent for other BRICS countries, Japan, Germany and South Korea. Importantly, if one fits a log linear line between patents cited and log income based on other countries’ experiences, the graph appears to suggest that China is awarded more patents than other BRICS countries (except India) and more than the comparator advanced countries when their income level is comparable China’s.
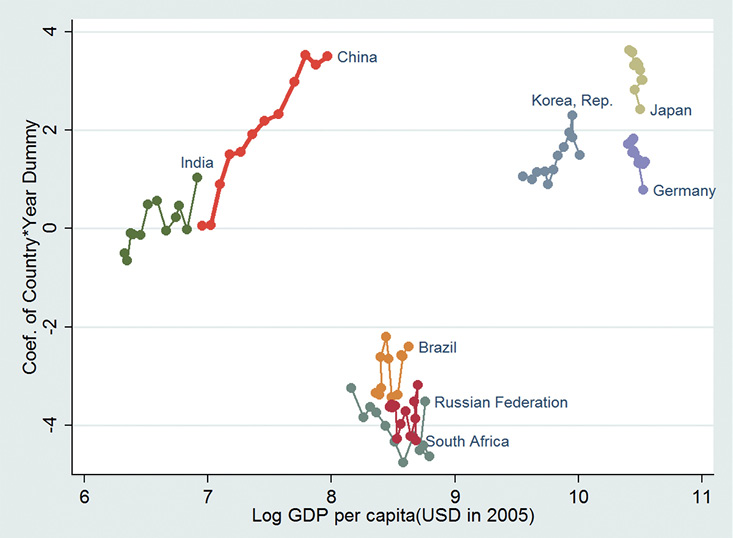
Figure 8.3 Citations of invention patents granted by the USPTO: Cross-country comparison
Note: Conditional plot by controlling for population, population squared and country and year fixed effects.
Sources: Based on data from OECD and, for BRICS countries, from WIPO (various years).
Overall, not only has the number of Chinese patents exploded, but so too has their quality, as measured by forward citation statistics. Chinese patent quality exhibits remarkable improvement over time, in absolute terms and when compared with other BRICS economies and leading patent-filing OECD countries. In short, the growth in innovation appears real and robust.
Sources of innovation growth
What are the sources of China’s rapid growth in innovation as demonstrated by our analysis of China’s patent filings? There are several potential factors. Government support for R&D, industrial competition, market size and changes in relative prices (such as rising wages) have been regarded as the major drivers of innovation. In this section, we study each of these factors individually and collectively to explore their role in driving China’s recent patent success.
First, R&D investment is a key input for patents, and the Chinese Government has increasingly provided large subsidies to firms in support of their R&D activities. To gauge the degree of such subsidies, we merge the Chinese patent database with the Annual Survey of Industrial Enterprises in China (ASIEC). The ASIEC database covers all SOEs and above-scale private firms with annual sales exceeding RMB5 million from 1998 to 2009, including ownership information.3 The patent database contains all patents granted by SIPO between 1985 and 2012. R&D data are taken from the ASIEC database, which provides firm-level annual R&D subsidy data.
Figure 8.4 plots the ratio of R&D subsidies to total sales for SOEs and for private firms, using data from the ASIEC firm database, and reflects a pattern that is similar to that when value added is used as the denominator. What is evident is that SOEs received a greater volume of subsidies than private firms across the period 1998–2007 (the period for which the ASIEC data are available). Even though small and medium SOEs were granted more subsidies than their private counterparts, they generally performed poorly when compared with private firms in generating patents. As shown in Table 8.6, during the period 1998–2009, the number of patents granted to private firms grew by an annual rate of 35 per cent, overtaking SOEs and foreign firms by 23 and 9 percentage points, respectively. The drop in the share of patents held by SOEs is due mainly to the shrinkage of the SOE sector. In 1998, SOEs accounted for 30 per cent of the total number of firms in the ASIEC database, while they dropped to just 2 per cent by 2009. Because of their massive numbers, private firms have become the engine of innovation.
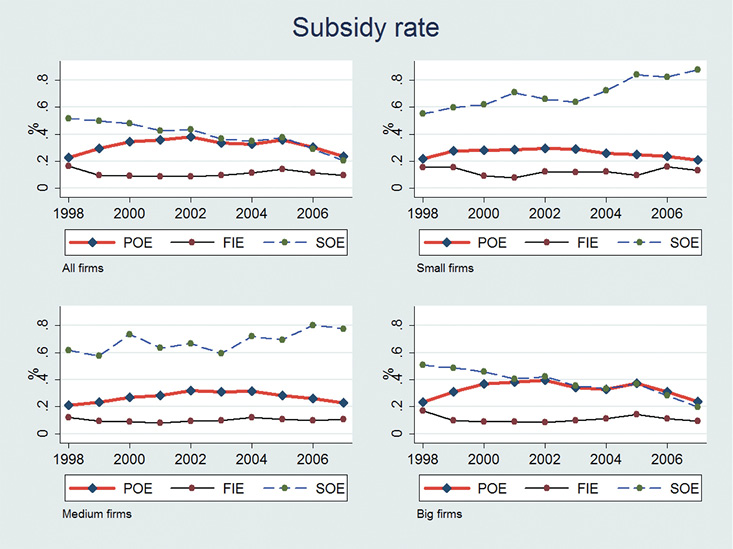
Figure 8.4 Ratio of subsidies to sales by firm ownership and size
Note: Firms are divided equally into three groups according to sales: small, medium and large.
Source: ASIEC database, 1998–2007.
Market size has been regarded as a key driver of innovation in the literature (Acemoglu and Linn 2004). In the past decades, the Chinese economy has become increasingly integrated with the global economy, particularly since China’s 2001 accession to the WTO. When confronted by fierce international market competition, one way for export firms to maintain their competitiveness is to innovate. As revealed in Table 8.6 and Figure 8.5, China’s exporting firms are indeed more innovative than its non-exporting firms.
Table 8.6 Distribution of domestically granted patents to firms, by firm type and year of application
|
Share of patent numbers |
Share of firm numbers |
Patent per firm |
Exporting firms (%) |
Labour-intensive firms (%) |
||||||||
|
Year |
Total |
Private firm (%) |
State-owned firms (%) |
Foreign firm (%) |
Private firm (%) |
State-owned firms (%) |
Foreign firm (%) |
Private firm |
State-owned firms |
Foreign firm |
||
|
1998 |
8,776 |
37 |
23 |
40 |
53 |
30 |
17 |
0.043 |
0.049 |
0.148 |
59 |
55 |
|
1999 |
12,181 |
36 |
22 |
42 |
55 |
27 |
18 |
0.058 |
0.072 |
0.209 |
60 |
59 |
|
2000 |
14,613 |
39 |
19 |
42 |
59 |
22 |
19 |
0.069 |
0.094 |
0.229 |
59 |
56 |
|
2001 |
18,121 |
47 |
12 |
41 |
64 |
17 |
20 |
0.089 |
0.089 |
0.254 |
65 |
62 |
|
2002 |
26,028 |
49 |
11 |
39 |
67 |
13 |
20 |
0.121 |
0.140 |
0.320 |
64 |
63 |
|
2003 |
31,483 |
51 |
13 |
36 |
70 |
10 |
21 |
0.131 |
0.240 |
0.319 |
67 |
63 |
|
2004 |
41,739 |
52 |
8 |
40 |
72 |
6 |
21 |
0.119 |
0.211 |
0.311 |
73 |
66 |
|
2005 |
52,017 |
53 |
7 |
40 |
74 |
4 |
21 |
0.150 |
0.326 |
0.400 |
69 |
69 |
|
2006 |
68,960 |
54 |
6 |
40 |
76 |
3 |
21 |
0.180 |
0.450 |
0.483 |
69 |
69 |
|
2007 |
87,086 |
61 |
5 |
34 |
78 |
2 |
20 |
0.220 |
0.658 |
0.474 |
68 |
68 |
|
2008 |
122,558 |
61 |
5 |
34 |
80 |
2 |
18 |
0.248 |
0.877 |
0.602 |
73 |
67 |
|
2009 |
137,900 |
62 |
5 |
33 |
80 |
2 |
18 |
0.365 |
1.371 |
0.825 |
60 |
66 |
|
Annual growth rate (%) |
28 |
35 |
12 |
26 |
11 |
–17 |
8 |
21 |
35 |
17 |
28 |
31 |
Notes: Private firms are either privately or collectively owned. If the state controls more than 50 per cent of a firm’s share, it is defined as a state-owned enterprise. Foreign firms are companies with more than 10 per cent of shares controlled by foreigners or by individuals or companies from Hong Kong, Macau or Chinese Taipei. The definition of labour-intensive firms follows Qu et al. (2013).
Source: Calculated by the authors based on a firm patent database (1998–2009) from the merging of SIPO’s national patent database and the ASIEC database.
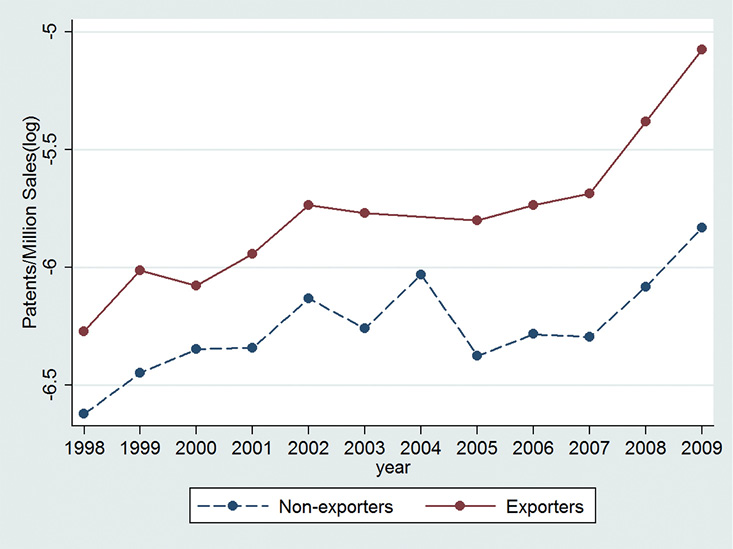
Figure 8.5 Patent intensity by firm’s export status
Note: A firm is defined as an exporter if it exports in a particular year.
Source: Modified from Xie and Zhang (2015).
Since 2003, real wages in China have grown at a rate of more than 10 per cent a year. Some scholars argue that China has now passed the Lewis turning point, which means that the era of ultra-low wage production is over (see, for example, Zhang et al. 2011). Facing rising labour costs, firms exit the business, relocate to areas with cheaper labour and land costs or innovate. The last column of Table 8.6 reports the share of patents granted to labour-intensive firms in China over time. Specifically, such firms increased their share of total patents granted, from 55 per cent in 1998 to 66 per cent in 2009. As shown in Figure 8.6, patent intensity—measured as the ratio of the number of patents granted to sales—for labour-intensive firms has increased, while it declined among capital-intensive firms from 2003 to 2007, which is around the time real wages started to spike. Rising labour costs may have induced labour-intensive sectors to come up with more innovations to substitute for labour.
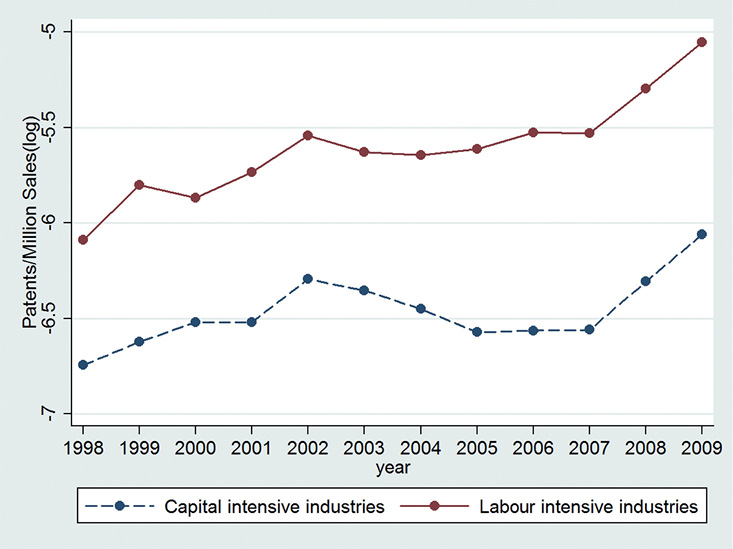
Figure 8.6 Patent intensity by firm’s capital intensity
Note: For each year, we define a firm as capital intensive if the capital–labour ratio is greater than the median value.
Source: Modified from Xie and Zhang (2015).
Of course, the above descriptions are based on bivariate correlations and, as such, are only suggestive. To evaluate the relative importance of the contribution of these factors to firms’ innovation, we now run multivariate regressions. Since many firms do not have patents and the patent count does not follow a log-normal distribution, we cannot use ordinary least squares (OLS) regressions by taking the log on patent count. A common approach in this situation is to use a negative binomial model; however, all the observations with zero patents will be dropped when including firm fixed effects. We therefore use the hybrid binomial estimation method proposed by Allison (2005) as follows: first, we compute the mean values of all the explanatory variables, X; second, we create a set of new variables by deducting the mean values from the original values of X—that is, X – mean of X; third, we run a random negative binomial model on the patent count using these newly created variables as independent variables. This method is a hybrid of the fixed effect and random effect models, and, importantly, it largely solves the shortcomings of the conditional estimated fixed effect negative binomial model, which automatically drops observations with zero values for the outcome variable for all years. The equation we estimate can be written as Equation 8.1.
Equation 8.1
Pijt = F(Salesit, Wagejt, Subsidyjt, Tax ratejt, Interest ratejt, Tariffjt, Exportit, HHjt, industry or firm fixed effects and year fixed effects)
In Equation 8.1, P is the number of approved patents for firm i in year t; Sales is firm i’s annual sales in year t; Wage is the average wage at the city–industry–year–firm ownership level (excluding the firm itself) in the cell where the firm is located; Subsidy is the ratio of subsidies received from the government to total sales at the firm level; Tax rate is the sum of income tax and value-added tax payments relative to total sales at the firm level in year t; Interest rate is the ratio of total interest paid to the average liability this year and last year at the firm level; Tariff is the weighted average of trading partners’ tariff rates, based on matching product-level tariff data from the United Nations’ Comtrade database with firm i’s Standard Industrial Classification two-digit (SIC-2) code (computed at the industry–year level);4 Export is a dummy variable indicating whether a firm has positive exports in year t; and HH is the Herfindahl–Hirschman (HH) index at the industry–year level.5
Many of the regressors are undoubtedly endogenous. In the spirit of an instrumental variable approach, we replace the wage rate, subsidy rate, tax rate and interest rate from firm–year specific values with the average values of all other firms in the same cell of city–industry–ownership type–year. The idea (or assumption) is that the average values of all other firms in the same cell will more likely reflect local labour market conditions (in the case of wages) or local policy designs (in the case of the other three variables). To do this exercise, we also drop all cells with fewer than five observations. Note that we regard the tariff variable as exogenous since it is the average of trading partners’ tariff rates, which are unlikely to be systematically manipulated by individual firms in China.
Table 8.7 reports the hybrid negative binomial regression estimates.6 Several findings are apparent from the results. First, firm size, measured by sales, is positively associated with the number of patents approved. Unsurprisingly, larger firms tend to have more patents approved. Second, exporting firms are more innovative than non-exporting firms. We refrain from assigning a causal interpretation to these two coefficients; the positive correlations between firm size and level of innovation and between export status and level of innovation could reflect causal effects in either direction (and probably in both directions) and these are not empirically explored herein. We have simply treated these regressors as control variables.
Table 8.7 Hybrid negative binomial regressions on patent count: Baseline
|
Variables |
(1) Total |
(2) Invention |
(3) Utility |
(4) Design |
|
Sales (log) |
0.437*** |
0.491*** |
0.435*** |
0.424*** |
|
(0.012) |
(0.024) |
(0.015) |
(0.019) |
|
|
Export |
0.115*** |
0.181*** |
0.071** |
0.157*** |
|
(0.022) |
(0.045) |
(0.028) |
(0.036) |
|
|
Wage (log) |
0.082*** |
0.224*** |
0.137*** |
0.072* |
|
(0.027) |
(0.050) |
(0.034) |
(0.042) |
|
|
Subsidy rate (log) |
0.003 |
0.045*** |
0.003 |
0.010 |
|
(0.006) |
(0.011) |
(0.007) |
(0.009) |
|
|
Tax rate (log) |
–0.073*** |
–0.066** |
–0.085*** |
–0.036 |
|
(0.017) |
(0.032) |
(0.021) |
(0.027) |
|
|
Interest rate (log) |
–0.025** |
0.010 |
–0.042*** |
–0.036** |
|
(0.010) |
(0.020) |
(0.013) |
(0.016) |
|
|
Partner tariff |
–1.048*** |
–0.843*** |
–1.123*** |
–0.482*** |
|
(0.078) |
(0.146) |
(0.115) |
(0.118) |
|
|
HH index |
0.143 |
–0.087 |
0.541** |
0.358 |
|
(0.224) |
(0.425) |
(0.267) |
(0.328) |
|
|
Observations |
1,187,140 |
1,187,140 |
1,187,140 |
1,187,140 |
|
Firm fixed effects |
YES |
YES |
YES |
YES |
|
Year fixed effects |
YES |
YES |
YES |
YES |
|
Akaike Information Criterion (AIC) |
438,522 |
114,137 |
270,400 |
213,959 |
*** represents 1% significant level.
Notes: Wage (log), Subsidy rate (log), Tax rate (log) and Interest rate (log) are averages at the city–industry–firm ownership type–year levels (except for the firm itself). Cells with fewer than six observations are dropped. Sales (log) and Export are still firm–year levels.
Third, lower import tariffs are positively associated with firms’ innovation through the expansion of international markets for Chinese products. Because foreign tariffs are (largely) exogenous, we interpret this coefficient as reflecting a causal effect: the expansion of international markets or export opportunities induces firms to be more innovative. Results in Table 8.7 suggest that a reduction by 1 per cent in the weighted average of the partner firms’ tariff rates in the relevant industry is associated, on average, with a 1 per cent increase in the number of patents granted.
Fourth, in terms of the effects of fiscal subsidies, there is some evidence that invention patents are positively associated with R&D subsidies, but the relationships therein for utility and design patents are not statistically significant. Since invention patents are often regarded as ‘more innovative’ than the other types, one cannot rule out the possibility that firms’ innovative activities respond to fiscal incentives.
Meanwhile, a higher tax rate is negatively associated with innovation; the coefficients on the tax rate are negative in all four columns, but statistically significant for all patents combined, and individually for invention and utility patents.
Fifth, higher capital costs as measured by a higher implied interest rate are negatively associated with many types of innovative activities; the coefficients on log interest rates are negative and statistically significant for all patents, and for utility and design patents.
Finally, there is a robust positive relationship between the wage level and firms’ innovation. If our strategy of using the average wages of all other firms in the same cell to replace individual firms’ own wages succeeds in removing endogeneity, one might interpret the coefficient as saying that firms, on average, rise to the challenge of higher labour costs by engaging in more innovation. Of course, innovative industries tend to hire more skilled workers than less innovative industries. In general, skilled workers earn more than unskilled workers, and thereby could produce a positive correlation between average wages and firms’ level of innovation at the industry level. Note that our regressions in Table 8.7 include separate firm and year fixed effects (therefore subsuming separate industry fixed effects). So the endogeneity has to come at the levels of industry–city–ownership–year. Nonetheless, to further remove endogeneity, we replace current average wages with those of others firms in the same cell by its lagged value, and find qualitatively the same results (see Appendix Table 8.A1). As a robustness check, we use the minimum wages at the city–year levels to replace the average wage of other firms in the same cell, and again find the same qualitative results (see Appendix Table 8.A2).
An absolute-level wage increase, however, presents a different relative cost shock to firms in labour-intensive and other industries. To explore this feature, we now add an interaction term between the average wage of other firms in the same cell and a dummy indicating that the industry in which the firm operates has a labour intensity (labour cost as a share of total cost) above the median at the beginning of the sample. Table 8.8 displays the estimation results. The coefficient for the interaction term is positive and statistically significant among three out of four regressions (for total patents, and for invention and design patents). These results are consistent with the induced innovation theory that suggests that rising labour costs induce labour-intensive firms to become more innovative to survive. The results in Table 8.8 are robust to the use of alternative wage variables (either lagged wages or legal minimum wages). To save space, the estimates using lagged wages and minimum wages are not reported here.
Table 8.8 Impacts of wages on the innovation levels of labour-intensive firms
|
Variables |
(1) Total |
(2) Invention |
(3) Utility |
(4) Design |
|
Wage (log)*Labour-intensive dummy |
0.163*** |
0.695*** |
–0.042 |
0.174*** |
|
(0.038) |
(0.073) |
(0.052) |
(0.059) |
|
|
Sales (log) |
0.436*** |
0.483*** |
0.433*** |
0.425*** |
|
(0.012) |
(0.024) |
(0.015) |
(0.019) |
|
|
Export |
0.108*** |
0.162*** |
0.064** |
0.153*** |
|
(0.022) |
(0.045) |
(0.028) |
(0.036) |
|
|
Wage (log) |
0.010 |
–0.101* |
0.184*** |
0.007 |
|
(0.034) |
(0.061) |
(0.050) |
(0.051) |
|
|
Subsidy rate (log) |
0.006 |
0.044*** |
0.008 |
0.012 |
|
(0.006) |
(0.011) |
(0.007) |
(0.009) |
|
|
Tax rate (log) |
–0.068*** |
–0.032 |
–0.082*** |
–0.031 |
|
(0.017) |
(0.033) |
(0.021) |
(0.027) |
|
|
Interest rate (log) |
–0.022** |
0.021 |
–0.040*** |
–0.035** |
|
(0.011) |
(0.020) |
(0.013) |
(0.017) |
|
|
Partner tariff |
–1.138*** |
–1.091*** |
–1.141*** |
–0.475*** |
|
(0.082) |
(0.148) |
(0.120) |
(0.122) |
|
|
HH index |
0.260 |
-0.090 |
0.597** |
0.456 |
|
(0.223) |
(0.423) |
(0.265) |
(0.327) |
|
|
Observations |
1,187,140 |
1,187,140 |
1,187,140 |
1,187,140 |
|
Firm fixed effects |
YES |
YES |
YES |
YES |
|
Year fixed effects |
YES |
YES |
YES |
YES |
|
Akaike Information Criterion (AIC) |
436,557 |
114,023 |
266,115 |
213,652 |
** represents 5% significant level
*** represents 1% significant level.
Notes: Wage (log), Subsidy rate (log), Tax rate (log) and Interest rate (log) are averages at the city–industry–firm ownership type–year levels (except for the firm itself). Cells with fewer than six observations are dropped. Sales (log) and Export are still firm–year levels. The dependent variable is the patent count. Hybrid negative binomial regression is used. See Qu et al. (2013) for the definition of labour-intensive industries.
Studies (Autor et al. 2003) have shown that computer technology has reduced the demand for jobs involving routine tasks. Following Autor et al. (2003), we create a dummy variable, ‘routine’, indicating whether an industry involves more routine tasks (1) or not (0). We expect to see firms facing rising labour costs and heavily involved in routine tasks, which are often done by low-skilled workers, to be more innovative for the purpose of substituting technology for labour. Similar to Table 8.7, we use a difference-in-difference (DID) approach to examine the impact of rising wages on routine task–intensive industries by including an interaction term between wages and a ‘routine’ dummy. As shown in Panel A of Table 8.9, the coefficient for the interaction term is statistically significant in all four regressions. In other words, in the presence of rising wages, the survival of firms (i.e. their ability to continue to produce) is linked to enhanced innovation, possibly by those firms taking advantage of computer technologies to replace labour in undertaking ‘routine’ tasks.
Table 8.9 Impact of wages on levels of innovation in routine-intensive industries and sunset industries
|
Variables |
(1) Total |
(2) Invention |
(3) Utility |
(4) Design |
|
Panel A: Impact on routine-intensive industries |
||||
|
Wage (log)*Routine |
0.490*** |
0.992*** |
0.237*** |
0.759*** |
|
(0.048) |
(0.089) |
(0.082) |
(0.072) |
|
|
Panel B: Impact on sunset industries |
||||
|
Wage (log)*Sunset |
0.040 |
–0.222*** |
–0.058 |
0.089 |
|
(0.040) |
(0.072) |
(0.052) |
(0.064) |
|
*** represents 1% significant level.
Notes: Hybrid negative binomial regression estimates. Routine industries are defined according to Autor et al. (2003).
When facing rising labour costs, there are two possible routes for labour-intensive industries to take. In industries where innovation is possible, firms must innovate to survive. In industries in which international experience suggests that innovation is difficult (sunset industries), exit or closure is the likely outcome. In the sunset industries, with a dwindling market share, firms may be reluctant to make R&D investment for fear of failure to recoup the cost.
We define sunset industries in the case of China as follows: first, we select the top 40 economies according to GDP in 2000, excluding China. Next, we narrow the list by keeping countries with GDP per capita 1.5 times larger than that of China and lower than US$12,000 (constant in 2005). The remaining list includes Argentina, Brazil, Czech Republic, Mexico, Yemen, Poland, Russia, Turkey, Venezuela and Zambia. Third, using these economies as a reference point, we calculate the annual growth rate of each industry by country and obtain the aggregate growth rate for all countries in the list using GDP as a weight. An industry is defined as a sunset industry if its average growth rate during the period 1998–2007 is below the median growth rate among all industries.
Panel B of Table 8.9 shows the estimates for the interaction term between wages and the ‘sunset’ industry dummy. The coefficient is statistically negative only in the regression on invention patents. Invention patents normally involve more R&D input than utility model and design patents. The results are robust when using lagged values of minimum wages in the interaction term. When market prospects loom large, the surviving firms in the sunset industries are less likely to make large investments in R&D, thereby yielding fewer invention patents than other industries. Like the economies that are slightly richer than China, firms in the sunset industries in China will likely experience slower growth and will eventually be replaced with sunrise industries.
From quality improvement to export success
A rise in labour costs means a shift in comparative advantage, away from products that are intensive in unskilled labour. Chinese firms can maintain or increase their shares in the global market only through sufficient increases in productivity or product quality to offset rising labour costs. While this exercise does not use patent data, one might consider it an examination of quality improvement and innovation broadly defined. Here we examine whether the rapid growth in patents and in innovation in general has been transformed into export success.
Product quality is not directly observed in standard trade statistics. We measure export quality following the methodology originally proposed by Khandelwal (2010) and outlined in Amiti and Khandelwal (2013) (Equation 8.2).
Equation 8.2
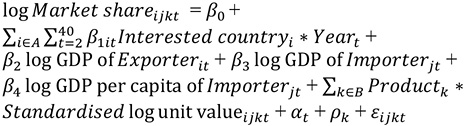
In Equation 8.2, i is the exporting country, j is the importing (or destination) country, k is the six-digit Harmonised System (HS) product code and t denotes year, covering the period 1995–2014. Market shares and unit values are defined in Equation 8.3.
Equation 8.3
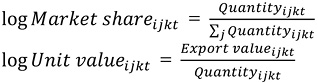
Since the unit value is influenced by many factors, such as global resource prices, it may not purely reflect production quality. To remove the impact of sector-specific shocks on unit values, we standardise the unit value by subtracting the median unit value at the sector level—that is, Standardised log Unit valueijkt = log Unit valueijkt – Median log Unit valueijkt.
We select the 40 largest economies in our sample as measured by absolute GDP. The findings are similar when using different samples, such as G20 economies or the top 70 economies measured in GDP. The group of importer countries is the same as the exporter countries, except for the BRICS countries, Germany, South Korea, Japan and the United States. The product group consists of China’s top 500 export products in 2000, according to values. β1it is the coefficient of interest to us.
We plot the estimated coefficient β1it versus per capita GDP for nine countries of interest (Germany, Japan, South Korea, the United States and the BRICS economies) in Figure 8.7. Among the countries, China, India and Germany have gained export market share as their economies grow. The other three BRICS countries (Brazil, Russia and South Africa), Japan, South Korea and the United States saw a decline in export market share during the period. Based on the measure of conditional export market share, Chinese product quality has shown a steady improvement.
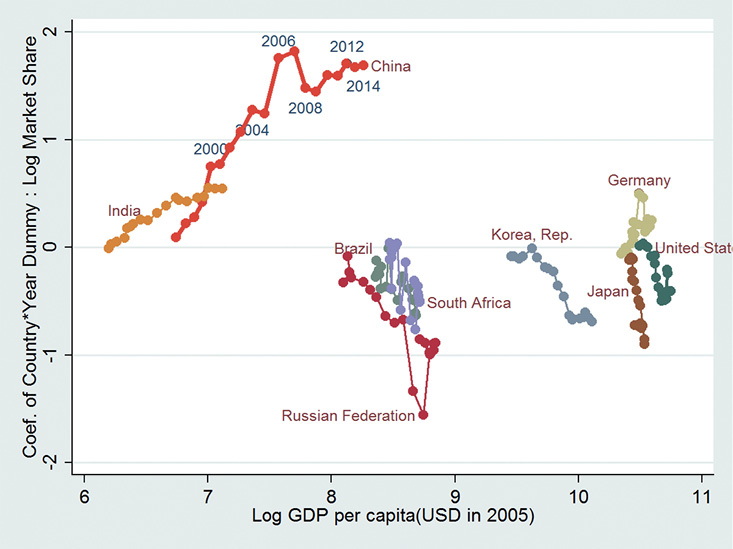
Figure 8.7 Export quality: Conditional plot of export market shares in selected countries
Note: The sample used in this figure covers G40 countries.
Source: Data from CEPII’s BACI database (www.cepii.fr/CEPII/en/bdd_modele/presentation.asp?id=1).
Misallocation of R&D resources
Because state-owned firms still command non-trivial political weights and absorb non-trivial levels of resources, including government subsidies, in this section, we study the scope for China to improve the allocation efficiency of its R&D resources between SOEs and private firms.
Following the SOE reforms in the late 1990s, the share of SOEs in the overall number of firms dropped significantly, from 18.1 per cent (or 744,240 SOEs out of 4,102,757 firms) in 1995 to 0.4 per cent (or 61,204 out of 15,300,901 firms) in 2014 (Table 8.1). Almost all small SOEs were closed or privatised during the government’s ‘grasp the large, let go of the small’ program. Most of the surviving SOEs are relatively large and are in upstream industries or strategically important sectors (Hsieh and Song 2015). They are subject to less competition than private enterprises, and, in addition, they receive more financial support from the government, such as bank loans and R&D subsidies.
Moreover, in the aftermath of both the 1997 Asian Financial Crisis and the 2008 GFC, the Chinese Government launched stimulus packages with massive liquidity injections into the economy, which were directed disproportionately to SOEs. The more favourable policies and massive stimulus funds have reduced the returns to capital of SOEs since 2008 (Bai and Zhang 2014), causing a decline in total factor productivity (TFP) in SOEs (Wu 2013) and providing a lifeline for inefficient zombie firms (Tan et al. 2016). Although the labour productivity of the remaining large SOEs converged to that of private enterprises, SOEs’ returns to capital were still much lower than their private counterparts (Hsieh and Song 2015). Overall, SOEs lagged behind private firms in TFP (Brandt 2015).
As reviewed in Boeing (2016), most studies find that the government’s R&D subsidies play a positive role in driving firms’ levels of innovation. However, the finding does not imply that R&D subsidies have been allocated efficiently. Although, on average, SOEs received more R&D subsidies than private firms, private firms have experienced much faster growth in the number of approved patents than their SOE counterparts during the period 1998–2009, as shown in Table 8.6. This suggests that there are misallocations of R&D subsidies between SOEs and private enterprises.
As shown in Figure 8.4, SOEs, especially medium-sized and small SOEs, receive more subsidies per renminbi of sales than their private sector counterparts. This likely reflects subsidies from local governments to the SOEs they own. Large private firms and SOEs appear to be treated equally, reflecting both the fact that the central government offers less subsidies than do local governments and the fact that large private firms are perhaps more effective in obtaining a ‘fair’ share of subsidies. When looking at tax rates, we find that SOEs tend to also experience a higher effective tax rate [(income tax + value-added tax)/sales] than their private sector counterparts (see Figure 8.8). In fact, total taxes net of total subsidies tend to be higher for SOEs, and especially for large SOEs (Figure 8.9).
Table 8.10 Impact of R&D on patent output: Hybrid negative binomial regressions
|
Variables |
(1) Total |
(2) Invention |
(3) Utility model |
(4) Design |
|
R&D (log)*FIE |
–0.006 |
–0.006 |
0.002 |
–0.014** |
|
(0.004) |
(0.006) |
(0.004) |
(0.006) |
|
|
R&D (log)*SOE |
–0.010** |
–0.017** |
–0.004 |
–0.014 |
|
(0.005) |
(0.007) |
(0.005) |
(0.010) |
|
|
R&D (log) |
0.016*** |
0.016*** |
0.013*** |
0.013*** |
|
(0.002) |
(0.004) |
(0.003) |
(0.004) |
|
|
Sales (log) |
0.278*** |
0.314*** |
0.259*** |
0.305*** |
|
(0.022) |
(0.040) |
(0.027) |
(0.037) |
|
|
Constant |
–5.558*** |
–7.135*** |
–4.979*** |
–6.414*** |
|
(0.071) |
(0.118) |
(0.088) |
(0.116) |
|
|
Observations |
783,229 |
783,229 |
783,229 |
783,229 |
|
Firm fixed effects |
YES |
YES |
YES |
YES |
|
Year fixed effects |
YES |
YES |
YES |
YES |
|
Akaike Information Criterion (AIC) |
298,065 |
92,655 |
190,331 |
134,819 |
** represents 5% significant level
*** represents 1% significant level
Note: Wage (log), Subsidy rate (log), Tax rate (log) and Interest rate (log) are averages at the city–industry–firm ownership type–year levels (except for the firm itself). Cells with fewer than six observations are dropped. Sales (log) and Export are still firm–year levels. Since R&D data are available only for 2005–09, we include only these four years in the sample.
Table 8.10 presents the results of a regression of the patent count on firm R&D expenditure by controlling for firm sales, firm fixed effects and year fixed effects. To evaluate whether private firms and SOEs have different elasticity regarding R&D expenditure, we interact firm ownership with R&D expenditure in the regressions. The interaction term between the SOE dummy and the R&D variable is statistically negative, indicating that the elasticity of patents granted with respect to R&D expenditure is significantly higher for private firms than for SOEs. In other words, SOEs have not spent R&D resources as efficiently as have private firms. On the surface, there is prima facie evidence that the pattern of subsidies across firms represents resource misallocation. The economy-wide innovative outcomes would have been higher if the subsidies were more evenly spread across firm ownership.
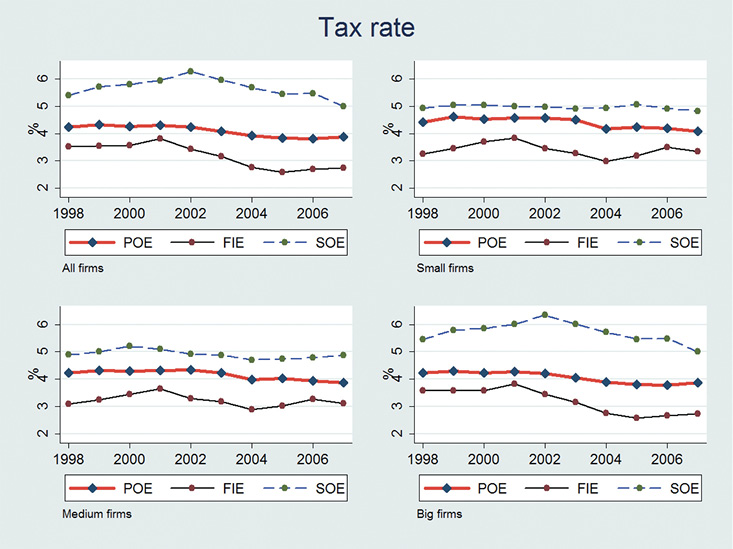
Figure 8.8 Tax rate by firm ownership and size
Note: The tax rate is defined as [(income tax + value-added tax)/sales]. According to sales, firms are divided equally into three groups: small, medium and large.
Source: Calculated by the authors based on ASIEC database.
Since subsidies and taxes use different bases, distortions are introduced if one renminbi of tax is offset by one renminbi of subsidy. Considering a lower tax rate is associated with higher levels of firm innovation, the impact of subsidies is lukewarm and private firms use R&D expenditure more efficiently than SOEs, it makes economic sense to promote reforms to: 1) simultaneously reduce tax rates and subsidies (with zero impact on government net revenue); and 2) provide subsidies only in cases where the social returns exceed private returns (such as innovative activities), without regard to firm ownership type.
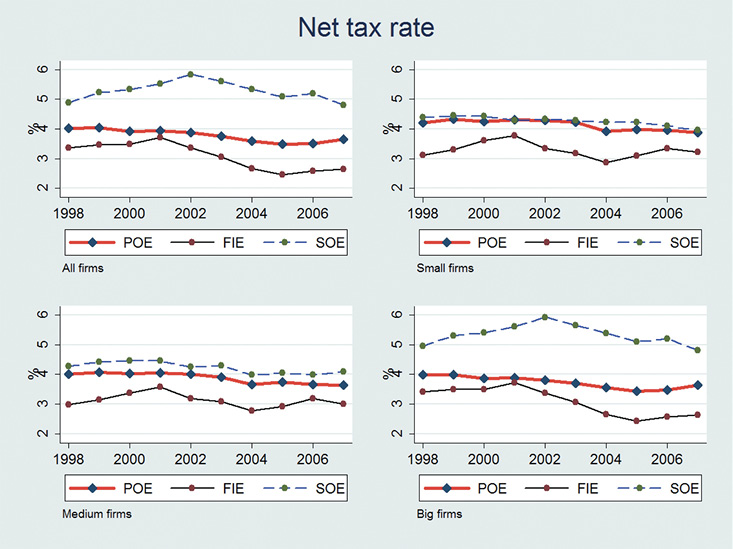
Figure 8.9 Net tax rate by firm ownership and size
Note: The net tax rate is defined as [(income tax + value-added tax – subsidy)/sales]. According to sales, firms are divided equally into three groups: small, medium and large.
Source: Calculated by the authors based on ASIEC database.
Conclusions
China’s past success in economic growth means that the real manufacturing wage has increased by about 14-fold from 1980 to 2015. A shrinking workforce since 2011 has added to pressure on wages. By implication, China has to move to a growth model that is based more on innovation and productivity increases than in the past. Can China rise to the challenge?
By examining indicators on patents, our chapter shows that Chinese firms have become increasingly more innovative, in absolute terms and also relative to other major developing economies and major patent-filing economies. Specifically, the growth of patents granted to Chinese firms both at home and in the United States compares favourably with the experience of other BRICS countries and leading OECD countries, once one takes into account the country’s size and income level. Taking advantage of the expanding global market and responding to rising labour costs are the two most important drivers of firms’ levels of innovation.
Besides the correlation between firm size and level of innovation, and between export status and level of innovation, we find a number of patterns. First, expanding market opportunities in the form of lower tariffs from trading partners tend to promote innovation. Second, firms respond to higher wages by engaging in more innovation. This is especially true for firms in labour-intensive sectors and sectors with more routine tasks. This pattern suggests some reason for optimism in terms of the prospect of Chinese firms becoming more innovative as the country’s income continues to rise. Third, Chinese products have taken an increasingly large market share after controlling for population size, economy size and the unit values of export products. The increasing competitiveness of Chinese products in the international market suggests that Chinese products have exhibited quality improvement over time.
There is some evidence that innovation responds positively to subsidies and negatively to taxes; however, subsidy allocation appears to be strongly biased in favour of SOEs, especially those owned by local governments. Yet, private sector firms exhibit a higher rate of innovation per renminbi invested in R&D than SOEs. If subsidies are meant to encourage innovation, the economy-wide innovation outcomes would have been greater if the bias towards SOEs in subsidy allocation was removed.
At the same time, the effective tax rate appears to vary not only across sectors, but also across firms. Interestingly, SOEs appear to face higher tax rates than private firms. Even after subtracting subsidies, SOEs—in particular, large ones—are still subject to higher tax burdens than private firms. This creates additional distortions. The desired direction of reforms is likely in the form of simultaneous reductions in subsidies and taxes and more uniform treatment of firms across ownership type. Levelling the playing field for firms of all ownership type, limiting the government’s discretion in allocating subsidies for R&D and ensuring private sector firms have a fair chance at receiving those subsidies would reduce resource misallocation and improve efficiency. This will complement reforms strengthening protection of intellectual property rights and to the education system.
Patents are just one form of firm innovation. Some firms keep their business secrets and do not file patents for their product or production process innovations. In addition, business model innovations have been widely observed, but these types of innovation are not discussed in this chapter. More research is needed so that the comprehensive contributions of innovation to economic growth can be assessed.
References
Acemoglu, D. and Linn, J. (2004), Market size in innovation: Theory and evidence from the pharmaceutical industry, Quarterly Journal of Economics 119(3): 1049–90. doi.org/10.1162/0033553041502144.
Allison, P. D. (2005), Fixed Effects Regression Methods for Longitudinal Data Using SAS, Cary, NC: SAS Institute.
Amiti, M. and Khandelwal, A. K. (2013), Import competition and quality upgrading, Review of Economics and Statistics 95(2): 476–90. doi.org/10.1162/REST_a_00271.
Autor, D. H., Levy, F. and Murnane, R. J. (2003), The skill content of recent technological change: An empirical exploration, Quarterly Journal of Economics 118(4): 1279–333. doi.org/10.1162/003355303322552801.
Bai, C.-E. and Zhang, Q. (2014), Returns to capital and their determinants in China, [in Chinese], World Economy 10: 2–30.
Boeing, P. (2016), The allocation and effectiveness of China’s R&D subsidies: Evidence from listed firms, Research Policy 45(9): 1774–89. doi.org/10.1016/j.respol.2016.05.007.
Brandt, L. (2015), Policy perspectives from the bottom up: What do firm level data tell China needs to do? Paper presented at the Asia Economic Policy Conference on Policy Challenges in a Diverging Global Economy, Federal Reserve Bank of San Francisco, San Francisco, 19–20 November.
Brandt, L., Tombe, T. and Zhu, X. (2013), Factor market distortions across time, space and sectors in China, Review of Economic Dynamics 16(1): 39–58. doi.org/10.1016/j.red.2012.10.002.
Cai, F. and Du, Y. (2011), Wage increases, wage convergence, and the Lewis turning point in China, China Economic Review 22(4): 601–10. doi.org/10.1016/j.chieco.2011.07.004.
Cai, F. and Wang, M. (2008), A counterfactual analysis on unlimited surplus labor in rural China, China & World Economy 16(1): 51–65. doi.org/10.1111/j.1749-124x.2008.00099.x.
Chang, S. and Zhang, X. (2015), Mating competition and entrepreneurship, Journal of Economic Behavior & Organization 116(C): 292–309. doi.org/10.1016/j.jebo.2015.05.004.
Dang, J. and Motohashi, K. (2015), Patent statistics: A good indicator for innovation in China? Patent subsidy program impacts on patent quality, China Economic Review 35(C): 137–55. doi.org/10.1016/j.chieco.2015.03.012.
Fan, S., Kanbur, R., Wei, S.-J. and Zhang, X. (eds) (2014), The Oxford Companion to the Economics of China, Oxford: Oxford University Press.
Fan, S., Zhang, X. and Robinson, S. (2003), Structural change and economic growth in China, Review of Development Economics 7(3): 360–77. doi.org/10.1111/1467-9361.00196.
Feenstra, R. and Wei, S.-J. (2010), China’s Growing Role in World Trade, Chicago: University of Chicago Press. doi.org/10.7208/chicago/9780226239729.001.0001.
Golley, J. and Meng, X. (2011), Has China run out of surplus labour? China Economic Review 22(4): 555–72. doi.org/10.1016/j.chieco.2011.07.006.
Han, X. and Wei, S.-J. (2015), Re-examining the middle income trap hypothesis (MITH): What to reject and what to revive? CEPR Discussion Paper 10989, Centre for Economic Policy Research, London.
Hsieh, C.-T. and Klenow, P. J. (2009), Misallocation and manufacturing TFP in China and India, Quarterly Journal of Economics 124(4): 1403–48. doi.org/10.1162/qjec.2009.124.4.1403.
Hsieh, C.-T. and Song, Z. (2015), Grasp the large, let go of the small: The transformation of the state sector in China, Brookings Papers on Economic Activity 50(1): 295–366.
Khandelwal, A. (2010), The long and short (of) quality ladders, Review of Economic Studies 77(4): 1450–476. doi.org/10.1111/j.1467-937X.2010.00602.x.
Knight, J., Deng, Q. and Li, S. (2011), The puzzle of migrant labour shortage and rural labour surplus in China, China Economic Review 22(4): 585–600. doi.org/10.1016/j.chieco.2011.01.006.
Lin, J. (1992), Rural reforms and agricultural growth in China, American Economic Review 82(1): 34–51.
Ma, D. (2016), Can China avoid the middle income trap? Foreign Policy, 12 March.
National Bureau of Statistics of China (NBS) (2012), China Statistical Yearbook, Beijing: China Statistics Press.
Organisation for Economic Co-operation and Development (OECD) (2013), The People’s Republic of China: Avoiding the middle-income trap—Policies for sustained and inclusive growth, September, Paris: OECD.
Qu, Y., Fang, C. and Zhang, X. (2013), Has the flying geese paradigm occurred in China? China Economist 8(6): 18–31.
Romer, P. M. (1990), Endogenous technological change, Journal of Political Economy 98(5): S71–S102. doi.org/10.1086/261725.
Tan, Y., Huang, Y. and Woo, W. T. (2016), Zombie firms and the crowding-out of private investment in China, Asian Economic Papers 15(3). doi.org/10.1162/ASEP_a_00474.
Wang, X., Huang, J., Zhang, L. and Rozelle, S. (2011), The rise of migration and the fall of self-employment in rural China’s labor market, China Economic Review 22(4): 573–84. doi.org/10.1016/j.chieco.2011.07.005.
Wei, S.-J. (2015), The recent change in China’s population policy and its implications for China and the world economy, Keynote address to the Asia Economic Policy Conference, Federal Reserve Bank of San Francisco, San Francisco, 19–20 November.
Wei, S.-J. and Zhang, X. (2011a), The competitive saving motive: Evidence from rising sex ratios and savings in China, Journal of Political Economy 119(3): 511–64. doi.org/10.1086/660887.
Wei, S.-J. and Zhang, X. (2011b), Sex ratios, entrepreneurship and economic growth in the People’s Republic of China, NBER Working Paper No. 16800, National Bureau of Economic Research, Cambridge, Mass.
Wei, S.-J., Zhang, X. and Liu, Y. (2016), Home ownership as status competition: Some theory and evidence, Journal of Development Economics. First published online, 21 December. doi.org/10.1016/j.jdeveco.2016.12.001.
World Intellectual Property Organization (WIPO) (various years), World Intellectual Property Indicators, Geneva: WIPO.
Wu, H. X. (2013), Measuring and interpreting total factor productivity in Chinese industry, Comparative Studies 69. Available from: magazine.caixin.com/2013/cs_69/.
Xie, Z. and Zhang, X. (2015), The patterns of patents in China, China Economic Journal 8(2): 122–42.
Xu, C. and Zhang, X. (2009), The evolution of Chinese entrepreneurial firms: Township–village enterprises revisited, Discussion Paper No. 0854, International Food Policy Research Institute, Washington, DC.
Zhang, X., Yang, J. and Wang, S. (2011), China has reached the Lewis turning point, China Economic Review 22(4): 542–54. doi.org/10.1016/j.chieco.2011.07.002.
Zhu, X. (2012), Understanding China’s growth: Past, present, and future, Journal of Economic Perspectives 26(4): 103–24. doi.org/10.1257/jep.26.4.103.
Appendix 8.1. Data
The export data come from the BACI database developed by the French Centre d’Etudes Prospectives et d’Informations Internationales (Centre for Prospective Studies and International Information, CEPII) at a high level of product disaggregation. Original data are provided by the United Nations Statistical Division’s Comtrade database. BACI is constructed using an original procedure that reconciles the declarations of the exporter and the importer. This harmonisation procedure considerably extends the number of countries for which trade data are available, compared with the original dataset. BACI provides bilateral values and quantities of exports at the HS six-digit product disaggregation for more than 200 countries since 1995. It is updated every year. For more information, see: www.cepii.fr/CEPII/en/bdd_modele/presentation.asp?id=1.
The authors tabulated the total number of existing firms and new firms based on China’s company registry database. The patent data used for international comparison come from WIPO and the USPTO.
The data used in regression tables are based on a merged firm patent database (1998–2009) of the national patent database from SIPO and the database of the ASIEC.
Appendix 8.2. Additional tables
Table 8.A1 Hybrid negative binomial regression on patent count: Using lagged wages
|
Variables |
(1) Total |
(2) Invention |
(3) Utility |
(4) Design |
|
Sales (log) |
0.419*** |
0.454*** |
0.418*** |
0.416*** |
|
(0.013) |
(0.026) |
(0.016) |
(0.021) |
|
|
Export |
0.119*** |
0.172*** |
0.065** |
0.161*** |
|
(0.025) |
(0.049) |
(0.031) |
(0.041) |
|
|
Lag wage (log) |
0.510*** |
0.890*** |
0.790*** |
0.541*** |
|
(0.058) |
(0.113) |
(0.074) |
(0.090) |
|
|
Subsidy rate (log) |
–0.007 |
0.033*** |
–0.009 |
–0.003 |
|
(0.006) |
(0.012) |
(0.008) |
(0.010) |
|
|
Tax rate (log) |
–0.067*** |
–0.057 |
–0.080*** |
–0.036 |
|
(0.020) |
(0.036) |
(0.025) |
(0.032) |
|
|
Interest rate (log) |
–0.018 |
0.017 |
–0.034** |
–0.031* |
|
(0.011) |
(0.021) |
(0.014) |
(0.019) |
|
|
Partner tariff |
–0.850*** |
–0.314* |
–0.666*** |
–0.454*** |
|
(0.091) |
(0.171) |
(0.131) |
(0.140) |
|
|
HH index |
0.238 |
–0.092 |
0.622** |
0.337 |
|
(0.240) |
(0.429) |
(0.279) |
(0.361) |
|
|
Observations |
984,517 |
984,517 |
984,517 |
984,517 |
|
Firm fixed effects |
YES |
YES |
YES |
YES |
|
Year fixed effects |
YES |
YES |
YES |
YES |
|
Akaike Information Criterion (AIC) |
368,333 |
99,218 |
229,716 |
173,836 |
* represents 10% significant level
** represents 5% significant level
*** represents 1% significant level
Notes: Wage (log), Subsidy rate (log), Tax rate (log) and Interest rate (log) are averages at the city–industry–firm ownership type–year levels (except for the firm itself). Cells with fewer than six observations are dropped. Sales (log) and Export are still firm–year levels. The value of the wage variable is lagged by one year.
Table 8.A2 Hybrid negative binomial regression on the patent count: Using minimum wages
|
Variables |
(1) Total |
(2) Invention |
(3) Utility |
(4) Design |
|
Sales (log) |
0.430*** |
0.441*** |
0.434*** |
0.435*** |
|
(1.126) |
(2.186) |
(1.424) |
(1.793) |
|
|
Export |
0.104*** |
0.172*** |
0.065** |
0.148*** |
|
(2.208) |
(4.351) |
(2.772) |
(3.559) |
|
|
Minimum wage (log) |
0.318*** |
0.484*** |
0.607*** |
0.371*** |
|
(4.890) |
(9.569) |
(6.354) |
(7.597) |
|
|
Subsidy rate (log) |
–0.003 |
0.017* |
–0.005 |
–0.013 |
|
(0.526) |
(0.978) |
(0.664) |
(0.859) |
|
|
Tax rate (log) |
0.050** |
0.115*** |
0.026 |
0.053* |
|
(1.994) |
(3.774) |
(2.523) |
(3.130) |
|
|
Interest rate (log) |
–0.012 |
–0.006 |
–0.040*** |
0.014 |
|
(1.140) |
(2.277) |
(1.407) |
(1.829) |
|
|
Partner tariff |
–9.156*** |
–6.279** |
–8.354*** |
–4.772*** |
|
(112.564) |
(258.170) |
(184.781) |
(127.120) |
|
|
HH index |
0.358 |
0.085 |
0.486* |
0.517 |
|
(21.901) |
(38.670) |
(26.178) |
(33.429) |
|
|
Observations |
1,305,376 |
1,305,376 |
1,305,376 |
1,305,376 |
|
Firm fixed effects |
YES |
YES |
YES |
YES |
|
Year fixed effects |
YES |
YES |
YES |
YES |
|
Akaike Information Criterion (AIC) |
461,094 |
124,633 |
283,566 |
217,422 |
* represents 10% significant level
** represents 5% significant level
*** represents 1% significant level
Notes: Wage (log), Subsidy rate (log), Tax rate (log) and Interest rate (log) are averages at the city–industry–firm ownership type–year levels (except for the firm itself). Cells with fewer than six observations are dropped. Sales (log) and Export are still firm–year levels. Minimum wages are at the city and year levels.
1 We thank Journal of Economic Perspectives editors Gordon Hanson, Enrico Moretti and especially Timothy Taylor for very helpful comments and suggestions. We are also grateful for comments received at seminars/conferences held at Hong Kong Baptist University, New York University, University of Michigan and University of Western Australia, and support from the Natural Science Foundation of China (approval number 71350002), the National Science Foundation (approval number 7675172) and the key research base of China’s Ministry of Education (14JJD790027). We thank Lea Sumulong and Joy Glazener for excellent editorial assistance and Lintong Lin for outstanding research assistance. The chapter represents the personal views of the authors and not necessarily those of the institutions with which they are affiliated. A shorter version of the chapter has been published as ‘From “made in China” to “innovated in China”: Necessity, prospect, and challenges’ in the Journal of Economic Perspectives (31(1): 49–70, 2017). The journal has granted permission to reprint the article here.
3 While ASIEC data for 2010–14 float on the grey market, the quality appears suspect. To be conservative, we do not use these data in this chapter.
4 We use Standard Industrial Classification two-digit (SIC-2) code mainly to improve the matching rate.
5 The HH index is calculated via the following steps: 1) for every four-digit industry and year t, compute each firm’s market share; 2) for every four-digit industry and year t, sum the square of each firm’s market share. The higher the HH index, the lower is the degree of competition.
6 As robustness checks, we have implemented other specifications as well, such as the fixed effect negative binomial model, the random effect negative binomial model and the fixed effect ordinal linear probability model. The coefficients for most variables are qualitatively similar and therefore robust.
Previous Next



