


 menu
A Bark But No Bite
1
The 2014 New Zealand election in perspective
The central theme of this book is how and why social and economic inequality affected the campaign and the outcome of the 2014 general election in New Zealand. Discourse about inequality before and during the campaign posed a puzzle that is our main focus of inquiry: according to the assumptions of many observers, the discussion should have benefited the centre-left, but did not. While the distribution of wealth and income is not a new theme in New Zealand politics, and while differences between social groups have always been at the root of party choice in New Zealand, this may well have been the first election since the 1940s in which social and economic equality, expressed as a principle, was seen to play such an explicit role. Yet it had so few apparent consequences.
This is the puzzle central to our book. As explained in Chapter 3, an important strand of theory in political economy suggests that increasing levels of inequality, if real, should push more people to the left in their party choices, since left-wing parties are expected to do more than others to redistribute income and wealth. But some argue to the contrary in the form of a disempowerment hypothesis: that increasing inequality may instead suppress political engagement among those who are most adversely affected. Inequality is a lively topic in political science, particularly in the United States, where levels of inequality are among the highest in the developed world (Bartels 2008, 2016; Schlozman, Verba and Brady 2012). Indeed, the American Political Science Association commissioned a special report on the matter in 2001 (Task Force on Inequality and American Democracy 2004). Theories and current debates within political science frame much of our inquiry. In particular, we consider one influential brand of theory that ‘solves’ the puzzle because it assumes ordinary people think little about ‘issues’ and respond more in their political behaviour by way of their emotions, group loyalties and perceptions about government competence. While this ‘solution’ is partly correct, we argue that it is not entirely so.
Because inequality ‘barked but did not bite’ at the 2014 election, we describe it not as ‘an inequality election’, but instead as an ‘unequal election’. The election was ‘unequal’ for three reasons. First, and most of all, like many other post-industrial democracies, in 2014 New Zealand was a more unequal society than it had been 30 years earlier, and debate was emerging about what could and should be done about it. Second, the election itself was unequal in the sense that the centre-right National Party was by far the largest party in votes cast and seats won, and had a further advantage by having much more money than its rivals to spend on its campaign and its activities in general. Third, the election was unequal since despite discussions about declining class voting in most post-industrialised societies, economic inequalities continued to underpin the social foundations of voting choices between the parties. These economic inequalities and their associated patterns of vote choice are also crosscut and intensified by social inequalities between women and men and between ethnic groups, most notably between indigenous Māori and the European or Pākehā majority.1
This chapter begins our inquiries. It first describes the historical context, the election results and the government that formed as a result, the flows of the votes between the 2011 and 2014 elections, and party policy positions. Next, it explores the issues voters considered most salient in the 2014 election. We are particularly interested in knowing how important the issue of inequality was to voters, and which parties they considered best able to address it.
Reviewing the results
The 2014 General Election in New Zealand was the country’s seventh election under the Mixed Member Proportional (MMP) electoral system, and resulted in a third consecutive victory for the New Zealand National Party. The result was not unexpected. The National Party has been the country’s most successful political party since 1949, and has never held office for less than three consecutive parliamentary terms. Indeed, prior to 1972, its two experiences of government were underpinned by four successful elections in a row.
On the morning after the 2014 election, national media were proclaiming National’s win as a triumphant and historically significant ‘landslide’. Several commentators considered the 2014 result remarkable, in part because National’s share of the vote increased marginally on election night and the party increased its share of parliamentary seats—although as it turned out, only by one. After the initial count, it appeared the election had broken three records. First, on election night figures National had won 61 seats; sufficient seats to govern alone, a rare event in any proportional representation system. This would have been a new experience in New Zealand’s history of MMP. Even Germany has only experienced a single party majority government once, in 1957, and MMP has been that country’s electoral system since 1949. Second, National had apparently increased its vote share, unusual for an incumbent government gaining its third term of office. Third, the centre-left Labour Party’s vote share was the lowest since 1922.
Neither of the first two ‘records’ stood up more than a few days. On election night, it looked as if the National Party’s winning vote share would be 48 per cent; larger than its vote shares in 2008 and 2011. This would have been the first time that a third-term government had increased its margin in almost 90 years. As can be seen from Table 1.1, at the final count including special votes, National’s party vote was 47 per cent, 0.3 per cent less than in 2011, but 3 per cent more than when it first won government in 2008.2 Its seat count fell to 60, one seat short of an absolute majority.3
The third record did stand, and was sobering for those on the left. The Labour Party’s vote share dropped to 25 per cent. Even when Helen Clark’s Labour-led government was defeated in 2008 after three terms in office, its vote had been 9 percentage points higher. In the end, Labour’s count of electorate seats increased from 22 in 2011 to 27 in 2014, but Labour’s number of list seats more than halved: from 12 in 2011 to five in 2014.
Table 1.1: The party and electorate votes, New Zealand elections, 2008–2014
|
2008 |
2011 |
2014 |
||||
|
% Vote |
Seats |
% Vote |
Seats |
% Vote |
Seats |
|
|
National Party (total seats) |
58 |
59 |
60 |
|||
|
Party Vote (list seats) |
44.9 |
17 |
47.3 |
17 |
47.0 |
19 |
|
Electorate Vote (seats) |
46.6 |
41 |
47.3 |
42 |
46.1 |
41 |
|
Labour Party (total seats) |
43 |
34 |
32 |
|||
|
Party Vote (list seats) |
34.0 |
22 |
27.5 |
12 |
25.1 |
5 |
|
Electorate Vote (seats) |
35.2 |
21 |
35.1 |
22 |
34.1 |
27 |
|
Green Party (total seats) |
9 |
14 |
14 |
|||
|
Party Vote (list seats) |
6.7 |
9 |
11.1 |
14 |
10.7 |
14 |
|
Electorate Vote (seats) |
5.6 |
0 |
7.2 |
0 |
7.1 |
0 |
|
NZ First Party (total seats) |
0 |
8 |
11 |
|||
|
Party Vote (list seats) |
4.1 |
0 |
6.6 |
8 |
8.7 |
11 |
|
Electorate Vote (seats) |
1.7 |
0 |
1.8 |
0 |
3.1 |
0 |
|
Conservative (total seats) |
- |
- |
0 |
0 |
||
|
Party Vote (list seats) |
2.7 |
0 |
4.0 |
0 |
||
|
Electorate Vote (seats) |
2.4 |
0 |
3.5 |
0 |
||
|
MANA/Internet-MANA1 |
- |
- |
1 |
0 |
||
|
Party Vote (list seats) |
1.1 |
0 |
1.4 |
0 |
||
|
Electorate Vote (seats) |
1.4 |
1 |
1.7 |
0 |
||
|
Māori Party (total seats) |
5 |
3 |
2 |
|||
|
Party Vote (list seats) |
2.4 |
0 |
1.4 |
0 |
1.3 |
1 |
|
Electorate Vote (seats) |
3.3 |
5 |
1.8 |
3 |
1.8 |
1 |
|
ACT (total seats)2 |
5 |
1 |
1 |
|||
|
Party Vote (list seats) |
3.7 |
4 |
1.1 |
0 |
0.7 |
0 |
|
Electorate Vote (seats) |
3.0 |
1 |
1.4 |
1 |
1.2 |
1 |
|
United Future (total seats) |
1 |
1 |
1 |
|||
|
Party Vote (list seats) |
0.9 |
0 |
0.6 |
0 |
0.2 |
0 |
|
Electorate Vote (seats) |
1.1 |
1 |
0.9 |
1 |
0.6 |
1 |
|
Jim Anderton’s Progressive |
1 |
- |
- |
- |
- |
|
|
Party Vote (list seats) |
0.9 |
0 |
||||
|
Electorate Vote (seats) |
1.1 |
1 |
||||
|
Others (total seats) |
0 |
0 |
0 |
|||
|
Party Vote (list seats) |
2.8 |
0 |
0.7 |
0 |
0.9 |
0 |
|
Electorate Vote (seats) |
2.1 |
0 |
0.2 |
0 |
0.9 |
0 |
|
Total |
122 |
121 |
121 |
|||
Note: Full results can be found on the New Zealand Electoral Commission’s results pages for the 2008, 2011, and 2014 elections (Electoral Commission 2008, 2011, 2014a). Seat shares for the ACT, Māori, United Future, MANA, and Jim Anderton’s Progressive parties come from their capture of at least one electorate seat, allowing them to cross the threshold for representation under MMP without the 5 per cent otherwise required in the party vote. In 2008, New Zealand First failed to cross the threshold by either means.
1 MANA alone in 2011. In 2014, MANA formed an electoral alliance with the Internet Party for the party vote, with the two parties running individually in some electorate seats.
2 ACT began as the Association of Consumers and Taxpayers, it derives it current name from this original party.
The Green Party retained the 14 list seats it had won in 2011, but made no gains. The populist New Zealand First Party increased its number of list seats: from eight in 2011 to 11 in 2014. Of the small parties, the Māori Party lost one seat, leaving only two representatives in parliament (one list and one electorate MP). Neo-liberal ACT and centre-liberal United Future each won one electorate seat, both of which they had held in 2011. Neither the Conservative Party nor the left-wing Internet-MANA alliance crossed the threshold for representation, failing to attain 5 per cent of the party vote and not winning an electorate seat.
However, the presence of Internet-MANA did matter to the campaign and to the results. Contesting extradition to the United States for alleged intellectual property theft, German internet entrepreneur Kim Dotcom had helped to create and fund the Internet Party. The party campaigned against breaches of privacy and civil liberties and against mass surveillance, and sought to mobilise the young. It formed an alliance with the MANA Movement that championed left-leaning policies on Māori self-determination, poverty reduction, wage equality and tertiary education reform. Although the policies had some support, this two-party alliance was unable to disentangle itself from Dotcom. Many voters appeared nervous about his political motives and National played to these fears, relentlessly suggesting that Internet-MANA could create havoc if it held pivotal seats backing a centre-left coalition.
As with all elections, the 2014 electoral contest exhibited other unique features. The campaign was disrupted by the publication of the book Dirty Politics (Hager 2014), which alleged that ministers and officials serving the National government were engaged in apparently dirty tactics. Labelled by the US-based broadcaster CNN as describing a South Pacific ‘House of Cards’, the book made headlines for two weeks of the campaign and was a potential disaster for the National-led government (Hume 2014). The furore that resulted drew attention away from policy and issue debates for two weeks. But, for the most part, it was campaign business more or less as usual. There was a continued focus on the economy, understandable in the wake of the global financial crisis (GFC); however, as we shall see later in this chapter, traditional concerns like health and education moved into the background. Instead, the issue of inequality emerged to apparently replace them.
Government formation took place smoothly in the days after the election. Government party composition remained the same as that after the previous two elections in 2008 and 2011. Formally, the government can be classified as of minority single-party status, as it has a Cabinet entirely composed of National Party MPs. The government’s parliamentary majority on matters of confidence and supply is secured by agreements with the ACT, United Future and Māori parties. United Future MP Peter Dunne and Māori Party leader Te Ururoa Flavell were appointed to ministerial positions outside Cabinet, and ACT MP David Seymour as a Parliamentary Under-Secretary.
Despite the over-excited commentary of some media personalities on election night, the 2014 election was no ‘landslide’. From the official party vote data displayed in Table 1.1, one can calculate aggregate net vote shifts: they were just under 6 per cent between the parties in 2014 and 2011, the smallest since 1963, and the third smallest since 1908 (Vowles 2014b: 34).4 Of course, the changes in vote shares recorded in the official results conceal considerable movement among individuals, and examination of shifts at the individual level uncovers much more information about the movements of votes between the 2011 and 2014 elections. Indeed, much of our later analysis attempts to separate out the behaviour of those who stayed with the same parties, and those who shifted their votes.
Table 1.2: Flow of the party votes, 2011–2014 (total percentages)
|
2014 Vote |
|||||||||
|
2011 Vote |
No Vote |
Labour |
National |
Green |
NZ First |
Māori Party |
Conservative |
Other |
Total |
|
No Vote |
12.6 |
2.7 |
5.1 |
1.5 |
2.8 |
0.2 |
0.5 |
0.4 |
25.9 |
|
Labour |
2.7 |
12.5 |
1.5 |
1.7 |
1.3 |
0.1 |
0.4 |
0.3 |
20.4 |
|
National |
5.5 |
0.6 |
26.6 |
0.7 |
0.7 |
0.2 |
0.7 |
0.2 |
35.1 |
|
Green |
0.5 |
2.0 |
0.9 |
3.8 |
0.8 |
0.0 |
0.2 |
0.1 |
8.2 |
|
NZ First |
0.7 |
1.1 |
0.5 |
0.1 |
2.2 |
0.1 |
0.2 |
0.1 |
4.9 |
|
Māori |
0.2 |
0.1 |
0.2 |
0.0 |
0.1 |
0.3 |
0.0 |
0.0 |
0.9 |
|
Conservative |
0.5 |
0.0 |
0.4 |
0.1 |
0.2 |
0.0 |
0.7 |
0.2 |
2.0 |
|
Other |
0.6 |
0.4 |
0.7 |
0.3 |
0.1 |
0.3 |
0.1 |
0.5 |
2.8 |
|
Total |
23.3 |
19.2 |
36.0 |
8.2 |
8.0 |
0.9 |
2.7 |
1.8 |
100.0 |
Notes: Percentages are of the total. N=1,313. Cell and marginal percentages do not add up exactly to 100 due to rounding.
Source: New Zealand Election Study 2014. The data is weighted to conform with voting and non-voting patterns in 2011 and 2014.
We draw this information from the New Zealand Election Study (NZES), which is our main source of data for this book. As explained in more detail later in this chapter, the NZES is based on a random sample of eligible voters, taken from the electoral rolls. Part of the NZES sample goes back to people who responded at the previous election, and merges the responses at time t (the election in question) and t – 1(the election before). This means that we can construct a panel containing responses from both elections—in this case, 2011 and 2014. The NZES also asks people in 2014 how they voted in 2011, but there is a great deal of evidence that too many people misremember their previous behaviour. Using data from the panel avoids this recall error problem. NZES data is also validated: whether respondents voted or not was checked against official data at each election, further reducing error.
Table 1.2 lays out how votes flowed between the two elections among NZES panel respondents. It is important to note that numbers of respondents in many of the cells in the table are very small, so any inferences we might draw from those cells or even from combinations of cells must be cautious at best. Shaded cells indicate the voters who made the same voting choice in both elections. Of the entire electorate (those enrolled to vote), 46 per cent remained true to their previous party. Of those who did vote in 2014, 39 per cent made a different choice than they did in 2011. That could include a shift from not voting in 2011 to voting in 2014. This individual-level volatility is very similar to that of 2008 and 2011, but much lower than that of 2005 and 2002; the latter two elections being marked by the highest levels of individual-level vote shifts in New Zealand elections since 1935. The individual-level volatility does indicate considerable ‘churning’: people moved between parties, but many offset each other by going in opposite directions.
The results of the election were not unexpected. National Party prime minister John Key had experienced exceptionally high leadership ratings in polls in the six years leading up to the 2014 election. In July 2014, according to one Digipoll survey, his popularity stood at 73 per cent (Curia 2014). His ratings remained resilient despite the publication of Dirty Politics, even when the fallout from that book indirectly claimed the scalp of cabinet minister Judith Collins three weeks before the election. Indeed, Key’s rating a week before the election, at 61 per cent, was still almost 45 points ahead of his closest rival, Labour’s David Cunliffe (James 2015). By contrast, Labour had endured several leadership challenges in the years since Clark retired, with limited electoral success; indeed, after each change, the party’s polling mostly got worse. As in most parliamentary elections around the world, the pulling power of effective leadership is very important.
Alongside this, Key has presided over a long period of relatively slow but steady economic growth as New Zealand recovered from the effects of the GFC. While theories of voting that highlight economic factors may no longer have the same explanatory capacity as once thought, the National government had overseen an economy in which ‘middle New Zealand’ felt comfortable. In the first quarter of 2009, the annual growth rate reached a record low of –3.4 per cent, but the economy emerged from this trough to reach 3.9 per cent in the second quarter of 2014. A week before the election, New Zealand’s biggest circulation daily newspaper, the New Zealand Herald, published a survey of corporate chief executive officers (CEOs): the ‘Mood of the Boardroom’. It revealed that 97 per cent of the 114 CEOs questioned supported a National government (New Zealand Herald 2014). Housing affordability and increasing inequality might have played on some voters’ minds, but many observers and commentators find it puzzling that these problems did not dent National’s claim to be the party of good economic management. In John Key’s own words, the National Party had ‘hugged the centre ground’ (Foley 2014). Key’s government had done its utmost to appeal to the median voter—the person in the middle if all voters were to be lined up from left to right.
The distribution of voters along this left–right continuum is therefore the next port of call for analysis. As the left is traditionally identified with efforts to reduce inequality, and the right tends to resist them, this returns us to the main theme of this book. Since 1990, the NZES has asked survey respondents to position themselves and the political parties on the left–right scale with most left at 0 and most right at 10. This way of estimating people’s ideological positions can be criticised, as it is a very general measure and not everyone thinks in this left–right way. But many do, and assign themselves accordingly.
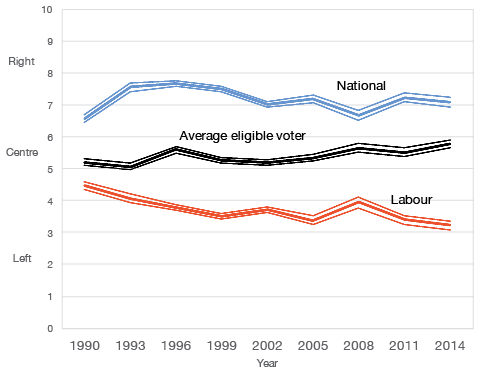
Figure 1.1: Eligible voters and their ratings of the National and Labour parties on the left–right scale, 1990–2014
Note: Average ratings with 95 per cent confidence intervals.
Source: New Zealand Election Study 1990, 1993, 1996, 1999, 2002, 2005, 2008, 2011, 2014.
A time series since 1990 shows distinct trends among those able and willing to rate themselves and the parties on a left–right continuum. The starting point of 1990 represents an unusual election, a moment when the National Party presented itself as closer to the centre than it turned out to be once it took office, after Labour had moved significantly to the right in its social and economic policies during the 1980s. In 1993 and 1996, National was placed above 7.7 on the left–right scale. By 2008, according to the NZES respondents, the party had moved closer to the centre at 6.7. Meanwhile, NZES respondents have perceived the Labour Party to have moved steadily to the left, except for temporary minor rightward shifts in 2002 and 2008. Respondents themselves have moved to the right, from an average of 5.1 in 1990 on the scale to nearly 5.9 in 2014. Respondent evaluations reflect general impressions rather than intense study of party promises and policies, but such impressions are important. Content analysis of party promises also confirms Labour’s shift to the left post-1990, although National’s movement to the centre is not so apparent (Gibbons 2011: 53). As in all figures drawing on NZES data, we show 95 per cent confidence intervals.5
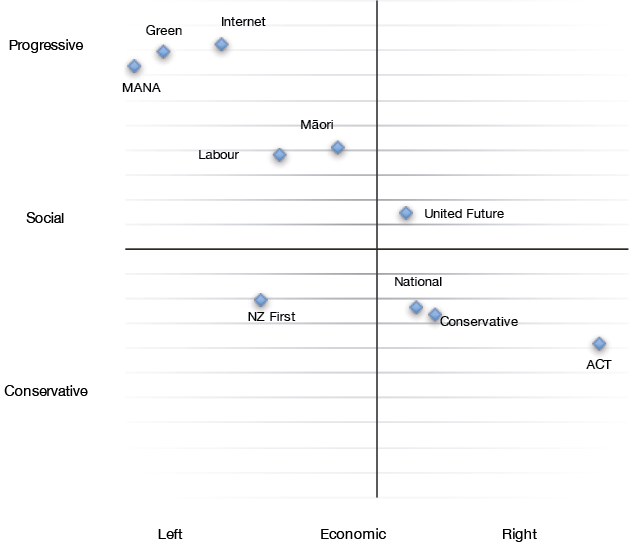
Figure 1.2: Party positions, New Zealand general election of 2014
Source: Vote Compass New Zealand 2014, Lees-Marshment et al. 2015.
Thanks are due to Clifton van der Linden for his agreement to use this data. Left–right issues were the rich–poor gap, the value of government spending, trickle-down economics, increasing the gap of New Zealand superannuation, the amount of the minimum wage, the private role in health care, free doctor visits for children, more or less for welfare recipients, business tax, tax on the wealthy, a capital gains tax, education (three questions) and housing policy (two questions). Progressive–Conservative issues were funding the Department of Conservation, fracking, the Christchurch rebuild, corporal punishment, sentences for crime, immigration, foreign ownership of farmland, the Treaty of Waitangi, Māori self-determination, support for the Māori language, the age threshold for alcohol purchase, legalisation of marijuana, and abortion.
Figure 1.2 plots the relative positions of the political parties, calibrated by a team of political scientists and research assistants who worked on Vote Compass (a ‘Voting Advice Application’ sponsored by Television New Zealand’s One News during the election campaign). Party responses were coded from the various parties’ policy statements, and parties were also given an opportunity to respond and ask for corrections if they wished. Thirty issue areas were defined, and chosen so that they made up a two-dimensional policy space reflecting economic left and right, and ‘progressive/liberal’ and ‘conservative’ positions (for a detailed description of the methodology and results see Lees-Marshment et al. 2015). People using the site answered the same questions as the parties, and were informed how closely their positions aligned with those of the various parties. The placing of the various parties on these two dimensions should come as little surprise to most. The most unexpected result of the calibration was the position of New Zealand First—slightly to the left of Labour on the economic left–right dimension—but few commented at the time. The two dimensions correlate to some extent; there is clustering to the left-liberal side, and to the conservative right. New Zealand First is the most obvious outlier, positioned on the conservative left. Later chapters will explore the positioning of these parties and their voters in more depth.
As we shall explain further in Chapter 3, the left–right ideological dimension is a crucial tool in our analysis and one that is recognised by many people, if not all. But it is an obvious simplification of a much more complex pattern of preferences and opinions. The most obvious way to address this problem is to identify a second dimension that also has resonance in public opinions and preferences. We choose to call it authoritarian–libertarian, but it has been described variously as progressive–conservative or materialist–postmaterialist. Its theoretical basis and surrounding literature will be explained further in Chapter 3, but we introduce it here to map the party positions as background to the voter left–right positions introduced above. As later chapters will explain, political differences across this second dimension tend to crosscut the left–right dimension, and can reduce the salience of questions of equality and inequality in political debate.
Issue salience
We now turn back to the voters, to inquire into what lies beneath voters’ policy positions, and which issues voters considered the most salient, thereby paying particular attention to inequality and its associated dimensions. Asked for the single most important issue in the 2014 General Election, in an open-ended question, NZES respondents were classified as presented in Figure 1.3.
Interpreting their responses, we found respondents pitched overwhelmingly for the economy (at 18 per cent). The second most salient issue was a broad category of ‘governance’, chosen by 11 per cent. According to our coding of 2014 NZES respondents, directly expressed as a general principle, inequality was the third most important issue of the 2014 election, chosen by just over 7 per cent. But other responses also addressed inequality and poverty more indirectly, particularly under ‘housing’ and ‘children and family’, under which child poverty was classified. Adding all these together, inequality in principle and practice moves into second place.
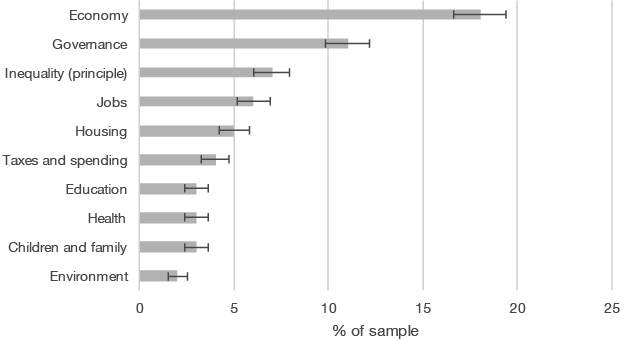
Figure 1.3: Issue most important in 2014 election as reported by respondents
Notes: The question was: ‘What do you feel was the single most important issue in the 2014 Election?’ Responses were open-ended, and coded into 24 categories. The categories presented in Figure 1.3 are those that were mentioned by at least 2 per cent of the respondents. The categories falling below 2 per cent and therefore not presented in Figure 1.3 were cost of living, law and order, foreign ownership, the political system, superannuation and the elderly, social programs/welfare, moral and social issues, immigration, Māori issues, the Christchurch earthquake, civil liberties, privatisation, media, and international. Twenty-one per cent of the respondents did not respond to the question, and 4 per cent could not name an issue or named more than one.
Source: New Zealand Election Study 2014.
Health and education have traditionally rivalled the economy as matters of concern to New Zealand voters (Vowles 2004a). As can be seen from Figure 1.3, in 2014 health and education were each named as most salient by only 3 per cent. In 2002, when asked in a similar open-ended format for ‘the most important issue facing New Zealand in the last three years’, very few mentioned any concerns tapping into inequality in either specific or general terms (Vowles 2004a: 43). We can see that the salience of health and education has significantly decreased in New Zealand politics over the last 10 years. A decrease in salience can also be observed for the economy, as almost 30 per cent responding to the 2008 NZES named the economy as the most important issue. At the height of the GFC this was as expected. We also observe that the issues associated with the progressive–conservative or libertarian–authoritarian dimension had relatively low salience in 2014.
There has been much recent discussion about inequality in New Zealand (e.g. Bertram 2014; Boston 2013; Rashbrooke 2013; Statistics New Zealand 2016a), and attention to inequality seems stronger among New Zealanders in 2014 compared with previous election campaigns. In more depth, Figure 1.4 compares the importance of the issue of inequality over time. It relies on various waves of the NZES and is based on counts of the use of the words ‘inequality’, ‘poverty’, the ‘rich and poor’ or ‘income and/or wealth distribution’ when respondents were asked open-ended questions asking what issue they found most important. Where more than one of these words appeared in a response, it was only counted as one.
Figure 1.4 shows a large increase in the use of words associated with inequality in 2014, from less than 1 per cent of the respondents mentioning inequality-related issues in 2008 to 11 per cent of the respondents referring to it in 2014. Unfortunately, this question was not asked in 2011.
People may be concerned about inequality, but what they would like to see done about it matters most. Analysis of social policy opinions in New Zealand over the period since 1990 shows that preferences for generous government spending on health and education have remained relatively high, but preferences for more expenditure on unemployment and welfare benefits have been in decline (Humpage 2014). Cuts to welfare benefits in the early 1990s were one of the contributing causes of the increase in inequality (see Chapter 2). More recent governments have sought to further reduce those expenditures, most recently by moving beneficiaries and unemployed people back into work as soon as possible. But it seems that some New Zealanders have begun to worry about aspects of this. Following how these preferences have changed over time indicates that people appear to be happy to continue to support government expenditure where provision is universal; everyone benefits from public health and education systems at some time in their lives—in the case of education, first as children, and then as parents.
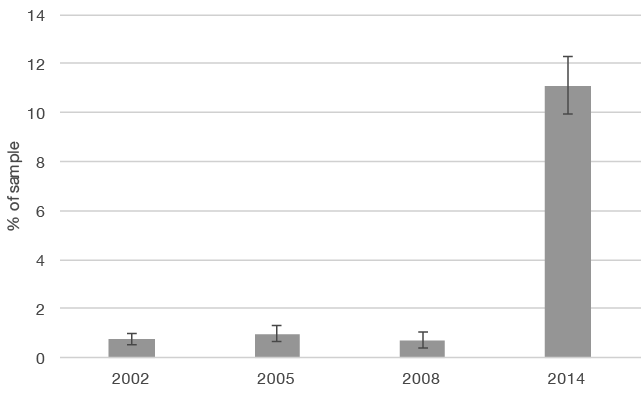
Figure 1.4: Percentage of respondents directly referring to inequality, poverty, rich and poor, or wealth distribution
Note: The questions were: 2002, 2005: ‘What do you think has been the most important issue facing New Zealand over the last three years?’; 2008: ‘What do you think is the most important political problem facing New Zealand today?’; 2014: ‘What do you feel was the single most important issue in the 2014 election?’
Where provision is targeted, New Zealanders have become more reluctant to support it. Not everyone expects to go on a benefit or to be unemployed. Yet, since 2008 and the GFC, more people have become exposed to job insecurity. Over the longer term, changes in social structure and in the labour market have increased the proportion of people exposed to economic risks. More people are in insecure jobs. Union coverage is now relatively low in New Zealand, particularly in the private sector. In 2014, the time was ripe for increased concern about inequality, insecurity and poverty.
The issue of inequality in the public debate
The issue of economic inequality began to emerge on the public agenda before the 2011 election. Prime minister John Key was attacked by then Labour leader Phil Goff for using a new Ministry of Social Development report to claim that income inequality had not widened but had ‘actually fallen in recent years’ (Vance 2011). The ministry’s report stated that income inequality peaked in the early 2000s, then fell from 2004 till 2007; largely because of the Working for Families policy introduced under Labour, which provides tax credits for low- and middle-income families with children where a parent is in work. Criticism was directed at the prime minister because the report did not cover the government’s NZ$2.5 billion yearly tax cuts given to the top 10 per cent of earners in 2010. Moreover, child poverty rates were high, and there was an over-representation of indigenous Māori and minority Pasifika children living in poor families (Vance 2011; Collins 2011; Trevett 2011a).
The discussion that followed in parliament and in the communications media led some commentators to believe that a focus on class politics and economic inequality was the new hot issue (Edwards 2010, 2011). But the left gained little at the 2011 election, and by April 2014 commentators were once again lamenting Labour’s alleged inability to focus firmly on the needs of working-class voters, with a particular focus on men (Armstrong 2014a; Edwards 2014a; Hubbard 2014). There was some momentum gained on the issue of inequality in early May 2014, because of the impending government Budget. The Spirit Level (Wilkinson and Pickett 2009), a bestselling book published internationally and examining social inequality, had received some attention in New Zealand. Its authors arrived in New Zealand in the same week as the Budget to give a series of lectures on why more equal societies do best (Bradbury 2014a). The Budget contained a NZ$500 million package for families and children, including raising tax credits for those on low and middle incomes, expanding paid parental leave and removing doctors’ and prescription charges for children under 13. Journalists and political commentators largely agreed that National had ‘won’ the early battle on who would or could do more to combat inequality.
By contrast, the commentators deemed that Labour was unable to develop policy solutions that would resonate with its core constituencies. Economist Matt Nolan (2014) argued that the policy solutions of both the Greens and Labour were too focused on those who already had money, or were just platitudes. National used the budget to dispel concerns over inequality; two weeks later it appeared to have worked, with two major TV opinion polls revealing a significant ‘Budget bounce’ and 73 per cent of respondents favouring National’s ‘families’ package’ (Bennett 2014; Gower 2014a).
Inequality continued to feature in public debate throughout May and June, underpinned by more books on inequality published in New Zealand and elsewhere. TV3’s weekly political program The Nation dedicated nearly an entire show to this topic, while academic and commentator Bryce Edwards conducted a one-hour ‘Vote Chat’ interview with Inequality: A New Zealand crisis author Max Rashbrooke. Commentators were also engaging with Thomas Piketty’s bestseller, Capital in the twenty-first century, with Patrick Smellie’s in-depth Listener feature (2014; see also Ferguson 2014; McLauchlan 2014a). Academics gave the debate momentum with Victoria University hosting a free one-day conference on 19 June on ‘Inequality: Causes and consequences’, followed by the launch of Jonathan Boston and Simon Chapple’s book Child poverty in New Zealand.
Opinion polls also highlighted the influence the inequality debate might have on the election outcome. A report on inequality from the market research company UMR (2014) found that 50 per cent of the public were ‘very concerned’ about ‘growing inequality’, 37 per cent were ‘somewhat concerned’, and only 13 were ‘not concerned at all’. Alongside this, 71 per cent believed that the gap between the rich and poor was widening, and 78 per cent believed that the effects of this gap were bad for New Zealand. During the election campaign, Vote Compass found a similar result: 17 per cent of its 300,000 participants placed ‘inequality/affordability’ almost equal with the economy as the most salient election issue (Lees-Marshment et al. 2015: 120).
Perhaps because no issue can retain its prominence for long given the fast news and public attention cycles, discussion of inequality waned during the campaign. Reports were infrequent, or canvassed only by internet bloggers on the left, while the opposition parties did not appear to be championing the issue to any significant extent. Ten days out from the election, there was once again a flurry of media focus. The Leaders Debate on TV3 spent eight minutes on the topic. Labour leader David Cunliffe made a ‘dramatic heartfelt promise’ to make addressing poverty his priority as prime minister (Newshub 2014a; Edwards 2014b). By this time, polls were suggesting the inequality gap was a key election issue. According to pollster Roy Morgan, in 2011, only 4 per cent of voters saw inequality as the biggest issue facing New Zealand, but 18 per cent did so in 2014 (cited in Collins 2014). Similarly, Vote Compass reported that ‘67 per cent say the Government should be doing more to reduce the gap between rich and poor’ (Television New Zealand 2014), and should do more to address child poverty. Only 19 per cent of its respondents felt that National was doing enough on this issue.
Even some business leaders were admitting ‘growing disquiet about the rising inequality of wealth and income’ (New Zealand Herald 2014). There also appeared to be recognition across party lines that higher wages and tax reform were part of the answer to poverty and inequality. The difference between the left and the right was over how to achieve this. Labour and the Greens were promoting an increase in the minimum wage and a capital gains tax, while National focused primarily on tax cuts. Polls suggested both options were popular: 69 per cent wanted the minimum wage raised (Colmar Brunton 2014) but were ambivalent about higher taxes (Collins 2014).
Parties’ ability to handle salient issues
If inequality had become a much more salient issue since 2008, many would have expected a shift to the left, traditionally assumed to pay more attention to inequality, and have more support for policies aimed at reducing social inequality. Over the last three elections in New Zealand, there has, however, been no such change. Combining the National and ACT party votes, support for the right and centre-right has remained stable at about 48 per cent. Indeed, the advent of the Conservative Party grew the right vote, although not its seats, to nearly 52 per cent in 2014. The left, by contrast, has shrunk. As can be seen from Table 1.1, adding Labour, the Greens and MANA (in 2008 and 2011) and Internet-MANA (in 2014), the result is 37 per cent in 2014, down from 42 per cent in 2008. The tendency to assume that when inequality is salient people will move to the left, will only hold true if voters believe that left-wing parties are best able to deal with the problem. The 2014 NZES asked respondents which party they thought was best able to deal with the issue they found most important.
Table 1.3 shows that 79 per cent of those who found the economy to be the most salient issue chose National as the party best to handle it, compared with 11 per cent for Labour. Of those who identified governance as the most important issue, 63 per cent found qualities of good governance in National, but only 5 per cent in Labour. The left held the advantage regarding inequality as a principle: 42 per cent of those considering inequality the most important issue chose Labour as the party best qualified to deal with the problem, and 21 per cent the Greens. Despite the apparent success of the 2014 Budget, 30 per cent identified Labour as the party best handling problems associated with children and family, compared with 23 per cent for National. National did ‘win’ the battle with regard to housing, preferred by 38 per cent of those who named the issue, as against Labour’s 33 per cent.
Table 1.3: Party best at dealing with the issue by those finding it to be the single most important
|
Percentages by Row |
None |
Labour |
National |
Green |
NZ First |
N |
|
Economy |
3 |
11 |
79 |
2 |
2 |
520 |
|
Jobs |
9 |
31 |
41 |
0 |
7 |
156 |
|
Taxes/Government Spending |
9 |
12 |
59 |
2 |
4 |
103 |
|
Governance |
9 |
5 |
63 |
7 |
4 |
298 |
|
Inequality (Principle) |
12 |
42 |
8 |
21 |
4 |
205 |
|
Housing |
11 |
33 |
38 |
2 |
1 |
131 |
|
Children and Family |
8 |
30 |
23 |
19 |
4 |
91 |
|
Health |
4 |
30 |
38 |
3 |
4 |
82 |
|
Education |
3 |
35 |
37 |
6 |
0 |
89 |
|
Environment |
7 |
0 |
3 |
87 |
0 |
56 |
Note: The question was: ‘Thinking about the single most important issue in the 2014 election that you wrote above, which party do you think would be best at dealing with it?’
Whereas those who found inequality important saw Labour as the party best able to handle it, many also perceived National to be the best party to handle some of the key issues closely related to poverty and inequality, such as housing. And while the issue of inequality had come to the fore in the public debate, and while its salience had grown in the electorate, the state of the economy and governance were still the primary concerns of voters. On those matters, National was evaluated significantly more positively than Labour.
The remainder of this book examines to what extent, how and why the issue of inequality affected party choice and political behaviour in the 2014 New Zealand General Election. As noted above, its main source is the 2014 NZES, a dataset made up of responses from 2,835 people whose names were randomly selected from the electoral rolls and who either returned questionnaires sent to them in the post or completed the survey online. Of these, 1,419 had responded to the 2011 NZES, making it possible to compare their responses between the two elections. The remaining 1,462 responded for the first time in 2014. Further details can be found in supplementary materials for this book on the NZES website (www.nzes.org), where the full questionnaire used in 2014 is available for inspection. Those enrolled in the Māori electorates were oversampled, with 547 responses.
As there is a tendency for some people who did not vote to report that they voted, whether or not respondents voted or not was checked from the master rolls, and the data corrected when required. For most analysis, the dataset is weighed by gender, age, education, vote shares and turnout. The response rate for those sampled for the first time in 2014 was 33 per cent, and for those who participated in 2011 it was 63 per cent of the earlier sample. The sample is as representative of those who were able to vote in 2014 as is possible. But we cannot exclude some bias toward those who are more interested in politics than average. Indeed, even after validation, the proportion of non-voters in the unweighted sample is much less than that reported in the official data. To address this problem in some analysis, we are able to use data from both respondents and non-respondents, removing non-response bias entirely. Data from earlier versions of the NZES are also used, as are published polling and other data, both from New Zealand and elsewhere.
Chapter 2 begins our study by outlining the dimensions of inequality in New Zealand. It discusses inequality as a concept, and the important role that the pursuit of equality has played in New Zealand history. Moving up to the present, it traces the development of greater inequality in New Zealand in the 1980s and 1990s, and some of the explanations of the process. It places New Zealand in an international context, and discusses regulatory, tax and benefit changes that contributed to increasing inequality. It also introduces the two other sources of inequality that crosscut the economic dimension: gender and ethnic inequalities, the latter in particular affecting the indigenous Māori population.
Chapter 3 introduces the theoretical models on which we rely, and explains how these help frame and guide our analysis, drawing out their implications for inequality in relation to voting behaviour. The economic or rational choice theory of electoral behaviour assumes that voters are rational, and therefore people vote for the party that promises to most benefit them. This provides the foundation of what one might call the naïve theory, purporting to explain how people experiencing inequality would respond electorally: they should vote for the left. By contrast, the social-psychological model acknowledges that human beings are social animals with habits and loyalties, and we follow the example of others in making our choices. Our families, opinion leaders, political commentators and even political parties give us cues about what to do and think. We also discuss further the second attitudinal continuum that underlies the New Zealand party system: the authoritarian–libertarian dimension. Political disagreements around the attitudes bound up in this dimension can sometimes distract attention from traditional left–right or distributional issues affecting income inequality.
In Chapter 4, we begin the analysis of the NZES data. Applying the theoretical models described in Chapter 3, this chapter outlines the social foundations of voting choices in New Zealand in 2014, and addresses some of the competing explanations of the election result. We explore how social group location affects vote choice and left–right positions. Because one feature of increasing inequality has been a reduction in income security for many people, we bring in voters’ own perceptions of security or insecurity, and their aspirations. We investigate the extent of inequality between the parties, particularly in their funding.
Chapter 5 turns our attention to the election winner, the National Party. We show how the National Party won the 2014 election because of perceptions that it was competent and well led; the economy mattered, but as part of a wider package of perceptions associated with competence and leadership.
Chapter 6 moves the focus to Labour. Why did the party fail to mobilise concern about inequality as an election issue? To address this, we explore the range of positional issues around priorities for government expenditure to address inequality and other issues, and the distribution of public attitudes around tax and social policy in particular. We also assess claims made by internal and external critics of the party: Labour focused too much on ‘identity politics’, promised too much and those promises failed to cohere into a convincing narrative.
In Chapter 7, we turn to the Green Party. The Green Party came to the 2014 election with promises to address inequality, but these were secondary to its tax proposals that would have shifted business taxes toward paying for the costs of pollution. During the campaign, Greens were sidelined by Labour’s failure to acknowledge them as a likely coalition partner and coordinate with them accordingly. Yet the Green Party would have been a crucial component of any centre-left government alternative. We discuss the advice of commentators that the Green Party should move to the right, reducing its commitment to the reduction of inequality, and instead focus on environmental issues.
In Chapter 8, we note that aside from the mainstream National Party, the 2014 election had three other conservative parties in contention: New Zealand First, the most significant conservative party with centre-left stances on some economic issues, but populist and socially conservative; the ACT Party, leaning to the right on both dimensions; and the Conservative Party, particularly strong on socially conservative issues. As we shall see, New Zealand First voters do tend to lean to the left on inequality issues. As another party potentially needed to form an alternative government to one led by the National Party, New Zealand First and its voters lie in a pivotal position.
In Chapter 9, we explore the gender dimensions of inequality. Since the end of the nineteenth century, New Zealand has been presented as a leader in the field of gender equality. But major gender differences in opportunities and income still exist. This chapter addresses the gender dimension of inequality and assesses the extent to which there is a gender gap in attitudes and vote choice in light of the gender disparities in economic and political life. We also examine changes in descriptive representation, women in Cabinet and parliament, and whether voters view gender quotas for parliamentary representation as a gender equality mechanism.
Chapter 10 addresses the main ethnic dimension of inequality, examining electoral politics and opinion among Māori, New Zealand’s indigenous minority. In 2014, there were seven dedicated electorate seats for Māori who wished to vote in them. Traditionally, Māori have tended to vote Labour; however, in 2005, for the second time in recent years, Labour lost much of the Māori vote, and most of the Māori seats, to the Māori Party. By 2014, all but one Māori electorate had returned to Labour. Labour’s tide had apparently come back in among Māori, while going out among the rest of the electorate. The chapter questions this interpretation, and traces the decline and fall of the vote for independent Māori parties, the shifts in Māori preferences, and analyses where Māori issue and candidate preferences differ from the rest. We find some evidence that inequality is beginning to have effects between Māori, and is no longer simply a gap between Māori and the Pākehā majority. The Māori Party forms another potential pivot in the party system, and while currently aligned with National is by no means committed permanently.
Chapter 11 notes the small recovery in voter turnout in the 2014 election, and puts this into the context of developments since 1996. It examines the development of an age gap in turnout, but finds that the evidence for an increasing income or resource gap is less apparent. Those who are young on low incomes and with few assets do tend to be less likely to vote than others, perhaps making politicians less attentive to their needs. We address arguments about reforms that might raise turnout: compulsory voting, automatic registration and online voting. The chapter expands the focus on participation toward wider indicators of engagement, use of the internet, media exposure and campaign mobilisation.
Chapter 12 pulls the threads together, identifying the extent to which attitudes toward inequality, aspirations and perceptions of security or insecurity made a difference to the election outcome. Connecting its findings back to the earlier theoretical discussions, it draws out the likely implications for the future politics of inequality in New Zealand.
1 Pākehā is the Māori name for New Zealanders of European descent.
2 Special votes are those cast outside the electorate in which a person is enrolled, and include votes from overseas. These votes are sent to the electorate of enrolment for counting, delaying the final count for several days.
3 New Zealand’s MMP electoral system is a ‘compensatory’ form of the mixed member type. In 2014, there were 71 electorate seats and 50 list seats. The party vote is used to calculate the seat allocations per party, on which basis list seats are allocated to ‘top up’ each party’s seats to that number. There is a threshold for parliamentary representation that can be crossed in two ways: either by gaining 5 per cent or more of the party vote, or by winning one or more electorate seats. In 2014, an extra list seat was added because Peter Dunne won an electorate seat and therefore crossed the threshold, but his party, United Future, failed to win enough party votes to justify even one seat on the basis of party vote. In this situation of ‘overhang’, the number of list seats can be augmented for the purpose of adjustment. There were also overhang seats in 2005, 2008 and 2011 elections, in these cases adjusting for the Māori Party’s electorate seats. The ‘normal’ size of the House of Representatives is 120.
4 One simply calculates the differences between each party’s vote share in 2014 and 2011, adds them together, and divides by two.
5 This means that for every 20 samples we might have hypothetically drawn for our survey, we would expect 19 of them to produce estimates within those intervals. Where confidence intervals between estimates of interest overlap, we can be less certain of our findings even though the estimates themselves are different. Small overlaps may still be reported as statistically significant in the tables from which they are derived in the Appendix to this book, in which case we cannot entirely dismiss the evidence and our interpretation becomes a matter of judgement.
Previous Next



