


 menu
A Bark But No Bite
4
The social foundations of voting behaviour and party funding
Having introduced the theoretical frameworks underpinning our analysis, we move on to an investigation of how people’s party choices at the 2014 elections reflected their economic and social positions in society. Was their social and economic position reflected in their party preference for a left- or right-leaning party? And did it matter that some might have benefited economically from increased economic inequality by way of lower marginal tax rates on higher incomes, increased profits or higher salaries, as compared with others for whom economic inequality has generated lower salaries or benefits, less affordable houses and increased insecurity?
Focusing on the four main parties (Labour, National, New Zealand First and the Greens), we present baseline models for voting behaviour including the major socio-economic characteristics and identities expected to explain voting behaviour. We also investigate how owning assets like a house, business and stocks interact with income and how this relates to party voting and left–right position. Both income and wealth distributions are obvious indicators of inequality, but the interaction between them has only rarely been investigated in election studies, and may have significant political implications. Controlling for baseline social structure, we explore how aspirations for a more prosperous future or, alternatively, the fear of losing one’s job or losing one’s income relates to party choice and left–right position.
Our starting point and theoretical framework for these inquiries is that of self-interested voters who are nested in a social context—within their families and the wider community in which they live, and the groups to which they can be matched. Our argument is simple: interests and ideologies are constructed within networks associated with group identities, but they are not constructed out of nothing. Group identities and the ideological positions with which they become associated tend to have a footing in social structure, and can have a ‘rational’ basis. For example, all else being equal, we expect that it is more probable than not that someone on a benefit and in rental accommodation will have preferences for a lower rent and a higher benefit.
When exploring how voters’ socio-economic position relates to their party choice, and thus the social foundations of the main political parties, we also look at the implications of these social foundations on the parties’ campaigns and, in particular, the funds they have at their disposal.
The construction of interests
Individuals and families in New Zealand sustain themselves economically in a market economy in which there is a complex division of labour and a variety of ways to earn a living, including full or partial income support from the state. This division of labour determines the incomes people receive that in turn affects the assets they may or may not be able to accumulate. It slots some people into jobs that are relatively secure and well-paid, and others into jobs that may be less secure but where a balance of risk and opportunity may or may not lead to prosperity, depending on a combination of talent, skills and luck. These economic and social differences are the foundations upon which people may define their ‘interests’ or, in theoretical terms, their utility. The theory, as discussed in the previous chapter, tells us that people will choose a political party to vote for that will maximise their utility. For some, utility maximisation may dispose them to vote for a party to the right in favour of a free market that determines the distribution of wealth and income; for others it may be a vote for a party to the left that promises to intervene to correct the inequalities inevitably generated by the market.
Political scientists have traditionally followed through this line of inquiry by way of the analysis of class voting, most recently focusing on the extent to which class voting has declined (Clark and Lipset 2001; Evans 2000; Manza, Hout and Brooks 1995). Most work has been based on the Weberian concept of occupational status, with research influenced by Marx bringing in asset ownership (Wright 2009). People define themselves, or are defined, by classes that can be approached from two directions. The first direction distinguishes ownership from non-ownership of property, with property including ‘the means of production’. The second distinguishes classes according to their ‘status’, defined by a hierarchy of occupations, structured by education, skills and the value attached to occupations by way of income and social status. There are numerous ways of defining and operationalising the concept of class. One of the most influential has been a three-way classification that distinguishes people who work in manual or service occupations, those who work in non-manual occupations and farmers.
Figure 4.1 displays the standard Alford Index of class voting for New Zealand since 1963, drawing on previous New Zealand election studies. It is calculated by subtracting the proportion of people in non-manual/non-service/farming households voting Labour from the proportion of people of manual/service households who also voted for that party (an index originating in Alford 1962).1 From a low point in 2002, class voting has recovered to a level comparable to that in the early 1980s, although with one significant difference: the proportion of the population in manual/service households has somewhat declined, and is currently at about 34 per cent of the sample that can be classified, compared, for example, to about 42 per cent in 1987 (Vowles 2014b: 40).2
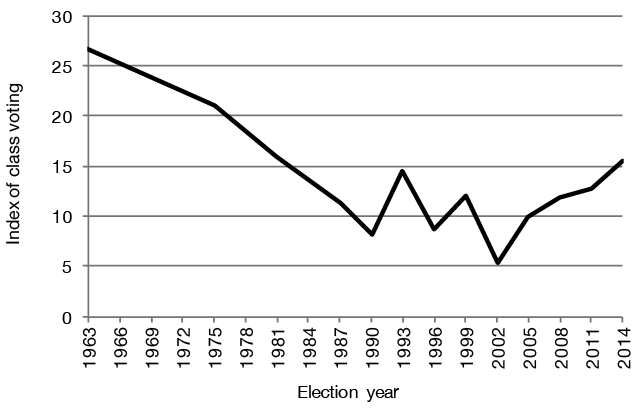
Figure 4.1: Class voting in New Zealand, 1963–2014
Note: The figure displays the difference between the proportion of manual/service households and the proportion of non-manual/service households voting for the Labour Party.
Source: Victoria University of Wellington Election Study 1963, 1975 (see Bean 1986); New Zealand Election Study 1987–2014.
Changes in technology and production have had deep effects on labour markets that go beyond a simple decline of the working class. Differences between those who work in the private sector, the public sector and the non-profit sector have become more significant. The growth of self-employment would potentially increase insecurity that might benefit the left; however, self-employment has traditionally been associated with voting for the right because of the business and individualistic values that often lie behind it. In fact, despite expectations to the contrary, household labour force and census data indicate that self-employment has not increased in New Zealand over the last 20 years or so.
The development of a more competitive society makes the accumulation of assets both more important and more difficult, particularly given the increasing unaffordability of house ownership for those on low incomes. The ownership of assets can be separated into two forms: low risk and high risk. The New Zealand Election Study (NZES) contains questions measuring ownership of low- and high-risk assets, with low-risk assets including two assets (a house to live in and some savings) and high-risk assets also including two assets (a business or business activity, and investment in stocks and shares). To simplify the inquiry, we can distinguish between no assets or perhaps only one asset and those with all four types of assets. Analysis of the scale indicates a high correlation between those who have high-risk assets and those with the highest scores. People with high-risk assets tend to have low-risk ones as well, whereas the majority of asset owners tend to only have low-risk assets. Both income and wealth are obvious indicators of inequality; we also include other variables that are expected to have effects on inequality and life chances such as gender and age. Age is important given there is a broad consensus that the current generation of young people are finding it significantly more difficult than earlier generations to establish secure careers and accumulate assets such as housing.
To get a more comprehensive understanding of inequality and party choice, we need to set class beside other social cleavages such as urban and rural differences, ethnicity, level of education and gender. Occupational class is not the only group focus of the formation of interests associated with work across the primary production, industrial and service sectors of the economy, not to mention public versus private sector employment. Analysis of New Zealand politics has tended to focus on the urban–rural and class cleavages, although these tend to overlap. Increasingly, New Zealand politics must also come to grips with the ethnic cleavage, not just between European-descended or Pākehā New Zealanders and Māori, but also incorporating other ethnic groups. Ethnic cleavages usually overlap with class cleavages, as in New Zealand, with Māori over-represented among those with low incomes and in lower status occupations. All these differences can be identified as affecting vote choices for parties of the left—particularly Labour, the party of equality, representing those on lower incomes—and the right—the National Party, the strongest support for which comes from the business community. We also need to consider the influence of political socialisation through the family.
Meanwhile gender, although a potent source of inequality, has not formed a consistent cleavage in New Zealand politics. In the 1960s and probably earlier, women were slightly more likely to vote for the right (Vowles 1993), while in the 1990s into the 2000s they were slightly more likely to vote for the left, particularly when Helen Clark led the Labour Party. Marginally, women are more likely to vote Green than men, and men have usually been more likely to vote New Zealand First or ACT (Coffé 2013b; Curtin 2014). We deepen our analysis of these patterns in Chapter 9.
Finally, education is another crucial variable shaping party choice. As new politics issues such as gender equality and the environment have become more salient and Green parties have developed, a cleavage has grown along levels of education. It divides the higher educated with generally libertarian attitudes and a tendency to vote for the left from the lower educated with more authoritarian attitudes and a greater likelihood to support right-wing, populist parties (for example, Bornschier 2010; Flanagan and Lee 2003; Inglehart 1984).
Table 4.1 lists the variables from our baseline multinomial multivariate model of the social and demographic correlates of inequality and voting choice; the various party choices and non-vote are unordered categories, so this is the appropriate approach. Vote National is the base category, and the others are non-vote, Labour, Green, New Zealand First, Conservative, and ‘Other’. We include non-vote because it is an important element in overall voting choice, but the topic is left for deeper analysis in Chapter 11. The baseline model accounts for about 11 per cent of the variation in voting choices in 2014. The figures below display the significant results, estimated as predicted probabilities of voting for each of the three main parties (National, Labour and Green). The probabilities take account of the effects of all the other variables in the models. The full models are presented in Appendix, Tables 4.A1 and 4.A2.
Table 4.1: The social and demographic structural correlates of inequality and voting choice
|
Model 1: Baseline Model |
|
|
Occupation Household |
No Occupation Reported |
|
Farming Household |
|
|
Non-Manual Household |
|
|
(Ref. Manual Household) |
|
|
Sector of Employment |
Self-Employed |
|
Public Sector |
|
|
(Ref. Private Sector) |
|
|
Assets (0–4) |
|
|
Relative Income (1–5) |
|
|
On Benefit |
Yes |
|
(Ref. No) |
|
|
Education |
Low |
|
(Ref. Middle) |
|
|
High (University) |
|
|
Gender |
Female |
|
(Ref. Male) |
|
|
Age (18+) |
|
|
Ethnicity |
Māori |
|
Asian |
|
|
Pasifika |
|
|
(Ref. European or other) |
|
|
Living in Urban Area |
Urban (100,000 plus inhabitants) |
|
(Ref. Not Urban) |
|
|
Membership Union |
Yes |
|
(Ref. No) |
|
|
Church Attendance |
Never–At least Once a Week (0–1) |
|
Model 2: Addition of |
|
|
Interaction of Income x Assets |
|
|
National or Labour Parents at 14 |
|
Notes: A range, for example (0–4), indicates that it is a continuous variable. Bracketed categories are the reference category in the analyses and means that it is the category to which an effect is estimated. For example: female against the reference category male. The wealth or assets index is made up of four questions: ‘Do respondents own a home, house, or apartment; a business, property, a farm or livestock; stocks, shares or bonds; and any savings?’ This generates a simple additive scale that ranges from zero (none of the above) to four (all of them). Low education is defined as those at level 2 or below (that is, a sixth form qualification). Ethnic identity is defined as the strongest where multiple identifications were reported. Relative income is based on the question: ‘How do you think your household’s income compares to that of the average person in New Zealand?’, with response categories much lower, lower, about average, higher, much higher. This has a high correlation with the question asked on income itself, and has a higher response rate.
Figure 4.2 shows significant relationships between socio-demographic characteristics and voting National, net of the effects of all other variables in the model. Of the entire enrolled electorate, including non-voters, National’s vote was just over 36 per cent. Various factors did not relate significantly to voting National after taking all other baseline model variables into account and are thus not presented in Figure 4.2, for example, there was no significant relationship between gender and choice to vote National or not, or for Asian ethnicity, church attendance, urban or rural location, education, economic sector and occupational group. While there is broad acceptance among political commentators that Asian voters tend to vote National more than average, NZES data suggests otherwise.
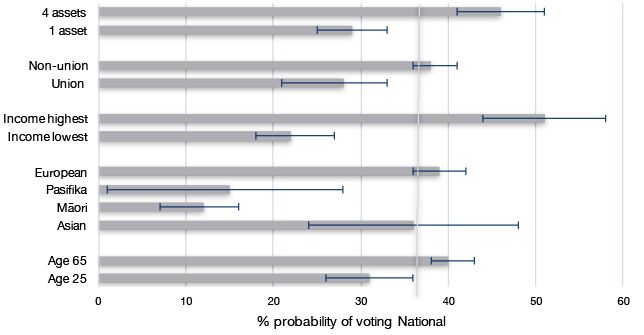
Figure 4.2: The social and demographic correlates of structural inequality and vote for the National Party
Source: Appendix, Table 4.A1. Grey vertical line indicates overall probability of National vote choice. Error bars are 95 per cent confidence intervals.
Focusing on the inequality-related measures, Figure 4.2 confirms that people who vote National are more likely to have much higher incomes than average, have accumulated more assets and are less likely to belong to a union. They are significantly more likely to be 65 and above, and more likely to be European and less likely to be of Māori or Pasifika ethnicity. Figure 4.2 thus confirms expectations: those voting National tend to be those who have benefited from, or at least those not adversely affected by, the increase in inequality in the 1980s and 1990s.
Turning to voting for Labour, Figure 4.3 shows that voting Labour is in many respects the other side of the coin of voting National. Gender, age, economic sector, urban–rural and receipt of benefits had no significant effects in the model. In our data, Asians were a little less likely to vote Labour than average, but not at a level of statistical significance. Māori were somewhat more likely than average to give their party vote to Labour, but the relationship is not strong and the confidence intervals overlap considerably (see Chapter 10 for more analysis). The model controls for occupation, income and assets, all of which are significant; as Māori are more likely to be on lower incomes, manual occupations and have relatively few assets, these characteristics may pick up the effect of being Māori. As expected, there is very likely a strong Pasifika element to the Labour vote, but the small size of that subsample means that the confidence intervals are very wide. Similarly, being on a benefit or not is ‘soaked up’ by income. Labour continues to draw on the manual and service classes, less on those in non-manual households, more on those on lower than average incomes, with few assets and in union households. Less traditionally, but not unprecedented since the 1980s, the university-educated are more likely to vote for Labour than average. Overall, though, according to these structural or socio-demographic indicators, Labour remains the party representing those who have lost rather than gained because of increased inequality.
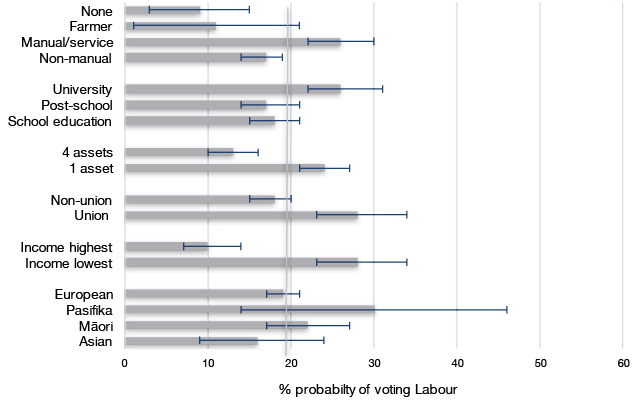
Figure 4.3: The social and demographic correlates of structural inequality and vote for the Labour Party
Source: As Figure 4.2.
Figure 4.4 shows probability estimates for those social and demographic variables that significantly affect Green voting. Green voters formed just over 8 per cent of the entire electorate. The Green Party appeals more to younger voters than the old. However, the Green Party appeals significantly less to ethnic minorities, and is particularly unattractive to the Asian community. Green Party voting choice is somewhat affected by lower than average income and asset ownership, although these differences fall within confidence intervals. As with Labour, voting Green is also associated with some social advantage as the university-educated are much more likely to vote for the Green Party than are other educational groups. The Greens are significantly less likely to appeal to people in farming households, not unexpected given the Green Party’s strong policy positions on reducing rural environmental pollution. Green voters are more likely to live in a major urban area of over 100,000 in population, which means living in one of New Zealand’s largest cities: Auckland, Christchurch, Wellington, Hamilton, Dunedin or Tauranga.
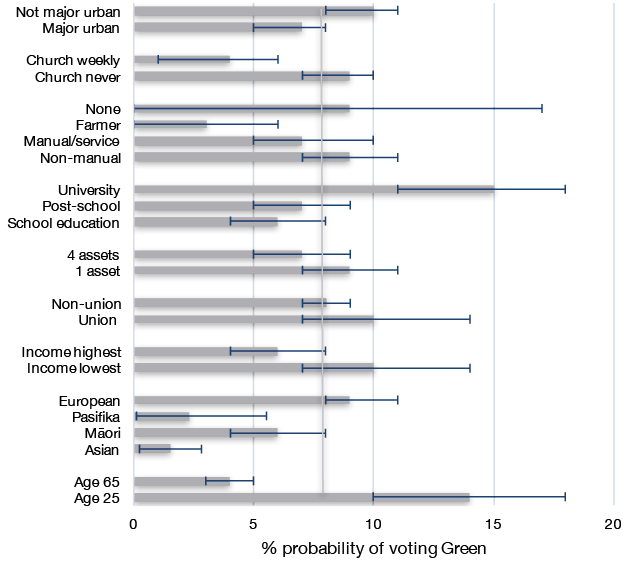
Figure 4.4: The social and demographic correlates of structural inequality and vote for the Green Party
Source: As Figure 4.2.
The New Zealand First vote was almost 7 per cent of the enrolled electorate, and only a scattering of socio-demographic factors were significant. For the party vote, New Zealand First retains a Māori appeal; Māori being 3 per cent more likely to vote New Zealand First than Europeans, although the difference is well within confidence intervals. Pasifika respondents also tend to be somewhat more likely than Europeans to vote for New Zealand First, but the confidence intervals are extremely wide, which do not allow us to draw firm conclusions. By contrast, Asians had a zero probability of voting for New Zealand First, not unexpected given New Zealand First’s policy positions on immigration. People on lower incomes are also more likely to vote New Zealand First. Men were slightly more likely than women to vote for New Zealand First. Further analysis of the New Zealand First vote can be found in Chapter 8.
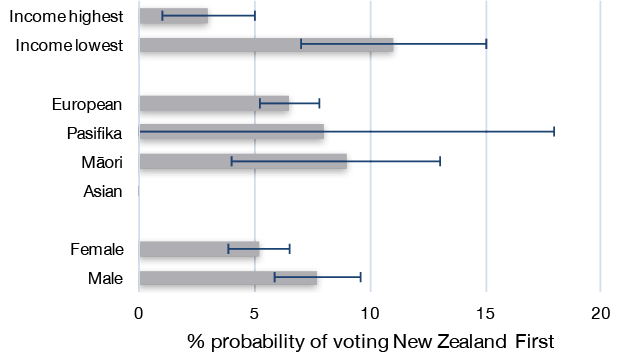
Figure 4.5: The social and demographic correlates of structural inequality and vote for the New Zealand First Party
Source: As Figure 4.2.
Parental partisanship, income and assets interactions
Having presented the baseline model for each of the main parties, we now move on to add an interaction between income and assets to the models and, in addition, parental partisanship. In the US, people’s party choices still tend to be influenced by their parents’ party choices; confirming findings from much earlier research that party choice is a habit passed down between generations (Jennings, Stoker and Bowers 2009). Parental partisanship is important because it can be a key source of identity, particularly if it is passed on from parents to children. In countries in which party identifications have declined over the last 20 or 30 years, as in New Zealand (Vowles 2014b: 46–47), we might expect to find less transmission of party identification from parents to children than in the past.
Within the sample, 16 per cent reported two parents who supported National when respondents were aged 14. Recollections of having two Labour parents were higher at 22 per cent. Five per cent reported divided parents, and 42 per cent reported no parental partisanship. Older respondents were slightly more likely to report parental partisanship. As one would expect, few respondents recalled parents supporting the Green Party or its forerunner (the Values Party) or New Zealand First, and the numbers were too small for statistical analysis.
As Figure 4.6 indicates, those for whom both parents voted National are significantly more likely to vote National, while respondents who recall both their parents being Labour voters are appreciably more likely to support Labour. Recollection of parental support for Labour also slightly increases the probability to vote both for the Green Party and for New Zealand First. We should be a little cautious about these findings since the likelihood of recalling parental partisanship is likely to be associated with current loyalties.
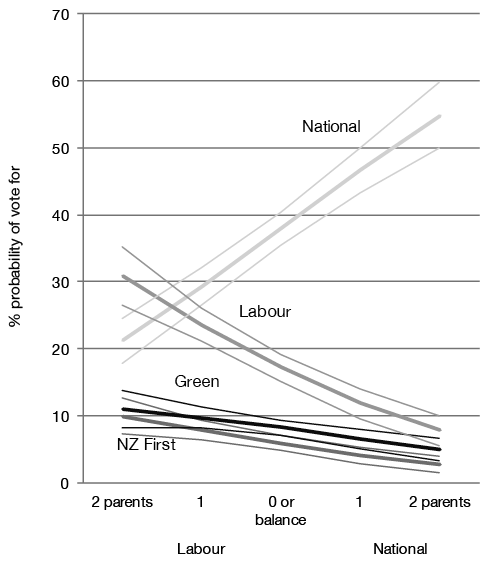
Figure 4.6: Parental partisanship and voting choice, 2014 election
Source: Appendix, Table 4.A2.
The purpose of our analysis of the interaction between income and assets is to explore how party choices are affected when one has high or low levels of one of the two, or both. Our focus also moves to perceptions of risk and (in)security, and the choices people make to protect themselves. One way to achieve security is to acquire an asset that may reduce the need for income; in particular, a home that is mortgage-free, and also some savings, while remaining confident that the state will provide a guaranteed pension in old age: a ‘low-risk’ strategy.
Other people, however, may choose to take risks, setting up their own businesses, borrowing money to invest in order to make more money, and accumulating other assets such as stocks and shares, the value of which could move down as well as up. This high-risk path can lead to wealth, but can also go wrong, sometimes seriously so. A successful high-risk strategy can make people so prosperous that their resources can cover all possible contingencies; for example, a business setback, loss of employment or the need for expensive hospital treatment. Those prepared to take the high-risk strategy are a minority. However, their values are individualistic; they believe in self-reliance and are likely to be opposed to government action to reduce inequality, possibly regardless of their current incomes. Analysis of the assets scale indicates that, as one would expect, those who own higher-risk assets are found at the top of the scale, as they tend to also own lower-risk assets as well. Hence, the assets scale can also be interpreted as estimating the propensity to take risks.
Those with no assets are unlikely to have the resources necessary to cover losing their jobs or suffering a serious blow to their health—they form about 7 per cent of the sample. Those with one asset make up about 20 per cent, those with two nearly 30 per cent, while 45 per cent have three or four. Those with limited assets will tend to look to the state to provide safety nets—for example, through income support for the unemployed and the sick, and a government-funded health service—and are likely to support a party that defends redistribution and an active welfare state, since private markets can rarely provide affordable comprehensive cover for all possible contingencies. The safety net itself also reduces inequality, as it prevents people from falling into deprived situations in which their ability to support themselves can go from bad to worse, from which they may find it hard to recover.
Funding services such as health and unemployment insurance requires taxation and, since the market incomes of the lowest paid do not leave much of a surplus after basic needs are met, that taxation must bear more heavily on those with higher incomes. If those with fewer low-risk assets are more favourably disposed to the idea of collective risk-pooling, we would expect them to be more willing to pay for it, even when their incomes increase, and we therefore expect them to vote for parties that pledge to fund social services regardless of their incomes. If they do not, the project of collective risk-pooling will lack the essential support of those with the incomes to pay for it by way of progressive taxation. We would likewise expect support for such services among those with high-risk assets to be low, regardless of their incomes.
Figure 4.7 shows the interaction between relative household income and the ownership of assets and how it relates to voting Labour, the party traditionally most in favour of redistribution of wealth. No significant effects were found on the probabilities of voting for parties other than Labour (see Appendix, Table 4.A2). Figure 4.7 shows, as expected, that those following the high-risk strategy and having accumulated all four asset types had a relatively low probability of voting for the Labour Party, regardless of their incomes. By contrast, among those with only one asset, those on lower than average incomes and only one asset have a significantly higher probability of voting Labour than those with one asset but a higher income. Those who saw themselves as on average incomes had a probability of voting Labour that more or less matched the party’s overall vote. Among this income group as well as among the lower income groups, those with only one asset were significantly more likely to support Labour than those with all four assets. Those with higher than average incomes were least likely to vote Labour, irrespective of the number of assets they reported. A more sustainable and equality-enhancing pattern would have been to see those with fewer assets but higher incomes also voting Labour. Those who have accumulated fewer assets should be ideologically more disposed to collective risk-pooling and therefore to support redistribution and vote accordingly.3 In 2014, they tended not to do so.
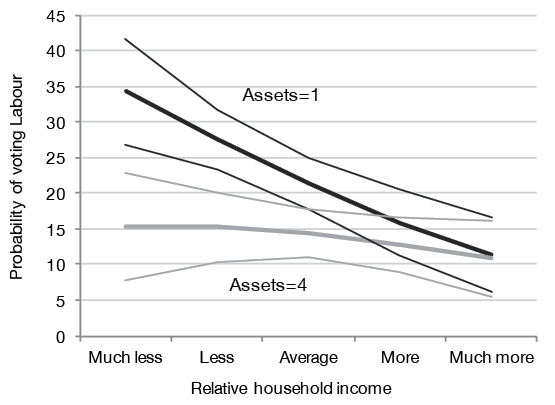
Figure 4.7: Income and assets interaction and Labour vote (with 95 per cent confidence intervals)
Source: Appendix, Table 4.A2.
Perceptions of insecurity
To move beyond a structural approach to voting behaviour, we need to investigate people’s perceptions of their economic situation. The 2014 NZES contained several relevant questions, including how much people feel exposed to risks such as losing their jobs or incomes, their senses of security or insecurity and, from a positive angle, their aspirations for the future.
Figure 4.8 displays the responses to the relevant questions. Again, we see evidence of an overall satisfaction with New Zealand’s economic performance. We also see evidence of cognitive bias, with a third of respondents believing, against most of the economic statistics, that the economy had got worse over the previous year. The economy question is one of the standard instruments of electoral research and is usually a good predictor of support or opposition to an incumbent government (Duch and Stevenson 2008). People who are positive about the economy are more likely to support the incumbent government. However, responses are invariably coloured by bias among those who have long-standing or even more immediate loyalties, and therefore need to be interpreted cautiously (Evans and Andersen 2006).
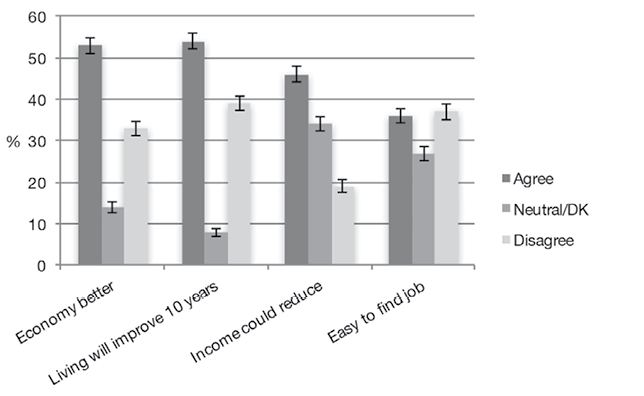
Figure 4.8: Perceptions of economic security or insecurity
Note: The questions were: ‘If you (your partner) lost your/their job, how easy or difficult would it be to find another job within the next 12 months?’ Coded to the respondent, or to their partner if the question did not apply to the respondent or was not answered. Five-point scale, very easy/easy into ‘Agree’ and difficult /very difficult categories into ‘Disagree’; ‘Over the next 10 years, how likely is it you will improve your standard of living?’ Five-point scale, very likely/likely into ‘Agree’ and unlikely/very unlikely categories into ‘Disagree’; ‘How likely or unlikely do you think it is that your household’s income could be severely reduced in the next 12 months?’ Five-point scale, very likely/likely into ‘Agree’ and unlikely/very unlikely categories into ‘Disagree’; ‘Would you say that over the last 12 months the state of the New Zealand economy has got a lot better, got a little better, stayed the same, got a little worse, got a lot worse?’ Agreement is with both better categories, disagreement both ‘worse’ categories. All ‘don’t know’ responses or missing values are coded to the 0 mid-point.
Source: New Zealand Election Study 2014.
More evidence of optimism that is less likely to be contaminated by partisanship comes from the question that enquires if and to what extent people feel that their own standard of living will improve over the next 10 years. This question is also an estimate of ‘aspirational’ attitudes, which will be further discussed in Chapter 5.
As can be seen from Figure 4.8, 54 per cent believed that their standard of living would improve. However, nearly 40 per cent took the opposite position, although some of that may be discounted as it is likely to capture a number of older people approaching retirement. There remains some evidence of insecurity among a significant minority. One third of the respondents considered that it was likely their household income would reduce over the next year, and 37 per cent believed that if they or their partner lost their job it would be difficult to find another within the next year.
The questions introduced above were added to the baseline model, reported in full in Table 4.A3. Here we focus particularly on the two indicators of feelings of personal insecurity: the fear of income loss and the difficulty of finding another job.
In addition, we included perceptions of the economy over the last year in the models. This acts as a useful further control for potential partisan bias in answering the questions about income decline and job loss, as do expectations of a better standard of living in 10 years. Both associate strongly and positively with National vote choice.
Figures 4.9 and 4.10 present the predicted probabilities of voting for the main parties depending on the confidence people have in getting a new job and their fear of losing the job on which they depend for income, after controlling for all factors included in the baseline social structure model. The slopes are only presented for those parties where the perceptions relate significantly to supporting that party.
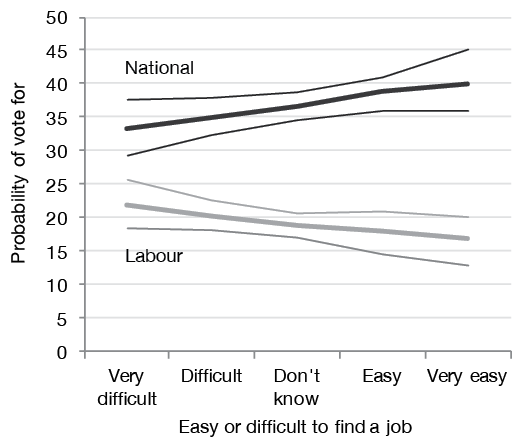
Figure 4.9: Confidence in getting a new job, National and Labour vote choice
Source: Appendix, Table 4.A3.
Figure 4.9 illustrates how expectations of finding a new job, if one was needed, affect the National or Labour vote. Expectations of finding a new job had no significant effect on people’s probabilities of voting Green or New Zealand First, so the slopes for these two parties are not plotted. Confidence in getting a new job if necessary made people more likely to vote National and less likely to vote Labour, by about 6 per cent in each case. But people who were most concerned about finding a job were still more likely to vote National than Labour, even after having taken into account their perceptions of the state of the economy over the previous year.
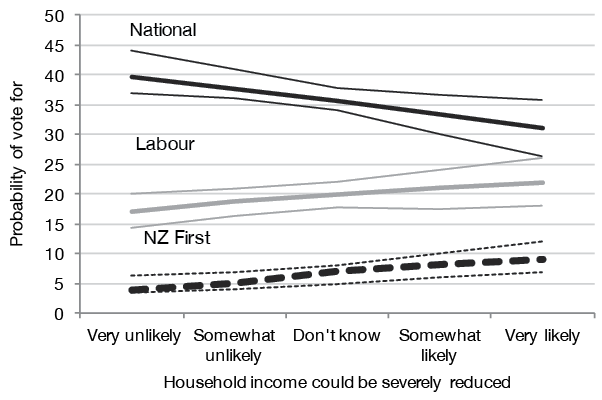
Figure 4.10: Perceptions of loss of income and vote choice
Source: Appendix, Table 4.A3.
Figure 4.10 plots the association between fear of income loss and voting choices. Fear of income loss had no effect on the probability of voting Green, but related significantly to the Labour, National or New Zealand First votes, and did so much as expected. However, the slope for Labour is close to flat, with only a 3 per cent difference. Fear of an income reduction decreased the probability of a National vote by about 9 per cent, and increased that for New Zealand First by about 4 per cent. With unemployment well below its post–global financial crisis (GFC) peak, and economic prospects perceived to be strong in New Zealand in 2014, one would not have expected highly potent effects. The big effect on the probability of voting National is a hint of potential vulnerability, if the economy were to turn downward once more.
Left–right position is one of the major variables underlying our analysis. Preferences for free markets and minimal government on the right and for regulated markets and income redistribution on the left should shape public opinion about inequality and the policies that government might adopt to reduce it. Table 4.A4 in the Appendix shows the results of regressions on the left–right scale: the first with just the baseline social structure variables and the second including the security and aspirational variables. Model I on social structure ‘explains’ about 16 per cent of the variance, Model II adding the security/aspirational variables improves the fit to nearly 22 per cent. Figure 4.11 displays the significant effects for the social structure, security and aspirational variables on left–right position, leaving those for income and assets. The effects of their interaction are displayed in Figure 4.12 below.
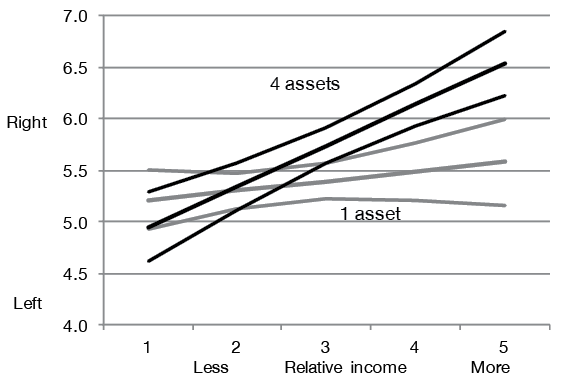
Figure 4.11: How baseline social structure, security and aspirations affect left–right positions
Source: Appendix, Table 4.A4, Model 2.
Figure 4.12 confirms that there is a strong link between asset ownership and left–right positions when conditioned by income. Relative income relates strongly and positively with a left–right position among those with multiple assets, propelling those with four assets and high incomes 1.5 points higher on the left–right scale than those with four assets and low incomes. By contrast, those with only one asset are largely unaffected by their incomes and are very close to the median and average voter positions. This provides support for the hypothesis that income does not affect the left–right positions of people who do not accumulate assets because people with fewer assets are more likely to be disposed toward collective risk-pooling. As we shall see in later chapters, support for such collective risk-pooling is found most clearly in New Zealand median voters’ strong support for the universal provision of health, education and New Zealand Superannuation. Figure 4.12 stands in sharp contrast to Figure 4.7, which plotted the same relationship on the probability of voting Labour. Examining the foundations of left–right position, there seems some reason for confidence that income- and asset-based preferences for modest redistribution have the potential to be politically effective and carried into policy. But Figure 4.7 shows that in 2014 the Labour Party failed to mobilise those preferences into Labour votes.
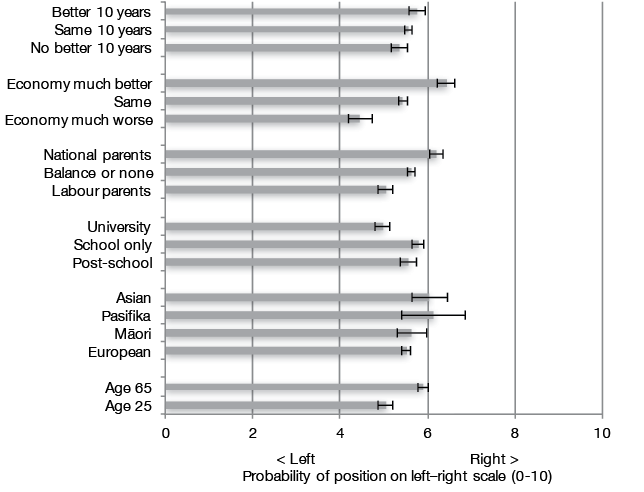
Figure 4.12: Left–right position, relative income and assets
Source: Appendix, Table 4.A4.
The difference between women and men on the left–right scale is too small to be significant, let alone substantive: women are to the left by only 1.5 per cent, and the male–female gap is well within confidence intervals. Older people tend to the right, younger people in the centre. All else equal, a person who is 65 is likely to be 0.8 further towards the right on the 10-point scale than a person who is 25. Persons of Asian ethnicity are likely to be 0.5 more to the right than a European, confirming claims that Asians tend toward the right. Māori and Pasifika differences are well within confidence intervals. People with only a school qualification tend to the right, people with university degrees to the left. People in union households tend to be more to the left, although this drops out of the second model where aspirations and security variables are added. Parental partisanship indicates the effects of socialisation; this is based on a five-point scale putting two National parents at the top, two Labour parents at the bottom, as on the horizontal axis of Figure 4.5. Occupation, sector of the economy, receipt of benefits, urban–rural and church attendance have no significant effects. In Model II, perceptions of a good economy over the last year and aspirational expectations of a better living standard in 10 years are the key variables; job insecurity or fear of income loss do not rate.
Inequality, the media and party funds
Around the world, as well as in New Zealand, party memberships have declined (Van Biezen, Mair and Poguntke 2012). Meanwhile, election campaign expenses have increased, and money matters more and more in electoral politics. Significant differences in the funds available for parties to organise and campaign may affect voters’ choices, particularly over the long term. These differences are to be expected, given the propensity of some parties to gain the support of people with higher incomes and more assets than other parties. Parties with generous funding can effectively mobilise, research and target their appeals, identifying aspects of voter psychology they can seek to influence. Of course, a simple calculation of funds spent per vote by parties usually indicates no relationship between expenditures and party vote shares. This leads some to conclude that differences in funding between parties are irrelevant (Edwards 2006, 2008). Unpopular parties with plenty of money to spend do not necessarily make significant headway.
But campaign expenditure can have effects on the margins, as research on the United States Senate and House races confirms (Stratmann 2005). If all other factors shaping party vote share are equal, an intelligently used advantage in funding can be expected to make a difference. For example, advertising in the final week of the campaign in the most competitive and electorally important American states probably gave the Republican Party the edge in the 2000 Presidential election. In that final week, the Democrats could not match a Republican advertising barrage in those key states. Outside of the targeted states most crucial for the Electoral College, votes shifted to the Democrats. In the targeted states, the shift of votes was to the Republicans (Johnston, Hagen and Jamieson 2004: 99–100).
New Zealand law requires political news coverage on television to be balanced and impartial; political positions can be expressed in documentaries, interviews and debates, but all sides are expected to get their say over time (Broadcasting Standards Authority 2010). Television news formats are based on commercial principles that minimise their political content (Atkinson 2016). Outside of election campaigns, the incumbent government tends to dominate the coverage. Half of the 2014 NZES respondents followed the election often or sometimes on one or both of the two main television channels: One and TV3. New Zealand newspapers are generally nonpartisan and most are bound by a voluntary code under which they also agree to provide balanced political coverage (New Zealand Press Council 2017). Editorial positions on party choice are relatively rare and, if announced, are not sensationalised. There is no tabloid press but, equally, no ‘quality press’ either. Newspapers tend to have regional markets, although the biggest, the New Zealand Herald (Auckland) and the Dominion Post (Wellington), have greater penetration throughout the country, particularly through their comprehensive free-to-view websites. Of NZES respondents, 55 per cent followed election news in a newspaper during the campaign. Māori Television and Radio New Zealand (RNZ) are the only publicly funded sources of news in a public broadcasting mode that provides more in-depth balanced coverage. About a quarter of NZES respondents listened often or sometimes to RNZ’s National Radio, while 10 per cent watched Māori Television. Talkback radio often has political content that tends to be more extreme and sensational: 28 per cent of 2014 NZES respondents listened ‘often’ or ‘sometimes’ during the campaign.
This media environment coupled with taxpayer funding and campaign spending limits partly level the playing field for New Zealand political parties, but the surface is far from flat. Research into the funding of political parties and political campaigns has been difficult to conduct in New Zealand since full party finance and membership statistics are, in contrast to most other advanced democracies, not publicly available. By contrast, incorporated societies far less important in New Zealand’s public life are usually required to file an annual financial statement that must be approved by members at an annual general meeting and is available for public inspection. Since 1996, political parties seeking to stand candidates for the party vote have been required to register with the Electoral Commission, with a requirement that they have at least 500 members. Parties do have to report their donations on an annual basis, and the detail of their campaign expenditure in the three months prior to an election.
The Electoral Commission also has the task of allocating radio and television broadcasting expenditure between parties over the one-month election campaign, using a formula based on their vote at the previous election, party memberships, more recent polling information and some other factors. The total funds available for the 2014 election were NZ$3,283,250 (Electoral Commission 2015c). No advocacy of a vote by a political party can be broadcasted on radio or television except as funded through the Electoral Commission, and only during this period. Electorate candidates may buy broadcasting advertising out of their own funds within their own campaign expenditure limits, which apply over the ‘regulated period’ of three months before an election (NZ$25,700 in 2014), but it must be directed to their own electorate candidacy, although their candidature for a party can be indicated. Parties can buy advertising in newspapers and on digital platforms from their own funds within the overall campaign expenditure limits during the regulated period. Until 2016, it was understood that ‘third party’ organisations could advertise during campaigns, including on radio and television, but only in respect of policies, not explicitly for or against a party or group of parties. A legal decision has clarified that third parties can advertise for or against a party, with requirement to identify their promoter and an expenditure limit of NZ$315,000 over the three-month campaign period for those who spend over NZ$12,500. Overall expenditure limits apply only within the longer ‘regulated’ period, defined as three months before the election date. Parties can and do advertise prior to it, and sometimes have done so by means of billboards, but cannot do so on radio or television. In 2017, third-party advertisers will be able to advocate voting for or against political parties both inside and outside the campaign and regulated periods.
During the 2014 regulated campaign period, political parties could spend up to NZ$1.09 million plus another NZ$25,700 for each electorate contested. Regulated expenditure within the three-month campaign period is entirely and only related to direct communication with voters. The limits cover expenditure on television and radio production costs, other media advertising, including social media, and campaign materials such as pamphlets and billboards. Expenses incurred in in-house party polling, travel and consultants are not included, unless they are designed to directly encourage or persuade people to vote for one party or another. Expenses associated with party-paid staff or costs of volunteer assistance are also not included.
Figure 4.13 shows the total expenditure per party in the 2014 campaign, adding party, broadcasting and candidate expenditure as they were reported. The National Party spent almost twice Labour’s budget. The second-highest spender, the Conservative Party, was principally funded by its leader, property manager Colin Craig. The Green Party spent a little more than Labour, but was able to so principally from a 10 per cent tithe on the salaries of its MPs (Davison 2014c).
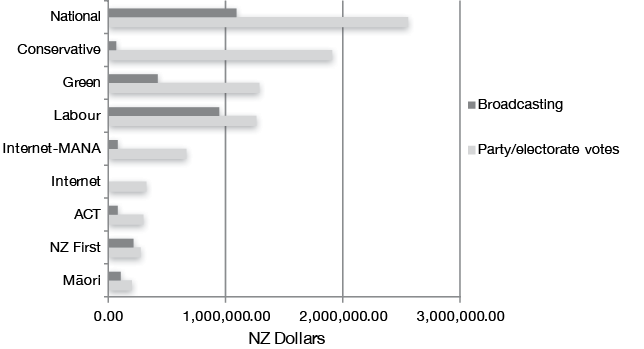
Figure 4.13: Campaign expenditure 2014 election by party (in NZ Dollars)
Source: Electoral Commission 2015b, 2015c.
Outside the regulated campaign period, parties are free to spend what they like, except on radio and television, and there is no publicly available information about how much they spend and on what they spend it. The parties maintain national, regional and electorate organisations, but there is little accessible information about their capacities and roles. Since 1993, the Electoral Commission has been charged with receiving returns of donations to political parties that are likely to comprise a significant part of their overall incomes, except for a residue of membership fees. Many traditional party fundraising activities are covered under the rubric of donations, including raffles, cake stalls and fundraising dinners. In early years of reporting, transparency was limited by the use of trusts that would act as conduits for significant donations. By 2014, anonymous donations were limited to NZ$1,500, and ‘transmitters’ were required to disclose the original source of their donation if over the NZ$1,500 limit.
Figure 4.14 summarises the total named and anonymous donations from the period between the 2011 and 2014 elections. The second highest spender was the Conservative Party, almost entirely funded by one man, its leader in 2014, Colin Craig. Next, in terms of party income, was the Internet Party, again almost entirely funded by one man, Internet entrepreneur Kim Dotcom. As in Australia, a pattern seems to be emerging in New Zealand politics in which rich donors can set up or buy their own ‘vanity’ parties, with self-appointed leaders. The only exception for leadership was Kim Dotcom, who could not stand for election as he was not a New Zealand citizen. In November 2016, ‘the Opportunities Party’, to be funded and led by another rich donor, Gareth Morgan, appeared on the scene (Hehir 2016).
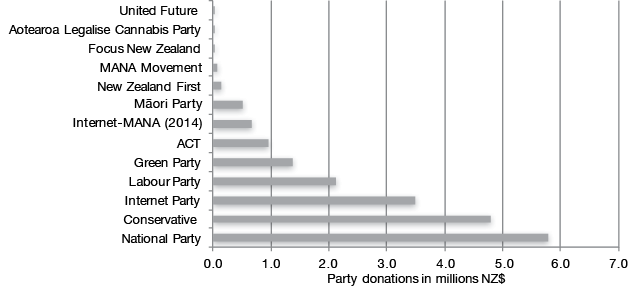
Figure 4.14: Donations to political parties, 2012–2014
Source: Electoral Commission 2016d.
Looking back to Figure 4.13, in campaign expenditure National outspent Labour by a ratio of over two to one; in terms of reported party income over the previous three years, the National–Labour ratio is closer to three to one. The gap in financial resources between the two major parties is bigger than the vote gap between them. While expenditure limits during the ‘regulated period’ place a ceiling on the disparity, they reduce but do not remove it. Some implications can be drawn from post-election commentary. The National Party could purchase a database of mobile phone numbers for use in the campaign. Labour could not afford to do so (Salmond 2015: 249). National could run extensive advertising on digital platforms at a cost of NZ$377,000, something Labour could not match (Barnett and Talbot 2015: 145). Labour’s 2014 campaign has been described as being run on ‘a shoe-string budget’ (Trevett 2015).
The political parties keep their internal polling arrangements very much to themselves. It is known that the Labour Party used UMR Research, which seconded one of its staff, David Talbot, to work as campaign director in 2014. The National Party used David Farrar’s Curia Market Research. Curia’s 2014 pre-election polling questions have been reported by a person who was asked to participate and are standard for the territory (Brown 2014). Curia’s work was supplemented by research and advice from Australian-based pollsters Crosby-Textor (Watkins 2014). John Key’s relationship with Crosby-Textor goes back to 2006, when agency staff began making monthly visits to New Zealand to conduct focus groups designed to promote and define Key’s public image, including strategic briefings from Mark Textor himself (Hager 2008). National’s polling is considerably more intensive, regular and expensive than that of Labour. John Key has been recorded as saying that National is ‘addicted to polling’—the party polls weekly (Hager 2014). John Key’s responses to ongoing events were heavily informed by polling analysis and focus group reports.
Labour’s funding deficit reflects a failure to maintain the strength of the party’s organisation and its fundraising capacities during and after the period of the Helen Clark–led Labour Government (1999–2008). The party was in deficit in 2005 and the situation was made worse as Labour was obliged to pay a further NZ$800,000 back to government funds because Labour had unlawfully sought to use the funds to finance its 2005 election pledge card. By 2008, branch numbers and related income via fees were down, as was membership: from 12,000 in 2001 to 7,500 in 2008 (Franks and McAloon 2016: 241, 245). This is despite the record that shows that while in government Labour was mostly able to match the level of political donations flowing to the National Party (Edwards 2008). In opposition since, Labour’s donations have fallen; expectations that businesses will give evenhandedly to both major parties have not been borne out. The claim that business donations have become of relatively low significance for party funding may have been evident up to 2008, with an average of only NZ$1 million a year. The recent data from 2012–2014 reported in Figures 4.13 and 4.14 shows a significant increase.
In 2014, National’s electorate candidates collectively raised more than twice the amount raised by Labour candidates (Electoral Commission 2015d). A rare glimpse into usually confidential party finances can be gleaned from a Labour Party Financial Report ‘obtained’ by the New Zealand Herald in November 2015. The report showed that Labour ran a deficit in both 2013 and 2014, running down both its reserves and assets. The party reported day-to-day operating expenses on an annual basis of NZ$1 million in 2013 and $1.2 million in 2014, about half of which paid staff salaries. Internal levies on electorates and union affiliates in 2014 were NZ$636,000. Meanwhile, the National Party has an inbuilt advantage as a party that tends to reflect the interests of business and those with higher incomes and more assets, and as incomes and assets have increased most for those already at the top of those ladders, the party’s advantage has increased since the 1990s. Declining numbers of unions and union members have also reduced what used to be one of the most stable and secure foundations of Labour Party funds (Edwards 2008: 7–8).
Of course, the parliamentary parties and the politicians they put into office receive a great deal of financial support from the taxpayer. Most of this benefits the incumbent government (Edwards 2006, 2008, 2016b). In New Zealand, both ministers and government departments have hired increasing numbers of public relations staff whose job is to present the policies of the government in the best possible light and, if necessary, do their best to bury information that would present a negative image (Edwards 2015a). The ability to get information under the Official Information Act (OIA) has been greatly reduced since about 2005 (Fisher 2014). As a result, regardless of all else, it may simply have become somewhat harder to dislodge an incumbent government than in the past. The opposition parties do have parliamentary staff that work to support their MPs and their party in general. They are outnumbered by those serving the government as party or ministerial officials who have much easier access to government information.
It has been argued that the increased number of staff serving MPs and the parliamentary parties is a form of state funding of parties and, in contrast, the revenues and expenditures of political parties and their sources pale into insignificance (Edwards 2008). While these funds are substantial, staff such as ministerial officials and secretaries spend only part of their time doing explicitly party politics. Electorate agents employed in MPs’ offices around the country spend most of their time servicing constituents on everyday matters, although it would be naïve to imagine that agents can entirely avoid party political work. The use of parliamentary funds for party political or electorate purposes has become an increasingly sensitive subject since Labour tried to pay for its 2005 pledge card from taxpayer funds. For example, from 2011, MPs could no longer ‘ask for money, votes, or party membership’. Current advice to MPs and officials draws the boundaries, although in practice there remains potential for overlap (New Zealand Parliamentary Service 2014). If governmental and parliamentary support for political parties is a form of ‘state funding’, it is the party in government that gets the lion’s share.
The quality of the strategic advice given to political parties is almost certainly related to the money they can afford to spend. Labour’s 2011 and 2014 campaigns failed to emphasise the respective party leaders and, in 2011, the crucial party vote. Whether Phil Goff or David Cunliffe might have benefited from Crosby-Textor-style ‘grooming’ is questionable: in Goff’s case because he was already too well-known, and in Cunliffe’s because his accession to the leadership was late. But the party almost certainly could not afford to pay much for the kind of research and advice that might improve a leader’s presentation to the public. Labour’s campaign slogan in 2014 was ‘Vote Positive’, widely derided for its vacuity and meaninglessness (Franks and McAloon 2016: 254), although still defended by some (Barnett and Talbot 2015: 140). Higher-quality advice based on more robust research would surely have exposed its weakness. The broadcasting allocation provided to parties pays for the time they are allocated; production costs must come from their own budgets. More funds can buy more professional advertising, and more entertaining variation in that advertising over the campaign will have a better chance of capturing public attention.
As noted earlier, a key feature of the political donation system in New Zealand is the absence of any limits per donor. Consequently, Colin Craig and Kim Dotcom were able to almost entirely fund the Conservatives and the Internet Party, respectively. In the latter case, it is unlikely to be coincidental that the Internet Party and its ally the MANA Movement managed to secure over 10 per cent of the media coverage during the campaign, despite gaining little or no polling traction and only 1.4 per cent of the party vote (Bahadar, Boyd and Roff 2016: 205–06). Money buys attention in the form of high-profile media events, such as the ‘Moment of Truth’ in which journalist Glen Greenwald was brought to New Zealand and Edward Snowden and Julian Assange were live-streamed into a packed Auckland Town Hall to reveal details about the how the Five Eyes intelligence network operates in New Zealand. This did Internet-MANA no good, and probably helped harden National party support in the last days of the campaign (Joyce 2015: 131–32). Meanwhile, Internet-MANA took attention away from the government’s more potentially effective opponents. Comparing coverage of the two main party leaders by content analysis of the campaign media, Key had 47 per cent, almost exactly matching National’s party vote; Cunliffe had 21 per cent, less than Labour’s party vote (Bahadar, Boyd and Roff 2016: 205–06). Given that Cunliffe was the alternative prime minister, his coverage seems disproportionately low. Journalists and editorial staff were presumably already discounting the possibility that he could lead a government.
A key resource that can offset the financial advantages of large donations are party members—perhaps they can offset the advantages of ‘big money’ (Edwards 2008). There are claims that Labour party membership significantly increased as a result of the leadership campaign that elected Cunliffe. Party members have become able to vote in the Labour leadership elections since 2012, giving people an incentive to join. If it had more members to draw on, Labour would therefore be in a better position to beat National on the ground. Sophisticated ‘micro-targeting’ of voters might also have given Labour a slight edge in 2014, but National was not far behind (Salmond 2015). The National Party also claims a significant membership and on-the-ground activity. As no membership data is available for either party, we cannot compare. The most important test is active membership: those who are prepared to canvass or make telephone calls on behalf of a party. Chapter 11 reports the relevant data from the 2014 NZES, but it does not confirm a Labour advantage.
Conclusion
Despite increased concerns about economic inequality, after the 2014 election the National Party could form a government for a third term of office. The baseline models presented in this chapter demonstrate that relatively stable socio-structural patterns of voting persist, which are themselves the product of inequalities. Our focus here has been on the direct effects of patterns of inequality as they affected people’s lives, opportunities and interests, to the extent that we can locate those in social group memberships, incomes and assets. The two main parties still have their traditional profiles: Labour more likely to attract lower income voters with limited assets, National more likely to attract those with higher incomes and more assets. Income and assets also provide the expected foundations for people’s left–right positions, indicating potential support for the principle of collective risk-pooling, and thus policies favourable to income redistribution. But in 2014, the Labour Party failed to gain votes it needed from those on higher incomes who were more likely to be favourable to the principle of risk-pooling. Labour also failed to match National in the campaign funds that it secured and spent.
We also examined people’s perceptions of their security in terms of jobs and living standards, as a potential source of disruption of previous patterns of vote choice. A sense of insecurity mattered, but only on the margins. In the context of a growing economy, those margins were not big ones. In the next chapter, we move on to discuss National’s success in the context of the economy and other performance issues.
1 In multiple working adult households, we classify occupational class of the household by the occupation of the male in the household (the respondent his/herself, or the respondent’s partner). This reflects the reality of gender pay inequity, which means that in most cases the occupation of the male is a better guide to the economic position of the household. The NZES does not ask for the gender of respondents’ partners, but because most couples are made up of a male and female, this classification is the best reflection of the economic position of a male–female household that can be estimated from our data.
2 It is important to note that this estimate of class voting is ‘relative’. If one focuses on ‘absolute’ class voting, for example, because of the large gap between the National and Labour party votes in 2011, National gained a slightly higher share of the votes from manual/service households than Labour; however, this was no higher than National’s usual vote from this part of the electorate. But Labour’s share of the working class vote had shrunk to an historically low level in tandem with its low level of overall support (Vowles 2014b: 40).
3 Plotting this figure for the Green vote finds a flatter line for low-risk voters across the income scale, indicating some high-income low-risk support for the left, but confidence intervals are too wide for significance. Modelling the Green and Labour votes together generates a pattern very similar to that of Labour alone, although the addition of low-income/high-asset Green voters makes the two slopes more parallel.
Previous Next



