


 menu
A Bark But No Bite
10
Against the tide? Māori in the Māori electorates
As in most ethnically diverse societies, for reasons of history and culture, inequalities of income and assets are not spread evenly among the various ethnic groups in New Zealand. The biggest and most robust differences that occur in New Zealand are between the European or Pākehā majority and the indigenous Māori population, which are also the two largest ethnic groups in New Zealand society. Māori social and economic disadvantages are evident in a wealth of data indicating their poor health outcomes, lower life expectancy and a disproportionate contribution to the prison population (McIntosh 2012). Figures 10.1 and 10.2 display the data from the 2014 New Zealand Election Study (NZES) sample, with distributions consistent with the general patterns of official data available (Statistics New Zealand 2014e).
The Māori population is significant because Māori are the largest ethnic minority, and more so because of their indigenous status, giving them rights both in international law and under the Treaty of Waitangi (see Chapter 2). In this context, the discourse widens into debates about group rights and affirmative action to address inequality that can cut across ideas based on individual rights and equality before the law. The political importance of Māori in New Zealand politics is further enhanced by the existence of seven Māori electorates, which make it possible for Māori to elect Members of Parliament who can directly speak to their interests. The Māori electorates are a special category of electorate that cover the whole of New Zealand and overlie the general seats. The 2005 election brought about a new development in Māori politics: the capture of a majority of the seats by a genuinely independent Māori Party with the potential to act as a pivotal player in government formation, particularly from the 2008 election onward.
The politics of the Māori electorates have implications for the pursuit of Māori aspirations that include but also go beyond simply raising Māori incomes and wealth to levels more equal to those of European New Zealanders. The political actors who compete in the Māori electorates tend to have two priorities: property rights and self-determination (bound up in Article 2 of the Treaty of Waitangi); and ensuring that Māori obtain a fair share of the benefits of New Zealand citizenship (Article 3). That is to say, their priorities are social and economic equality (Orange 2011; Stevens 2015).
In this chapter, we investigate these two dimensions by examining how both relate to the electorate and party vote in the Māori electorates, and explore how attitudes towards inequality and the Treaty relate to one another, both in the Māori and general electorates. We thereby show that while differences in voting patterns between Māori and Pākehā remain significant, diversity among Māori is also shaping their politics.
First, we provide a brief historical overview of Māori politics and a descriptive analysis of party competition within the Māori electorates.
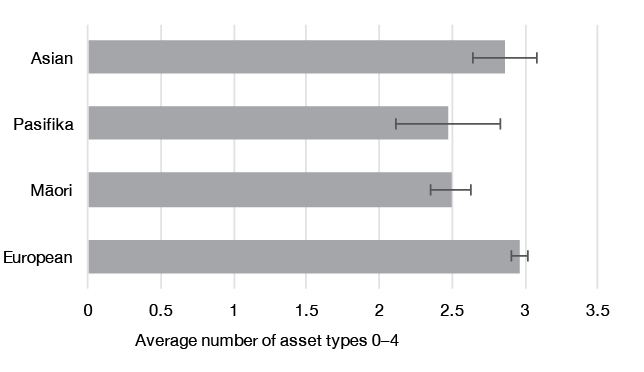
Figure 10.1: Average assets by ethnicity
Source: New Zealand Election Study 2014.
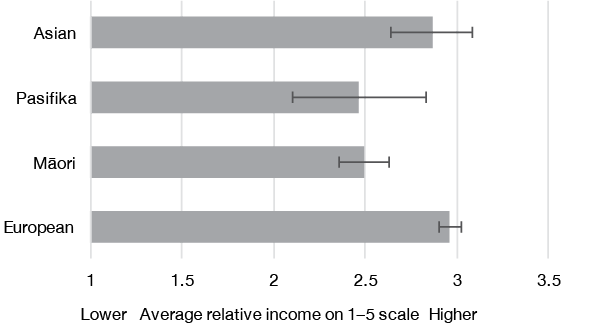
Figure 10.2: Average income by ethnicity
Source: New Zealand Election Study 2014.
The background of Māori electorates
When the New Zealand Constitution Act 1852 (UK) established a House of Representatives, those eligible to vote included all men over the age of 21 who owned, leased or rented a property of a certain value, including Māori men. But because most Māori property was held in common, very few qualified. Four Māori constituency seats were then created in 1867 and universal suffrage for Māori men was introduced in 1869. At that time, eligibility to vote required some ownership of individual property and therefore still excluded most Māori from the vote. Separate Māori representation without that requirement was a way of sidestepping the problem. Only a few years after 1867, relaxation of the requirement of individual property ownership for eligibility to vote would have extended voting rights to Māori without the need for Māori seats (Wilson 2010), but the creation of those electorates had taken Māori politics in a different direction. Conservative European or Pākehā New Zealanders have consistently opposed the existence of the Māori seats, and liberal Pākehā have defended them. Their abolition remains National Party policy, although National has so far never implemented that promise.
With the development of party politics in the 1890s, Māori MPs became associated with the Liberal Party that governed from 1891 until 1912. After 1912, Māori MPs aligned first with the conservative Reform Party, but this shift to the right was later reversed with the rise of the Rātana Movement. The Movement had emerged after World War One, its objectives being to restore the mana of the Treaty of Waitangi and to improve the social position of the Māori people. By the 1935 election, Rātana candidates had captured two of the four Māori seats, and in 1936 Rātana formally allied itself with the Labour Party. A third seat was won by Labour and Rātana in 1938, and the fourth in 1943 (Sullivan 2015). The National Party has had minor party status among Māori voters ever since. The Labour Party retained its dominance in Māori politics until the 1970s, reaching a peak of 80 per cent of the Māori electorate vote in 1972 (Chapman 1986).
Labour’s command of the Māori vote soon became much wider than its foundations in the Rātana movement. As Māori moved into the cities in the 1940s and 1950s, many became employed in low-income manual occupations and became members of trade unions affiliated with the Labour Party. Māori politics and working-class politics converged. In office between 1972 and 1975, the Third Labour Government under Norman Kirk and Bill Rowling probably did more than any previous government to recognise the uniqueness and importance of Māori culture.
From 1893 until 1975, people whose ancestry was predominantly Māori had been required to register on the Māori roll. Those with less than half of their ancestry being Māori were required to be on the general roll. In 1975, Labour amended the law so that anyone who could claim any Māori descent could choose to enrol on either the Māori or the general roll. Labour also removed the limitation of the number of four Māori seats, making it possible for their number to vary according to Māori enrolment. That overdue change was needed to ensure that Māori votes would count equally to those cast in the general electorates. It was reversed by the National Government that took power in 1975, but reintroduced in 1996 as part of the Mixed Member Proportional (MMP) electoral system. The number of Māori electorates currently stands at seven.
Progress under Labour was not enough in the context of higher expectations generated from the Māori renaissance in the 1970s. Matiu Rata had served as Minister of Māori Affairs in the Kirk Government (1972–1975). He left the Labour Party in 1979 to form an independent Māori party, Mana Motuhake. At subsequent elections, Rata slowly chipped away at Labour’s vote in the Northern Māori electorate. Ironically, he paved the way not for the victory of his own party but instead that of the New Zealand First party in 1993, in the form of its candidate Tau Henare (Sullivan and Vowles 1998).
The effects on Māori of the Fourth Labour Government (1984–1990) were very mixed. There was much greater recognition of the Treaty, with significant later effects. Treaty principles were embedded in legislation, with the effect that Treaty principles, if not the Treaty itself, have become recognised as part of New Zealand’s ‘unwritten’ Constitution. But Labour’s move to embrace the market in economic and social policy led to unemployment among the unskilled, disproportionately affecting Māori who tended to be concentrated in the manual working class (Statistics New Zealand 2016e). Mana Motuhake fought the 1990 election in a loose alliance with the NewLabour Party that had been formed by those who had left the Labour Party as a result of its shift to the right. In 1993, a more formal left Alliance came together including NewLabour, Mana Motukahe and the Green Party. The Alliance won two seats, one of which fell to Sandra Lee, Mana Motuhake’s leader, but in a general rather than in a Māori electorate, Auckland Central.
The transition to the MMP electoral system was accompanied by the removal of the ceiling on the number of Māori seats. In proportion to population, and as a result of choices between Māori and general electorate enrolments, the number of Māori electorates increased to five in 1996, the first election under MMP, six in 1999 and seven from 2002 onwards. The seven seats at the 2014 election are displayed in Figure 10.3.
Electoral outcomes in Māori electorates since 1996
At the first MMP election in 1996, there was a seismic shift in Māori politics. All five electorates fell to the New Zealand First party. This was despite leader Winston Peters’ and New Zealand First’s relative conservatism on Treaty issues (see Chapter 8; also see Sullivan and Vowles 1998). In 1999, another political earthquake of equal dimensions returned all six seats to Labour, in tandem with the formation of a new coalition government of Labour and the Alliance, in which Mana Motuhake had three MPs (Sullivan and Margaratis 2000, 2002). In 2002, divisions in the Alliance led to the departure of Mana Motuhake and the loss of its parliamentary representation at the election that year.
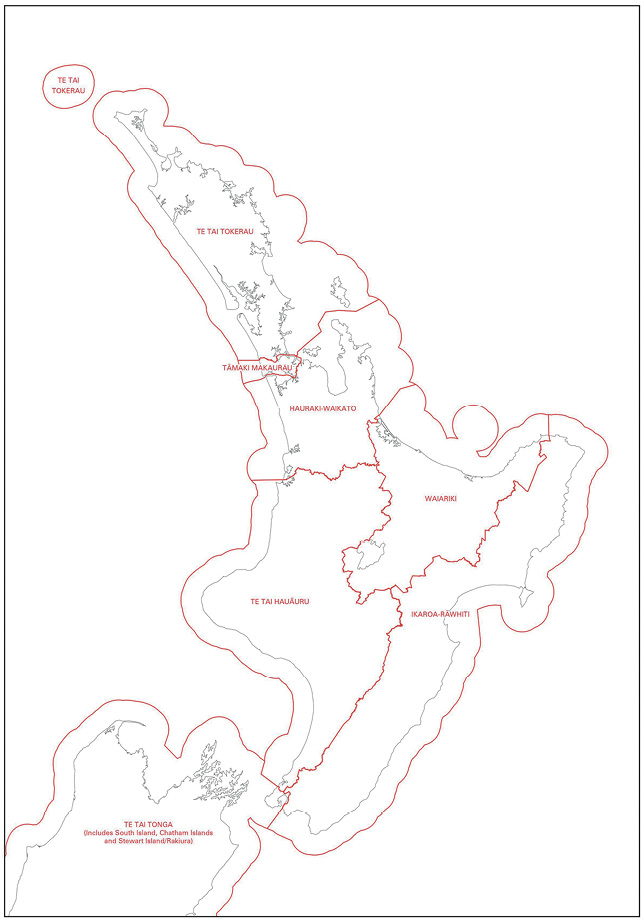
Figure 10.3: The Māori electorates in 2014
Source: Representation Commission 2014.
Dramatic at the time, Labour’s loss of the Māori seats to New Zealand First in 1996 turned out to be temporary. The link between Māori politics and class politics was apparently reset in 1999, almost as if nothing had happened. What followed next stretched the relationship to breaking point. In 2003, the Court of Appeal ruled that Māori iwi (tribes) could make claims in the Māori Land Court for customary ownership of areas of the foreshore and seabed. Fearful of public opinion, and under pressure from the New Zealand First and National parties, the Labour-led government legislated to ensure Crown ownership of the foreshore and seabed except where it was already in private hands, while conceding some Māori customary rights where they could be established. This prevented Māori from contesting whether or not they could gain those customary property rights through the courts. Labour had used parliamentary supremacy to override principles of indigenous property rights recognised in international law, not to mention the Treaty of Waitangi. A trend of constitutional recognition of Māori rights over nearly 20 years had been stopped in its tracks, if not reversed. To many Māori, it felt as if the bad old days of government-sponsored theft of their property had returned. Labour lost the support and trust of many Māori, who felt they had been betrayed.
Labour’s Māori MPs were put in a very difficult situation. Most stayed with the party and did their best to modify the law to allow the retention of some Māori rights. However, cabinet minister Tariana Turia left Labour and formed the Māori Party, which went on to capture four of the seven Māori seats at the 2005 election and won a fifth in 2008, when Labour lost office to the National Party. The Māori Party was not the first independent Māori party, but it has become more successful than any before, and was the first to form a significant relationship with a government on its own terms. For the time being at least, Māori politics had overcome class politics in the Māori electorates.
In 2008, the Māori Party became a support partner for the National-led government and this continued through to 2014, with Māori Party MPs Pita Sharples and later Te Ururoa Flavell taking the non-Cabinet position of Minister of Māori Affairs (Māori Development from 2014). The National Government repealed Labour’s Foreshore and Seabed Act, replacing it with the Marine and Coastal Area Act. This transferred the foreshore and seabed Labour had declared to be in public ownership to a situation whereby no one has ownership, with guarantees of public access, confirmation of existing fishing and aquaculture rights, and reopening potential recognition of Māori customary title through the courts (Hickford 2015). In law, customary title is not understood as a property right that can be sold and does not exclude public access. The law also put into statute the previous common law understanding that such rights could only be established without substantial interruption in use since 1840.
With the government having dropped the claim of Crown ownership, Māori opinion was partly but far from fully accommodated. Critics argued that the new legislation was little different from that made under Labour. Māori Party MP Hone Harawira refused to support it and was forced out of the party. He formed the left-wing MANA Party, resigned his seat and won a by-election early in 2011, retaining the seat at the general election later that year. The MANA Party attracted some prominent Pākehā leftists as well as former members of Mana Motuhake. The splitting of the vote in 2011 between the two independent Māori parties provided an opening for Labour to recapture one seat from the Māori Party, bringing Labour’s number of Māori seats back to three, from two in 2008. At the 2014 election, Harawira had allied MANA with Kim Dotcom’s Internet Party, and lost his seat. It was reclaimed by Labour, giving Labour six of the seven Māori electorate seats. The Māori Party was left with only a single Māori electorate seat in 2014, that of Te Ururoa Flavell in Waiariki, plus one list seat held by Marama Fox.
Table 10.1: Electorate votes and electorate seats in the Māori electorates 1996–2011
|
1996 |
1999 |
2002 |
2005 |
2008 |
2011 |
2014 |
|
|
Vote % |
|||||||
|
Māori |
- |
- |
- |
48.7 |
57.9 |
31.5 |
26.7 |
|
Mana Māori/MANA |
4.6 |
1.7 |
7.8 |
- |
- |
21.2 |
20.4 |
|
National |
4.5 |
3.9 |
6.9 |
- |
- |
- |
- |
|
Labour |
28.8 |
48.9 |
63.8 |
43 |
37.5 |
40.7 |
43.1 |
|
Green |
- |
- |
1.9 |
1.8 |
3.1 |
4.9 |
8 |
|
NZ First |
48.8 |
14.4 |
- |
- |
- |
- |
- |
|
Alliance |
7.4 |
8.5 |
- |
- |
- |
- |
- |
|
ACT |
1.4 |
0.6 |
- |
- |
0.5 |
- |
- |
|
United |
0 |
- |
2.6 |
- |
- |
- |
- |
|
Independents |
1.2 |
7.0 |
3.5 |
1.8 |
0.2 |
0.3 |
0.7 |
|
Other |
3.3 |
14.8 |
12.4 |
4.8 |
0.8 |
1.4 |
1.1 |
|
Electorate Seats |
|||||||
|
Labour |
0 |
6 |
7 |
3 |
2 |
3 |
6 |
|
Māori |
- |
- |
- |
4 |
5 |
3 |
1 |
|
MANA |
- |
- |
- |
- |
- |
1 |
0 |
|
NZ First |
5 |
- |
- |
- |
- |
- |
- |
|
Total |
5 |
6 |
7 |
7 |
7 |
7 |
7 |
|
Valid Votes |
101,377 |
103,782 |
104,639 |
129,289 |
132,797 |
122,408 |
142,867 |
|
Māori Overhang |
2 |
2 |
1 |
||||
|
Effective N Parties |
3.0 |
3.6 |
2.3 |
2.4 |
2.1 |
3.2 |
3.3 |
Note: Overhang effects arise when a party is entitled to fewer seats as a result of party votes than it has won constituencies.
Source: Electoral Commission 2016b.
Table 10.1 provides the official data for Māori electorate voting since the first election under MMP in 1996. The effective number of elective parties is an estimate of the number of parties weighted by their size (Laakso and Taagepera 1979): it starts at three, with Labour and New Zealand First as the main parties, but with a significant number of votes to Mana Māori, the Alliance and National. In 1999, Labour and several small parties benefited from New Zealand First’s collapse; the effective size of the electorate-vote party system was rising again. Labour’s recovery of dominance in the electorate vote in 2002 reduced the size of the effective party system to around two. Combined with the absence of National and New Zealand First candidates in the Māori electorates from 2005 onward, two-party competition between Labour and the Māori Party kept the effective number of parties around two until 2011. From then onwards, the appearance of the MANA Party has fragmented Māori electorate votes once more with the number of effective parties increasing to three.
Party by party, Table 10.1 documents the sharp drop in the Labour vote in 2005, Labour’s loss of four seats to the Māori Party in 2005 and Labour’s nadir both in terms of seats and votes in 2008. More to the point, it shows the weakness of Labour’s recovery. By 2014, Labour’s loss of electorate vote share in 2005 had not been recouped at all.
The split in the independent Māori vote is confirmed as the explanation for Labour’s recapture of all but one Māori seat in 2014. The combined vote for MANA and the Māori Party still outpolled Labour in the electorate vote across all the Māori electorates in 2014. Within the electorates that Labour won in 2014, the combined Māori/MANA vote outpolled Labour in three: Tamaki Makaurau, Te Tai Hauauru and Te Tai Tokerau. Promised coordination between the MANA and Māori parties in the 2017 election constitutes a serious threat to Labour’s control of those Māori electorates.
Much of Māori politics remains inherently connected to communities defined by tribes (iwi and hapu) and whanau (family and kinship connections), meaning the personal vote may become as important as the party (Godfery 2015: 253–59). Indeed, in their analysis of voting in the Māori electorates in the 1996 general election, Sullivan and Vowles (1998) found large effects for liking or disliking the candidates on offer. These candidate preferences had big effects on voting for New Zealand First, and were therefore a key explanation of the party’s success in capturing all the Māori seats. Comparable candidate effects in the general electorates were weaker. Analysis of the Māori electorate vote in 1999 told much the same story (Sullivan and Margaratis 2002).
Table 10.2 provides electorate-level detail on the changes that took place between 2011 and 2014. The differences between the electorates reflect incumbency, retirements, the death in 2013 of popular Labour MP for Ikaroa-Rāwhiti, Parekura Horomia, and a concerted campaign against MANA MP Hone Harawira in the Te Tai Tokerau electorate that was won by Labour’s Kelvin Davis (Godfery 2015: 253–56). In 2014, Horomia’s replacement as Labour candidate, Meka Whaitiri, was unable to claim much of Horomia’s personal vote. The MANA Party made its only significant gains in that seat, although not enough to threaten Labour. Meanwhile, the retirement of the Māori Party’s two senior MPs provided an opening for Labour; the most likely explanation of the successes of Labour’s Peeni Henare and Adrian Rurawhe is the loss of Tariana Turia’s and Pita Sharples’ personal support. Whakapapa or family-based politics play a central role in Māori elections (Godfery 2015: 258–59). Penni Henare came with an advantage as his family has had a long and prominent history in Māori politics. He failed to shift as many votes to Labour as his colleague Adrian Rurawhe, but Rurawhe had the advantage of family connections to the founders of the Rātana Church. Rino Tirikatene, re-elected in Te Tai Tonga for Labour, has similar Rātana links. Meanwhile, long-standing Labour MP for Hauraki-Waikato, Nanaia Mahuta, is closely linked to the Māori King Movement and therefore the Tainui iwi leadership in the Waikato.
Table 10.2: Change between 2011 and 2014 in the seven Māori electorates
|
Change in 2014–2011 Vote Shares |
2011 Party holding seat > 2014 party holding seat |
|||||
|
Labour |
Māori |
MANA |
Winner 2011 |
Winner 2014 |
||
|
Hauraki-Waikato |
+3.18 |
+5.34 |
–7.11 |
Nanaia Mahuta |
Nanaia Mahuta |
Lab>Lab |
|
Ikaroa-Räwhiti |
–14.44 |
–4.85 |
+9.82 |
Parekura Horomia* |
Meka Whaitiri |
Lab>Lab |
|
Tämaki Makaurau |
+3.19 |
–9.55 |
–2.74 |
Pita Sharples** |
Peeni Henare |
Māo>Lab |
|
Te Tai Hauäuru |
+11.49 |
–14.9 |
+1.23 |
Tariana Turia** |
Adrian Rurawhe |
Māo>Lab |
|
Te Tai Tokerau |
+7.63 |
–4.73 |
–2.01 |
Hone Harawira |
Kelvin Davis |
Man>Lab |
|
Te Tai Tonga |
+2.3 |
–6.93 |
+1.96 |
Rino Tirikatene |
Rino Tirikatene |
Lab>Lab |
|
Waiariki |
+2.84 |
+2.51 |
–6.75 |
Te Ururoa Flavell |
Te Ururoa Flavell |
Māo>Māo |
|
All |
+2.4 |
–4.79 |
–0.75 |
|||
Notes:
* Died in office and succeeded by Meka Whaitiri at a by-election in 2013.
** Retired in 2014.
Source: Electoral Commission 2016b.
To test again if candidate effects tend to be higher in the Māori electorates, we focused on the link between liking the Labour candidate and the probability of voting for that candidate; Labour was the party running the most incumbent candidates, making this the best way to test the hypothesis (see Karp et al. 2002). If previous research was to be confirmed, first we would expect to find the net effect of most liking the Labour electorate candidate to both substantively and significantly affect the probability of a Labour electorate vote. Most of all, we also expect that effect to be greater in Māori than in general electorates.
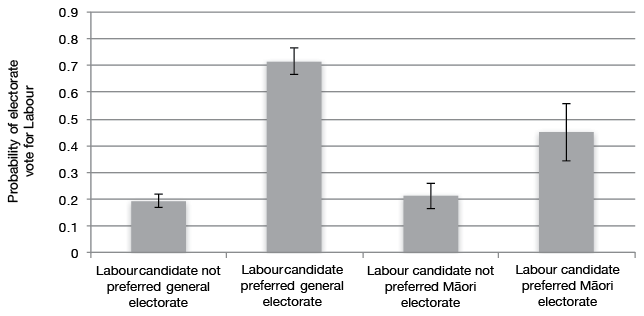
Figure 10.4: The effects of liking the Labour candidate the most across the general and Māori electorates
Source: Appendix, Table 10.A1.
Based on a multilevel random effects model with various control variables (see Appendix, Table 10.A1), the findings presented in Figure 10.4 show that the effects of preferences for or against Labour candidates are very strong, but unexpectedly are twice as big in general electorates as in Māori ones. This does not deny the possible effects of family-based politics or whakapapa (genealogy) in the Māori electorates, but indicates something else is going on in the general electorates that merits further research.
Table 10.3 provides the data for the party vote in the Māori electorates since 1996. With all registered parties recorded, the estimates of the effective number of elective parties summarise and display the greatly increased fragmentation of the party vote among Māori from 2011 onwards, confirming to a greater extent a pattern that was also found for the electorate vote (see Table 10.1). Labour’s electorate vote had collapsed in 2005, but its party vote had held up. On the surface, this might seem puzzling. It makes sense in the context of the 2005 election. In 2005, the National Party was led by Don Brash, whose speech to the Orewa Rotary Club in January 2004 on the special status of Māori people had intensified Māori/Pākehā tensions and confirmed that National had even less sympathy than Labour for the protection of Māori property and political rights. This ‘wedge’ politics of ‘us and them’ galvanised voters. Labour only just managed to pull ahead of National in the party vote and form a government (Sawer and Hindess 2004). Many Māori found Brash’s rhetoric and policy substance unpalatable, so had a strong incentive to give their party vote to Labour.
Table 10.3: The party vote, Māori electorates, 1996–2014
|
1996 |
1999 |
2002 |
2005 |
2008 |
2011 |
2014 |
|
|
Māori |
- |
- |
- |
27.7 |
28.9 |
15.6 |
14.1 |
|
Mana Māori/MANA |
3.3 |
4.4 |
4.0 |
- |
- |
13 |
10.2 |
|
National |
6.1 |
3.9 |
4.2 |
4.3 |
7.5 |
8.6 |
7.9 |
|
Labour |
31.9 |
55.1 |
53.7 |
54.6 |
50.1 |
41 |
41.2 |
|
Green |
- |
5 |
10.7 |
3.3 |
3.9 |
10.3 |
11.2 |
|
NZ First |
42.3 |
13.2 |
14.9 |
6 |
6.1 |
9.5 |
13 |
|
Alliance |
8.5 |
6.7 |
- |
- |
- |
- |
- |
|
ACT |
1.1 |
0.8 |
1 |
0.2 |
0.5 |
0.2 |
0.2 |
|
United |
0.1 |
0.7 |
2.5 |
0.5 |
0.1 |
0.6 |
0.1 |
|
Other |
6.7 |
9.1 |
9.0 |
3.4 |
2.9 |
1.7 |
2.2 |
|
Valid Votes |
101,630 |
104,660 |
108,270 |
134,452 |
138,054 |
129,209 |
149,259 |
|
Roll |
141,929 |
159,400 |
194,114 |
208,003 |
229,666 |
233,100 |
239,941 |
|
Split Vote* |
32.8 |
39.1 |
48.1 |
41.5 |
47.6 |
51.5 |
52.1 |
|
Non-standing %** |
0.7 |
3.9 |
20.6 |
11.1 |
15.1 |
18.4 |
21.8 |
|
Real split |
32.1 |
35.3 |
27.5 |
30.4 |
32.6 |
33.1 |
30.3 |
|
Effective number of parties |
3.4 |
3.0 |
3.0 |
2.6 |
2.9 |
4.2 |
4.2 |
Notes:
* Percentage of those who cast both party and electorate votes.
** Percentage of (party votes for parties not standing candidates + electorate votes for non-list party candidates)/total party vote.
Source: Electoral Commission 2016b.
The electorate vote was a different story. Māori could afford to reject Labour in their electorates, and many did so. Many had ‘a bob each way’, splitting their votes between Māori and Labour, helping to push Labour ahead of National in the party vote and generating a two-seat overhang, a result of the Māori Party winning more electorate seats than the number warranted by its share of the party vote. Table 10.3 also provides the split voting data. Some Māori cast their party votes for National and New Zealand First despite those parties not running in their electorate seats. Taking these votes out, overall levels of split voting in the Māori electorates are quite close to those found in the general electorates. The overall effects of split voting in most general electorates go in all directions, so offset each other. In the case of the Māori electorates, more distinct patterns led to the overhang effects from 2005 and 2008 (two seats) through to 2011 (one seat). By 2014, the loss of all but one Māori electorate brought an end to the Māori overhang.
The drop in Labour’s party vote in the Māori electorates did not occur until 2011. It appears that Labour’s loss was the Green Party and New Zealand First’s gain, although movements at the individual level were probably more complex. Māori conservatives were attracted to the revitalised New Zealand First Party that had re-entered parliament in 2011. Meanwhile, the Green Party had attracted some strong Māori MPs, including co-leader Metiria Turei. Indeed, the Green Party outpolled the MANA Party in the Māori electorate party vote in 2014. The Green Party strongly opposed the Foreshore and Seabed Act 2004 and the replacement Marine and Coastal Area Act 2010, making it another possible destination for Māori disappointed with Labour and the Māori Party.
Electoral turnout in Māori electorates
A high level of non-voting has also long been a feature of the Māori electorates. Figure 10.5 displays the trends from 1987 onward, comparing turnout as a percentage of those enrolled with that on the general rolls. The gap is relatively constant over time, widening in 1990 and 1993, no doubt the result of a campaign by the Māori Council of Churches for Māori not to vote in 1990 in order to put pressure on the government to bring about Treaty-based justice for Māori.
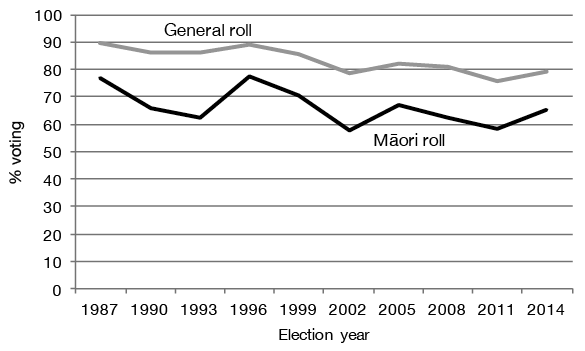
Figure 10.5: Electoral turnout as percentages of electoral enrolment, 1987–2014
Source: Electoral Commission 2002, 2016b.
There are several plausible explanations for the lower turnout in the Māori electorates than in the general electorates. Standard theories suggest that lack of competition in the Māori seats until 1996 would have provided low incentives for Māori to acquire a habit of voting (Franklin 2004). Turnout is also strongly affected by resources, defined broadly (Brady, Verba and Schlozman 1995). People in low-income households with low education are less likely to vote, whatever their ethnicity, and Māori have been more concentrated in those groups than others. Analysis in 1990 indicated that social structure and demographic variables accounted for about half the gap between Māori turnout and that of others, with the other half unexplained (Vowles and Aimer 1993: 54–56). With a narrower range of social structure controls, a persistent Māori effect can be found in longitudinal analysis ranging between 1963 and 2005 (Vowles 2010). On the other hand, more in-depth analysis of Māori turnout does find that age and demographics have bigger effects than culture (Fitzgerald, Stevenson and Tapiata 2007).
The advent of greater competition in the Māori electorates since the introduction of MMP might have been expected to increase turnout in 1996, when the five electorates were captured by New Zealand First. There may also have been an MMP effect associated with the expansion of the number of Māori seats. Post-MMP analysis indicates that variations in turnout in the Māori electorates are driven by closeness or distance in national-level competition between National and Labour, not at all by variations in competitiveness between the electorates themselves (Vowles 2015a). Admittedly, the steeper Māori turnout increase in 2005 compared with the general roll coincides with the Māori Party’s first participation in a general election, but this was also in tandem with a very tight Labour–National race, with Māori issues highly salient in the campaign. Despite increased competitiveness in the Māori electorates, Māori turnout continues to be lower than turnout on the general roll, although the trend in turnout over time is similar in both. Variation in turnout between the Māori electorates and between elections is mainly the result of general electorate level campaigning and the intensity of national campaigns.
Data from the Electoral Commission’s official records of voting and not voting show those on the Māori roll are less likely to vote than Māori on the general rolls, with Māori on the general rolls tending to sit midway between those on the Māori roll and non-Māori voters on the general roll. Being on the Māori roll is associated with lower turnout. Māori scholars hypothesise that the long-term effects of colonisation and the former marginal nature of the Māori seats continue to affect Māori political behaviour into the present. This is a plausible explanation that again emphasises turnout as a habit. It is also consistent with lower levels of political efficacy among Māori (Fitzgerald, Stevenson and Tapiata 2007). There may be an additional explanation since 1996, when numbers on the Māori roll first began to have an effect on the number of Māori electorates. Some may feel that choosing the Māori roll is an act of participation in itself as it helps to maximise the number of Māori electorates ensuring direct representation by a Māori MP.
A cross-cut cleavage?
While there is a distinct Māori/non-Māori cleavage in turnout and party preferences in New Zealand (see Chapter 4; also see Sullivan, von Randow and Matiu 2014), there is also considerable diversity among Māori in their political opinions and behaviour. Māori society itself is diverse, containing many actors with different interests. Migration out of rural tribal areas has led to the development of large urban clusters of Māori, some of whom who have lost connections to their iwi. Over the last 20 years, this trend has reversed with a high percentage of Māori now able to identify their origins (Kukutai and Rarere 2015). But not all Māori have been in a position to share the benefits associated with assets transferred to iwi as a result of the Treaty settlement process. Māori also vary in the depth of their immersion in Māori society and culture. Four out of five do not speak te reo, the Māori language, to a conversational level, and the proportion able to do so has declined over the last 15 years (Statistics New Zealand 2016f). The resources commanded by iwi also differ—some made early settlements and have become prosperous, others have been less successful.
There are also generational differences. These can be illustrated by differences in the proportions of age groups among people of Māori descent that chose between the Māori and general electoral rolls in 2014. Since 1996, that choice has taken on greater political significance, because the more who enrol on the Māori roll, the greater the number of Māori seats. A campaign to convince Māori to opt for the Māori roll was initially successful, increasing the number of seats from five to seven, but there has been no further increase since 2002.
Figure 10.6 shows the distribution of people of Māori descent between the Māori and general rolls at the 2014 election, broken down by four age groups defined by the three cut points: in 1976, when choice between the two rolls was permitted; in 1996, when the numbers opting to go on the Māori roll could result in a change in the number of seats; and in 2001, the closest point in the data to identify the 2004–05 events of the divisive Brash Orewa speech and the Foreshore and Seabed Act. The first age group whose members were able to choose between the two rolls was that entering voting eligibility between 1976 and 1996. They display an approximate 2:1 ratio favouring the Māori roll. This group also corresponds to the generation most caught up in the Māori political and cultural renaissance of the 1970s and 1980s. Despite the greater incentive to go on the Māori roll, the ratio drops from the age group becoming eligible in 1996 and afterward, although a significant majority still opt for the Māori roll. Post-2001, the year closest to the emergence of the Foreshore and Seabed issue given the age-band data available, the proportions opting for the rolls have moved even closer together. While the majority of the youngest age group of people of Māori descent opt for the Māori roll, many also choose the general roll.
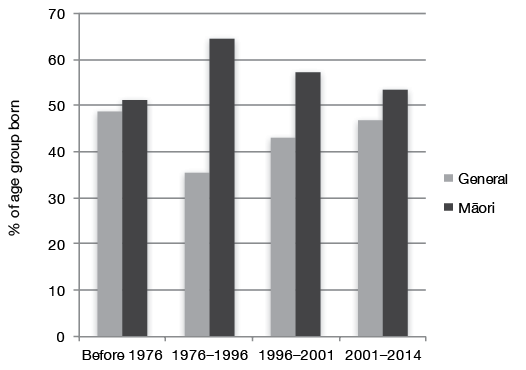
Figure 10.6: Percentages on the Māori roll by age groups defined by entry into voting eligibility, 2014
Source: Electoral Commission 2014b.
Besides generational differences in opting for the general or Māori roll, we would expect socio-economic diversity within the Māori community to be associated with differences in party preferences between various socio-demographic groups. Table 10.A2 in the Appendix displays the baseline social structure and demographic model for the electorate vote in the Māori electorates. Those who chose the Māori Party are older, suggesting that party’s support draws more from the generation of the Māori revival, associated with speaking te reo, but not significantly with an iwi affiliation. Alongside this, Māori Party voters have lower education than Labour voters, and their parents are less likely to have been Labour voters. However, they have more assets than Labour voters. MANA electorate voters also tend to speak te reo, and are more likely to be found in manual households than Labour voters. Māori who chose to vote Green with their electorate vote are more likely to live in an urban area and have fewer assets compared to Māori who voted Labour. They are also less likely to have Labour-voting parents.
Based on this model, Figure 10.7 further explores the link between assets and the party preference for the electorate vote among the Māori electorates. Since the number of assets had no appreciable effect on the probability of voting MANA, those estimates are not reported. We see that having a high accumulation of types of assets decreases the likelihood of voting Labour or Green. The reverse is the case for the choice to vote for the Māori Party. Māori Party voters tend to be those who have become more successful in the era of Māori revival. The slope of the Labour probability line is not very steep with Māori more likely to support Labour, including those with assets. Moreover, there is no significant difference in the likelihood of voting Labour or the Māori Party among Māori voters with four types of assets.
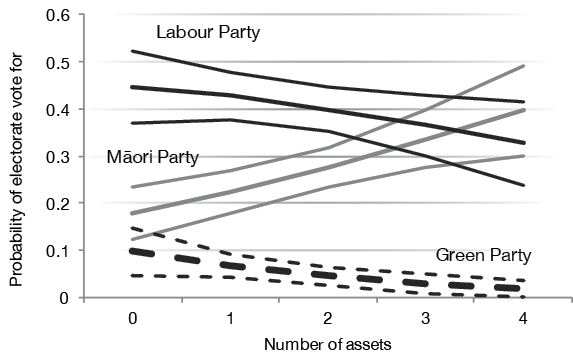
Figure 10.7: Asset ownership and the probabilities of an electorate vote for Labour, the Māori Party or the Green Party in the Māori electorates
Source: Post-estimation from Appendix, Table 10.A2.
As discussed in Chapter 4, people’s party choices tend to be influenced by their parents’ party choices. Party choice may be a habit passed down between generations (Jennings, Stoker and Bowers 2009). Earlier chapters have shown significant effects of recall of parental partisanship on vote choices and political attitudes. Figure 10.8 shows that such generational transmission of a Labour electorate vote is strong in the Māori electorates. Those who had two parents voting Labour when they were 14 had a 50 per cent probability of voting for Labour, compared to 30 per cent among those who parents did not vote Labour. The strong generational transmission reflects a hard core of Māori Labour loyalists, many of whom seem to have remained with the party after 2005, despite the Foreshore and Seabed legislation.
Shifting our attention to the party vote in the Māori electorates, we find that there are significant differences in the structure of Māori voting between the electorate vote and the party vote (Appendix, Table 10.A3). This is not surprising given the patterns of split voting in the Māori electorates based on official data (Electoral Commission 2016c). A third of those who voted Labour with their party vote, voted differently with their electorate vote. Specifically, 13 per cent of them gave their electorate vote to Internet-MANA and 11 per cent gave it to the Māori Party. Looking at the transfers in the other direction, a third of those who voted Labour with the electorate vote voted differently with their party vote: 13 per cent selected New Zealand First and 8 per cent chose the Greens. In the Māori electorates, a significant proportion of the voters thus split their vote, and the party vote model therefore differs from the electorate vote model.
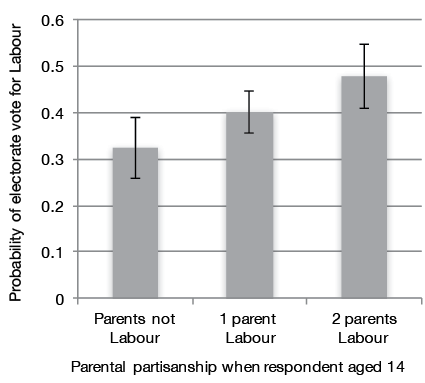
Figure 10.8: Parental partisanship and the Labour electorate vote in the Māori electorates
Source: Appendix, Table 10.A2.
Whereas age did not influence electorate vote choice, when looking at the party vote choice, age effects do occur. In particular, Internet-MANA appealed significantly more to older Māori, the Green Party more to the young, with middle-aged voters as likely to vote for the Green Party or for Internet-MANA (Figure 10.9). Other than the assets scale, the probability effects for which are plotted below in Figure 10.10, no other background variables had significant effects on the party vote, including iwi association. The null finding for parental partisanship is important here; past loyalties continue to anchor the Labour electorate vote among Māori, but not the party vote. In terms of assets, Labour appeals particularly to those with few assets. All other parties and non-voters tend to be found among those with more assets. In this sense, a class foundation for Labour’s vote in the Māori electorates is evident in terms of both the electorate and party votes, but is strongest in the party vote.
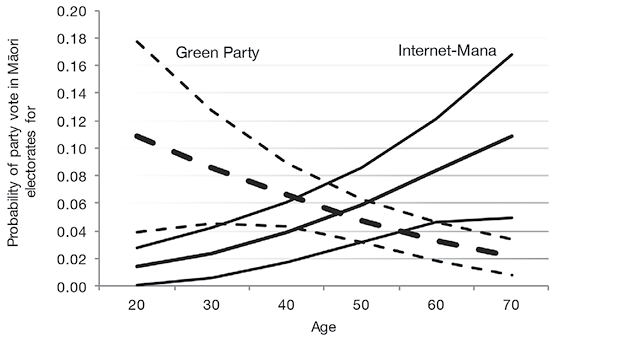
Figure 10.9: Age and the probabilities of a party vote for the Green and Internet-MANA parties in the Māori electorates
Source: Appendix, Table 10.A3.
We expand the analysis of the party vote in the Māori electorates to include political attitudes towards the legal status of the Treaty and to inequality, adding these to the baseline model (see Appendix, Table 10.A4). Whether the Treaty should be included in the law is based on a five-point scale reversal of the question: ‘The Treaty of Waitangi should not be a part of the law’. It is worth noting here that the inclusion of the Treaty was the subject of a ‘National Constitutional Conversation’ held between 2011 and 2013. We find, however, that there is no significant variation on Treaty matters except for those Māori who vote National, who predictably tend to take a more conservative position than Māori who give their party vote to Labour.
As one might expect, higher toleration of inequality is associated with voting for National, but also with not voting. The higher the opposition to inequality, the greater the probability of Māori electorate voters to support Labour, the Green Party and even New Zealand First. Figure 10.11 plots the probabilities for not voting and for voting Labour. To better understand the alignment of Māori electoral politics on the two dimensions of Treaty rights and inequality, Figure 10.12 presents the mean or average positions of Māori electorate voters and non-voters on both dimensions. Figure 10.13 does the same for general electorate voters. When comparing both figures, it is evident that the opinions among general electorate voters are spread a little more widely than among the Māori electorate voters.
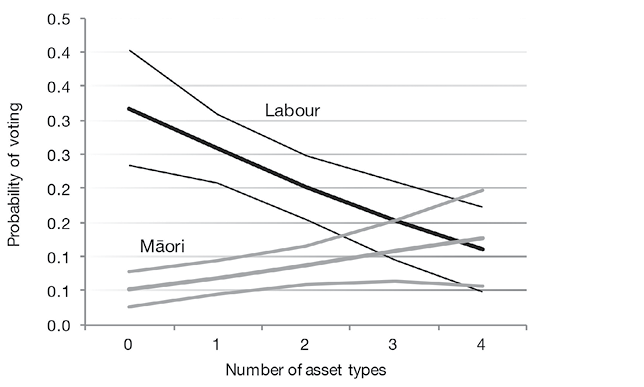
Figure 10.10: Assets and the probabilities of a party vote for Labour and the Māori Party in the Māori electorates
Source: Appendix, Table 10.A4.
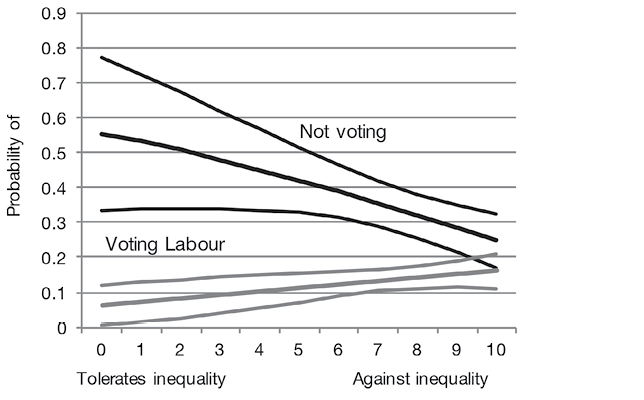
Figure 10.11: Inequality and the probabilities of a party vote for Labour or not voting in the Māori electorates
Note: Attitudes towards inequality are estimated by adding to what extent (five-point scales) respondents agree with two statements: ‘Differences in incomes in New Zealand are too large’; and ‘Government should take measures to reduce differences in income levels’.
Source: Appendix, Table 10.A4.
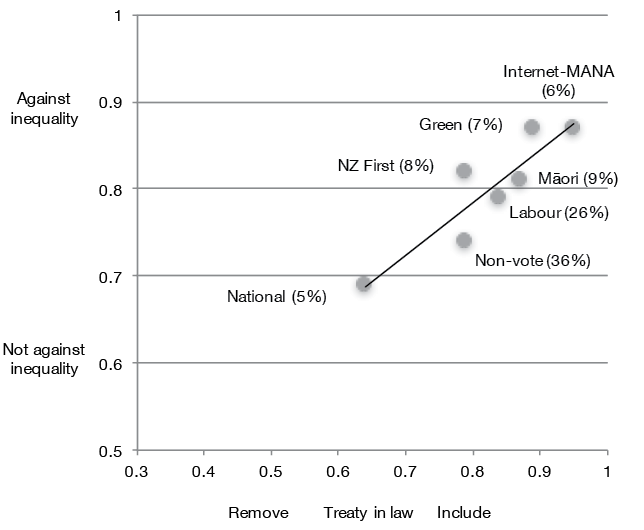
Figure 10.12: The alignment of voting groups on attitudes towards inequality and the Treaty in the Māori electorates
Notes: The Treaty/self-determination dimension is based on the question asking respondents to what extent (on a five-point scale) they agree that ‘Reference to the Treaty of Waitangi should be removed from the law’. Original answers from 1 to 5 have been recoded to range between 0 and 1 and in such a way that a higher value refers to support for keeping the Treaty in the law. Percentages between brackets refer to percentage of voters.
Source: New Zealand Election Study 2014.
National voters stand out as less supportive of giving the Treaty legal status and are less opposed to inequality than other voters. The average New Zealand First Māori electorate voter is considerably more favourable to the Treaty than the New Zealand First party itself, given that the party has campaigned for the Treaty to be removed from the law. The key point to note is that the average positions across the two dimensions are correlated and clustered around a line that represents the slope of the relationship; that is, Māori electorate party voters can be seen as aligned on the two dimensions, and these are related.
As a comparison, Figure 10.13 presents the position of voting groups on the same attitudes towards inequality and the Treaty in the general electorates.
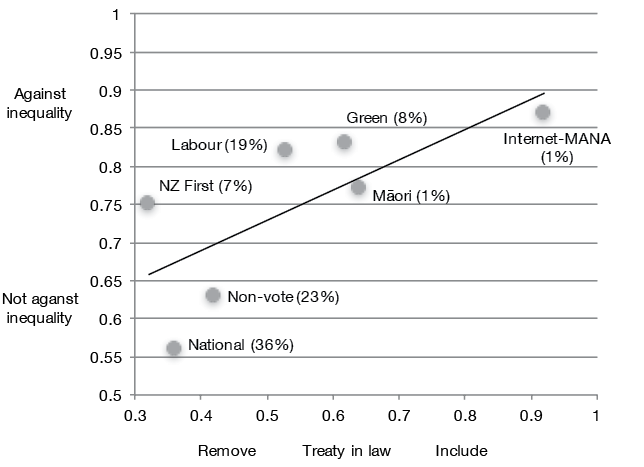
Figure 10.13: The alignment of voting groups on attitudes towards inequality and the Treaty in the general electorates
Source: New Zealand Election Study 2014.
Figure 10.13 shows that the two dimensions are less closely related in the general electorates than in the Māori electorates. The line that represents the slope of the relationship is not as steep and the average positions are further away from the line. When Māori electorate voters think about the Treaty and about inequality, they tend to see a closer relationship between the two issues than general electorate voters. In their party choices, they have clustered together in a way that confirms and strengthens a relationship, with support for inclusion of the Treaty in the law being related to rejecting inequality, that is a little less apparent among voters in the general electorates. This finding also confirms research on the 2011 election whereby those on the Māori electoral roll remain orientated to the left on policy issues such as opposition to privatisation of state assets (Sullivan, von Randow and Matiu 2014).
Conclusions
If the success of the Labour Party in recapturing almost all of the Māori electorates in 2014 was ‘against the current’, it was the ability of Labour to anchor itself in place that made the difference. The Labour Party did not regain significant headway in votes, particularly when one takes the extent of its 2005 loss as the benchmark. Labour’s main rivals lost seats because they were competing for the independent Māori vote that the Māori Party had mobilised in 2005 but which has since fragmented. Labour’s MPs and candidates had appeal, as did the only remaining Māori Party incumbent, Te Ururoa Flavell. With weaker candidates, Labour might have been less successful. Given the importance of incumbency, had Tariana Turia and Pita Sharples not retired from parliament, the Māori Party might have retained their seats, or at least come closer to doing so. The significance of parental party loyalties in underpinning the Labour electorate vote should not be forgotten; Labour was able to benefit from historic political capital. But this is an asset the value of which may depreciate over time.
The party system in the Māori electorates has become highly fragmented. Increasingly distinct from that of the general electorates, it is mobilised around the Treaty as a matter of difference over strength of opinion but not direction; there are very few Māori electorate voters who do not support the Treaty. As one might expect, Māori electorate voters connect their Treaty views a little more closely to their views about inequality than general electorate voters, and the way their votes are distributed emphasises this relationship.
Beneath the surface, the Māori Party appeals most to those Māori who have the most assets, and who belong to the first generation of the Māori revival, and who speak te reo. MANA electorate voters have a similar profile, but fewer assets and tend to be working class. Low-asset Māori tend to vote more for Labour and the Green Party, and the Green Party has an increasing appeal to young Māori voters, particularly in urban areas. We might therefore expect even more differences to emerge among Māori in the future around the two key Treaty dimensions that can be identified in their politics: self-determination and equality as citizens.
Previous Next



