


 menu
A Bark But No Bite
11
Many political scientists argue that a participatory public is crucial for an effective democracy. They see threats to political equality and democratic performance in the form of systematic and persistent patterns of unequal participation by socio-economic status, age, gender and ethnic background (for example, Verba 1996). Debate continues about whether or not there are connections between low levels of turnout, changes in political participation in general and growing economic inequality. As noted in Chapter 1, several scholars have argued that there is a linkage between low turnout and increasing levels of inequality in advanced democracies (Boix 2003; Solt 2008), while others claim the link is tenuous at best (Stockemer and Scruggs 2012).
This chapter reviews some New Zealand evidence. New Zealand has experienced a combination of steady decline in turnout and increasing income inequality since the mid-1980s, making it a case well worth examination. We examine if there are biases in turnout, and whether they might be reduced by efforts to mobilise voters by traditional means or by new forms of media. We also address claims that some new forms of civic participation may become more significant than voting for new generations of New Zealanders in the twenty-first century.
Electoral turnout and inequality
Arend Lijphart has labelled low turnout the ‘unresolved dilemma’ of democracy, and has suggested that it makes the operation of electoral democracy unequal: some voices are heard and others are silent (Lijphart 1997: 1). However, others argue that this conclusion requires more analysis (for example, Lutz and Marsh 2007). Even though there may be apparent evidence of a connection in some cases, there may be other cases where there is none. It is sometimes suggested that non-voters may actually be satisfied with democracy, and thus lack the motivation to vote. This is refuted by European research that has found that non-voters tend to be less satisfied than voters (Grönlund and Setälä 2007), as was also the case in New Zealand in 2011 (Vowles 2015a: 290) and in 2014. However, the literature does not confirm a general finding that preferences of voters and non-voters are significantly different from each other, or that higher turnout would shift an electoral outcome consistently to the left (Grofman, Owen and Collet 1999; Bernhagen and Marsh 2007). The key issue does not seem to be partisan choice: if voters are consistently less likely to be young and poor, political parties whether of the right or left may be less likely to pay attention to their needs, and inequalities may persist or even increase.
Discussion of turnout loomed large in the months before and after the 2014 general election in New Zealand. A week after the election, a satirical story was posted on the Snoopman website with the headline, ‘New Zealand PM John Key’s suppressed “missing million” voters letter’. The ‘letter’ congratulated non-voters on helping to secure a third term for National (Snoopman 2014). The concept of the ‘missing million’ non-voters had entered political discourse in 2011 (Collins in Vowles 2014a: 53). While the official turnout rate in 2014 (76.7 per cent) was not as low as in 2011 (74.2 per cent), it was still lower than most earlier elections (Mitchell 2014).
Angst had been widespread since report of the low turnout rate in 2011. As Vowles (2014a: 53) noted, ‘to find a New Zealand election with lower official turnout, one must go back to 1887, well before when women attained voting rights’, making ‘turnout in 2011 the lowest ever experienced in the country under conditions of full adult suffrage’. The 2011 election also represented a further drop in the Labour vote. In Australia and New Zealand, as elsewhere, it is often assumed that the majority of non-voters are likely to be on the left (Farrar 2014b; Jackman 1999; Salmond 2014) because they are also more likely to be young, lower educated, non-European and poor (Electoral Commission 2014c; Statistics New Zealand 2014c).
After the 2011 election, the New Zealand Electoral Commission identified low turnout as a problem to be addressed. For the Electoral Commission, increasing turnout is not about partisan or policy preferences but about maintaining ‘a healthy democracy, which should be regarded as a matter of strategic national interest’ (Electoral Commission 2014c). In May 2014, the Electoral Commission hosted a day-long conference titled ‘Valuing our Vote’. The day received considerable media coverage and brought together local and international leaders in civic participation to consider how best to address voter decline in New Zealand (Electoral Commission 2014d). The Electoral Commission also did much more to encourage Advance Voting in 2014, and there was a significant increase: up from 15 per cent in 2011 to 29 per cent in 2014 (Electoral Commission 2015a: 4). It remains unclear whether or not those who took up this option were already likely to vote.
Various explanations for declining voter turnout in New Zealand have been canvassed elsewhere (Vowles 2002a, 2010, 2014a, 2015a). They focus on a mixture of individual and contextual factors. For example, age, income, education and ethnicity are often correlated with low turnout, with younger, lower income and lower educated people and those with a non-European background being less likely to vote. Contextual factors also matter: voter mobilisation by parties of those otherwise unlikely to vote; the extent to which party policies are polarised; and the competitiveness of a contest (Franklin 2004; Jaime-Castillo 2009).
The National Party’s opinion pollster David Farrar analysed vote and turnout change in safe National seats between 2008 and 2011. He concluded that ‘contrary to “received wisdom” it was National that suffered from the reduced turnout in 2011’ (Farrar 2014b). A month later, at the National Party’s conference, prime minister John Key told delegates that members should not take it for granted that it was only left-leaning voters who fail to turn out to vote. Drawing on Farrar, the prime minister stated that in ‘the ten safe National seats where many people obviously thought it was a foregone conclusion, turnout fell by more than 6 percentage points compared to 2008, and if that happens again we could easily find ourselves on the opposition benches’ (Radio New Zealand 2014c; The Nation 2016).
The concern with the implications of low turnout continued throughout the campaign. Various reports claimed that party strategists saw it as a major concern (Armstrong 2014d, 2014e; James 2014). Labour’s strategists were worried that disillusionment with the party under Cunliffe’s leadership would make Labour-leaning voters see simple abstention as the more comfortable option than switching to the Greens, Internet-MANA or New Zealand First.
High-profile attempts were made to get people under 30 out to vote, by not-for-profit organisations, computer application developers, the Electoral Commission and musical artist Lorde. Two weeks before the election, nearly 200,000 had not enrolled (Whelan and Hunt 2014). Young people are invariably less likely to vote than older people, but if the age gap grows (because voting is habitual and best acquired young, as they age young non-voters become older non-voters), we will see the generational replacements of keen voters with apparently more indifferent non-voters (Blais and Rubenson 2013; Franklin 2004; Vowles 2010; see also Rusk et al. 2004; Dalton 2007; Lyons and Alexander 2000; Wass 2007; Wattenberg 2007).
The small recovery in turnout in 2014 was a change in the right direction. Looking at the situation from a partisan angle, it did not seem to benefit Labour. One can inquire more deeply into this at two levels: electorate by electorate, as did Farrar for the 2011 election, or using the 2014 New Zealand Election Study (NZES) survey data. In the latter case, the numbers who shift are too small for anything more than speculation. Table 1.2 in Chapter 1 shows that net flows to and from non-voters for the two main parties between 2011 and 2014 may have been effectively zero, though flows to and from National into and out of non-voting were larger than Labour’s. The Green Party and New Zealand First may have been the main beneficiaries of the turnout increase.
Like National Party pollster David Farrar in 2011, from official electorate voting data we can observe turnout changes in 2014 in strongly held Labour and National electorates. Because of boundary changes between 2011 and 2014, we rely on a subset of electorates where boundaries did not change. From those, Table 11.1 takes three more or less representative electorate seats held by each party, and compares change in enrolment and turnout. Doing this, we must again be wary of the ecological fallacy (see Chapter 7): the changes may not represent what individuals were doing. For example, voters for party A might be responsible for a change in turnout in an electorate held by party A; voters for party B might be equally responsible for the change. Table 1.11 tells us that official turnout was up in both National and Labour electorates. The table also shows us that enrolment was down, and down much more in Labour than in the National-held electorates.
Table 11.1: Change in turnout, enrolment base and change in enrolment, age-eligible base
|
Electorates |
Turnout change |
Enrolment change |
|
National-held |
||
|
Pakuranga |
3.6 |
0.9 |
|
North Shore |
2.4 |
-4.1 |
|
Clutha-Southland |
4.5 |
-2.0 |
|
Combined Change |
3.5 |
-1.7 |
|
Labour-held |
||
|
Mangere |
2.3 |
-5.3 |
|
Dunedin South |
4.1 |
-3.2 |
|
Manurewa |
3.1 |
-6.6 |
|
Combined Change |
3.1 |
-5.0 |
Source: Electoral Commission 2014c, 2014f.
The enrolment rate is needed to estimate the real turnout rate that turnout on an enrolment basis fails to capture. In theory, enrolment to vote is compulsory in New Zealand. In practice, it is not enforced. Those eligible to vote are people 18 years and over, permanently resident in New Zealand for over a year, and not in prison after sentence since a legal change in 2010. Non-residents retain a right to enrol and register so long as they have returned to New Zealand once in the previous three years in the case of citizens, or in the year prior to the election for non-citizens. In 2014, 92.61 per cent of eligible voters in New Zealand were enrolled, compared to 93.74 per cent in 2011. This is about the same as the rate in Australia in 2013, although the enrolment rate in Australia has since increased to 96 per cent (Australian Electoral Commission 2013, 2016). In New Zealand, those less likely to be enrolled are people of Pasifika and Asian descent, and those aged 18–29 (Electoral Commission 2014c). As noted, official turnout went up in 2014, but about a third of this increase was illusory, as the enrolment rate was down by just over 1 per cent. The decline was concentrated among the young and, as it turns out, some not so young. Drawing on official data, Figure 11.1 shows a persistent gap between enrolment among those 18–29 and the rest since 1987 when data began to be collected. The picture is one of improvement up to the 2002 and 2005 elections, but in 2008 turnout among the youngest group begins to decline steeply. Among the not-so-young 30–39 group, there is a precipitous drop in 2014. The age gap in enrolment is widening.

Figure 11.1: Enrolment on an age-eligible base, 1987–2014 by age groups
Source: Electoral Commission 2014g.
Younger voters (those under 30) have usually been less likely than those above 30 both to register and to turn out (Vowles 2015a). An age gradient in turnout is one of the most consistent findings in turnout research everywhere. As voters age, they participate in greater numbers. As turnout declines among the young, a ‘footprint’ remains that sets a lower baseline (Franklin 2004). Collectively, each generation starts from a lower baseline set by the habits its members acquired when young. As of 2014, in terms of enrolment, the ageing effect promoting voting as people get older appears to have become weaker among the 30–39 group, although until the next election we cannot be sure if this was a temporary phenomenon.
The age gap in turnout could be a constant. This would mean that turnout decline from one election to the next would be the responsibility of all age groups, with each group’s turnout rate falling in tandem. Alternatively, turnout decline might be more strongly associated with the young, because their habits are less embedded and they are more sensitive to electoral contexts that might discourage voting (Franklin 2004). That is, as turnout goes down (or up), the age gap widens (or narrows), increasing or decreasing the bias towards older voters in the electorate. Figure 11.2 shows that this appears to be what has been happening in New Zealand since 1996. It is based on data taken from the official record, both from NZES respondents and non-respondents since 1996, and so suffers from no non-response bias. Focusing on people aged 25–65, Figure 11.2 reveals that in 1996, when the percentage of valid votes cast of the electoral roll was just over 78 per cent, a person aged 65 was about 16 per cent more likely to vote than someone aged 25. In 2011, when the valid vote/eligible turnout was down to 68 per cent, the 65–25 turnout gap was about 30 points. The figure shows a clear pattern of an increasing turnout gap between younger and older people as the percentage of valid votes decreases. If we were to take into account the enrolment gap displayed in Figure 11.1, the picture would be even worse (see Vowles 2015a).

Figure 11.2: Age bias and turnout in New Zealand, 1996–2014
Note: The estimates are derived from logistic regressions of age and age-squared for each of the elections covered.
Source: For details of the data used here see Vowles 2015a: 295.
Widening our analysis further and returning our attention to the 2014 election, Figure 11.3 displays turnout behaviour by gender over the age gradient. Previous research on turnout based on NZES data has found no recent gender differences (Coffé 2013a; Vowles 1993). However, recent larger-sample General Social Survey data indicates that women are slightly more likely to vote than men (Statistics New Zealand 2014d). Here, using a new ‘big data’ sample of 30,000 people from the electoral rolls in 2014, again based on official voting data alone, we can bring in both age and gender. Figure 11.3 shows that young men are less likely to vote than young women, and this difference can be identified well into the 40–50 age bracket (see Appendix, Table 11.A1). We are unable to infer the extent to which these differences are based on the life-cycle events or are generational, but they do indicate that there is good reason to be concerned about low voter turnout amongst the young, and in particular among young men.

Figure 11.3: Non-voting by gender, 2014
Source: Appendix, Table 11.A1.
Our ‘big data’ contains few other individual-level variables, so we must return to the 2014 NZES for a more fully specified model (for the details, see Appendix, Table 11.A2). This model adds ethnicity, education, relative income and the assets scale, making it possible for us to address the question of inequality. One surprise emerges: relative income is not significant (nor is household income, which measures income more accurately but has more missing data). Indeed, exploration of NZES data since 1996 indicates that household income has little or no relationship with turnout. However, this finding is not consistent with other survey evidence, again based on a larger sample (N=8,500) and a higher response rate. Statistics New Zealand’s General Social Survey has found that perceptions of income inadequacy correlated with reported not voting in 2011 and 2014, as did personal income, with people who felt they did not have enough money to meet everyday needs and with those with lower income being less likely to vote. (Statistics New Zealand 2014d).
Since 2011 and 2014, the NZES has asked questions about asset ownership, which comes through as a strong predictor: those with few assets are less likely to vote. Education and ethnicity also have significant effects. Those with a university degree are significantly more likely to vote than those holding any other post-school qualification. Compared with Europeans, those with a Māori and Asian background are significantly less likely to vote than Europeans.

Figure 11.4: Probability of not voting according to number of asset types among 25 and 65 year olds
Source: Appendix, Table 11.A2.
We expected to find a relationship between ownership of assets and age; after all, people tend to acquire more assets as they grow older. Returning to the question of young voters, interacting age with the assets scale shows that ownership of assets predominantly affects the young (Figure 11.4). Young people who begin adult life with significant assets are almost as likely to vote as people at 65. At 65, asset ownership makes little or no difference to turnout. The young who are asset poor face increasing difficulties in accumulating assets; many face repayment of loans for education, and purchasing a first home is becoming increasingly out of reach. The response of many is to fail to vote; roughly half of asset-less people around 25 years old. Again, this does not take into account the effects of non-enrolment, also concentrated among the young.
Figure 11.5 provides the estimates for ethnicity and education, consistent with well-known findings from previous New Zealand elections and elections in other countries (Vowles 2014a, 2015a). These findings mirror those of the Electoral Commission’s post-election survey that found Pākehā voters and those over 50 most likely to vote. One explanation for the low voting turnout among ethnic minorities and young people may be a lack of understanding of the process. The commission’s analysis of 1,310 respondents found that while the vast majority of respondents (93 per cent) had a good understanding of the voting process, of the 7 per cent that said they had a poor or very poor understanding of the process a significant proportion were those of Pasifika and Asian ethnicity and those aged 18–29 (Electoral Commission 2014c).

Figure 11.5: Not voting, ethnicity and education
Source: Appendix, Table 11.A2.
Our analysis of turnout among voters in the Māori electorates was presented in Chapter 10. Here we examine people who identify as Māori in both general and Māori electorates and compare them to other ethnic groups. While the confidence intervals slightly overlap, there is a clear difference between turnout among Europeans and among Māori and Asians in New Zealand. The Pasifika sub-sample is too small for any confidence in this estimate. As for education, the main difference is that those with a university degree are less likely to be found among non-voters.
We have seen above that a widening age gap does appear to be associated with lower levels of turnout. A widening income gap would confirm that turnout bias is also increasing between income groups. But as noted above, household income does not appear to have had consistent effects at any election since 1996. Our measure of household income is pre-tax and transfers, and does not take account of other differences between households, such as between those who own their homes mortgage free, those with a mortgage and those who rent. It may therefore not be a good indicator of people’s circumstances.

Figure 11.6: Home ownership, renting and roll-based turnout, 1996–2014
Source: New Zealand Election Study 1996–2014.
Since the NZES began to estimate differences in assets between households in 2011, differences with regard to this aspect of inequality have emerged, as described above. Unfortunately, the only information about assets we have before 2011 is home ownership. Figure 11.6 shows that since 1996, those renting their home have always been significantly less likely to vote than home owners. But there is no trend towards a greater gap between owners and renters associated with turnout decline. It is worth noting that home ownership has been declining in New Zealand over this period. Nonetheless, particularly since 2008 the turnout gap between renters and owners appears to have narrowed.
Another angle is to inquire what party non-voters might have chosen had they voted, although we are limited to the non-voters who responded to the NZES. Various studies in the international literature address this question. The 2014 NZES asked no question to directly collect such information. Instead, following Bernhagen and Marsh (2007) we use a process called multiple imputation to estimate the hypothetical probabilities of non-voters voting for the various parties, defining non-voters as having ‘missing values’. We then generated a series of statistical models based on various models of vote choice, and examined the results. Most models found the Labour vote share almost identical to that recorded among voters. The same applied to the Green Party. However, National did consistently score a lower hypothetical vote share among the non-voters. The parties that did slightly better among non-voters than among voters were smaller parties, particularly the Māori Party and Internet-MANA, presumably reflecting the high number of non-voters among Māori. New Zealand First and the Conservative Party also did marginally better than among actual voters (Appendix, Table 11.A3). Had non-voters actually voted, the result of the election would have been little different, although government formation might have been somewhat more complicated. Details of the modelling behind these estimates can be found in the section of the Appendix for this chapter.
Addressing the problem of voter turnout
A commitment to finding solutions to low voter turnout depends on whether or not one sees it as a ‘problem’. In 2013, there was a brief discussion of compulsory voting, in part a result of the Australian election (Curtin 2013b). The same ‘moment’ occurred again in July 2016 when Australian elections expert Antony Green visited New Zealand and advocated compulsory voting on television interview program The Nation (2016). Compulsory voting was picked up as a topic of interest at the ‘Valuing our Vote’ conference in 2014 (Farrell 2014). Chief Electoral Officer Robert Peden argued that the idea of compulsory voting had merit, but it was not a silver bullet (Radio New Zealand 2014d). Similar discussions have been had in the United Kingdom over the past decade (Birch 2009; Keaney and Rogers 2006).
Technically, Australia’s electoral law requires all voters to attend a polling place rather than actually cast a vote. Most fulfil this obligation and turnout rates average about 94 per cent; they are even higher if informal votes are also counted. Some libertarian-leaning Australian commentators have questioned the paradox of having a compulsory voting attendance system in a democracy. Others question whether it is an effective cure for non-voting (Franklin 1999; for a counter perspective see Hill 2011). However, compulsory voting does have some advantages. If enforced, it significantly enhances turnout, and means that political parties of all persuasions have an incentive to appeal to as many voters as possible, whereas in a voluntary system parties might choose to target only those voters they expect will turn out (Birch 2009; Curtin 2013b; Hill 2002).
The New Zealand Electoral Commission takes the position that ‘New Zealanders should vote because they want to vote, not because they have to’ (Radio New Zealand 2014d). Similar sentiments were apparent in a debate on the issue in 2013 in New Zealand’s weekly news magazine The Listener. The example of Australia tends to be criticised as less than desirable because of declining rates of enrolment and high rates of informal voting (Radio New Zealand 2014c). However, there is no way of knowing the reasons why people choose to spoil their ballot papers. Anecdotal evidence has suggested that some voters spoil their papers as a form of political protest (Green 2004, 2011; Orr 2015), while this kind of ‘protest’ can also take the form of non-voting in voluntary systems.

Figure 11.7: Percentage support for compulsory voting in Australia by Lower House vote, 2013
Source: Australian Election Study 2013.
The Australian Election Study has asked respondents about support for compulsory voting since 1967, and consistently since 1993. Over that time, those in favour has ranged from a low of 64 per cent in 1987 to a high of 77 per cent in 1969 and 2007. In 2013, 70 per cent of respondents supported compulsory voting (ANU 2014: 33). In 2013, support for compulsory voting sat at over 70 per cent for those who voted Liberal–National, Labour and Green. Those least likely to support compulsory voting supported independents, minor parties other than the Greens, or either voted informally or did not vote (Australian Election Study 2013).
Support for compulsory voting is lower in New Zealand than Australia. As Figure 11.8 shows, Labour voters are most supportive of compulsory voting, with more than 60 per cent of the Labour voters supporting compulsory voting. Support is lowest among the group of ‘other’ voters and National voters. Among National voters, only around 45 per cent support the idea of compulsory voting.

Figure 11.8: Percentage support for compulsory voting in New Zealand by party vote, 2014
Note: Excludes ‘don’t know’ answers, the numbers of which were very small.
Source: New Zealand Election Study 2014.
The absence of compulsory voting puts more emphasis on parties’ efforts to mobilise voters. The impact of party mobilisation efforts has become more central to the investigation of voter turnout in recent decades, with most showing that party mobilisation efforts can increase the willingness of voters to turn out and vote (for example, Karp, Banducci and Bowler 2008). In addition to greater efficiency and building a personal vote, efforts to ‘get out the vote’ are likely to pay the greatest dividends in elections that typically have low voter turnout. While the expectation is that mobilisation is more likely to be effective in systems like first past the post, proportional representation systems may also produce higher turnout because votes count wherever they are cast, and so both major and minor parties are incentivised to maximise a proportional representation vote.
Analysis of NZES data (Figure 11.9) indicates that the degree of contact experienced by respondents declined from 1993, reaching a low point in 2002, in tandem with turnout decline. Since then, the use of both personal visits and telephone contact has incrementally increased. These traditional modes of contact have been supplemented by email and social media options since 2011, but these have not replaced the work of party activists and candidates contacting voters in person.

Figure 11.9: Campaign vote mobilisation by political parties, 1993–2014
Note: Contact by email and via social network was asked for the first time in 2011. Contact via text was only included in the most recent 2014 survey.
Source: New Zealand Election Study 1993–2014.
Party commitment to mobilisation is confirmed by Labour Party campaign director Dave Talbot. Labour was committed to a grassroots campaign to mobilise those who did not turn out in 2011; as he put it, ‘To shift people who are reluctant voters you need to make personal connections. They’re harder to reach via traditional media, so you have to get to them face to face’ (Talbot, cited in Kirk 2014). By July 2014, the Labour campaign team claimed to have made five times more phone calls than it had at the same point in the previous campaign, surpassing the 200,000 mark (Kirk 2014). As we saw above, a turnout gap associated with renting or owning a home has not opened up along with turnout decline since 1996. If Labour was making more effective efforts to mobilise renters and beneficiaries, this may be one reason why. Meanwhile, on the National side, there had been much discussion of the decreased turnout in safe National seats in 2011. Prime minister John Key used the 2014 party conference to urge the party faithful to work to end complacency in safe National seats, and similar calls were made by Key and campaign director Steven Joyce throughout the campaign (Kirk 2014).
In Chapter 5, we presented evidence that the distribution of party funding and campaign expenditures between parties is far from creating a ‘level playing field’. A key resource that can offset the financial advantages of large donations are party members; perhaps they can offset the advantages of ‘big money’ (Edwards 2008). There were claims that Labour party membership significantly increased as a result of the leadership campaign that elected David Cunliffe late in 2013. Party members have become able to vote in the Labour leadership elections since 2012, giving people an incentive to join. If it had more members to draw on, Labour would therefore be in a better position to beat National on the ground. Sophisticated ‘micro-targeting’ of voters might also have given Labour a slight edge in 2014, but National was not far behind (Salmond 2015). The National Party also claims a significant membership and on-the-ground activity. As no membership data is available for either party, we cannot compare. The most important test is active membership—those who are prepared to canvass or make telephone calls on behalf of a party. We can break down the personal and telephone contacts by party during the 2014 campaign as reported by NZES respondents. Figure 11.10 shows that Labour and National probably differed very little in their abilities to get their troops out on the ground or on the telephone. A larger and more active membership would have helped to offset the party-funding imbalance between the two main parties. However, in 2014 there was no apparent activist advantage for Labour compared with National. In terms of campaign resources, there is thus no doubt that 2014 was an unequal election. Figure 11.10 also displays Green and New Zealand First contacts. The percentage of NZES respondents who were contacted by either of the minor parties is, as expected, significantly lower than for the two main parties.

Figure 11.10: Personal visits and telephone contacts by party, 2014 election campaign
Source: New Zealand Election Study 2014.
As has been the case in Australia, third parties were also involved in campaigns to ‘Get Out and Vote’ in New Zealand in 2014. Coordinated by the New Zealand Council of Trade Unions, several unions combined to donate $220,000 for the campaign ‘Get Out and Vote’. More than 5,000 volunteers and several paid staff were located at call centres across the country, working through a database of 100,000 union members (Armstrong 2014d). Campaign manager Conor Twyford said there was concern about the implications of a low voter turnout ‘for democracy in general’ but also for potential risks to people’s industrial, social, economic and political rights.
Generation Zero and RockEnrol were particularly focused on getting young people engaged with the process of voting, without promoting any particular party. The former’s central purpose was to lobby political parties to adopt policies to drastically cut carbon pollution. In July 2014, the group released their report titled ‘The Big Ask’, calling on political parties to set up an independent climate change commission and introduce carbon budgets (Generation Zero 2014). RockEnrol, derived from a similar organisational model in the United States, organised a series of events in the months leading up to the election including concerts and house parties featuring local talent and the support of Lorde. The concerts were free but only for those who had enrolled to vote, with the organisers emphasising the need to mobilise young people because the low turnout amongst that age cohort ‘shows a real inequality and disconnect with how youth are being represented in Parliament’ (McAllen 2014). Both organisations made significant use of new media to promote awareness and mobilise voters. However, social media was not a panacea. Laura O’Connell-Rapira, one of RockEnrol’s founders, put it that part of the problem was the lack of political education in New Zealand schools: ‘Unless you actively seek out what MMP [Mixed Member Proportional] means, how the government works and what your vote does you won’t see the connection with who controls your driving age, or how much you can drink’ (McAllen 2014). Analysis of the 2014 NZES indicates that texts, emails and social media contacts had no significant effects on turnout in 2014, either directly or as mediated by friends or other personal contacts forwarding relevant links to political content.
Automatic registration is a reform increasingly applied elsewhere but not yet given serious consideration in New Zealand. People could be automatically placed on the rolls where government data clearly indicates where they are living. Nearly 29,000 special votes were disallowed at the 2014 election, in most cases because those who cast them did not have their names on the electoral roll. If automatically registered, as many could have been, those people could have had their party vote counted. The feasibility of automatic registration in New Zealand is often questioned because of the need for people of Māori descent to opt for the general or Māori rolls. In order to cast an electorate vote, those enrolled automatically would still need to be contacted and respond in order to declare whether or not they should go on to the general or Māori rolls. But this is not a barrier that should prevent them from being registered to cast a party vote.
Modes of political participation
As is widely acknowledged in political science, political participation is not limited to the ballot box (Hayward 2006; Milbrath 1965; Verba, Schlozman and Brady 1995; Vromen et al. 2016). No political scientist would claim that voting is the only significant form of political participation. Alternative pathways may particularly apply to young people, many of whom define politics in ways that go well beyond party politics and that may exclude or minimise the value of voting, focusing more on discussion and voluntary civic engagement. Young people may seek out other means, particularly online, in the form of old strategies such as petitions and protests, and newer ones via Facebook, Twitter and Instagram amongst others (Anduiza, Cantijoch and Gallego 2009; Chapman and Coffé 2016; Norris 2001; Ross and Bürger 2014).
Despite turnout decline, voting remains the act of participation the largest number of people are likely to engage in. Those who are not voting may find other forms they consider equally valid that they believe can substitute for casting a ballot. Yet it is equally likely that those engaging in other forms of participation will also tend to vote, given that voting may require less energy and commitment than going on a protest march. The 2014 NZES included questions about various acts of participation. The results of a factor analysis displayed in Figure 11.11 show that activities tend to cluster in two dimensions: direct and indirect. All the forms of participation appear on both dimensions but, with the exception of protests, they are most strongly and clearly related to one or the other.
Direct acts include one-on-one contact with actors. Figure 11.12 shows that ‘direct’ participation acts are very rare; more than 75 per cent of the sample did not engage in any such activities over the past five years. Most people engaging in ‘direct’ acts also vote. Indirect acts are more frequent, although again more people vote than engage in any of these indirect activities. Voting is also an ‘indirect’ act, and tends to be associated with the other acts of indirect participation. Most people who engage in other forms of indirect participation also vote. About 17 per cent of people who engage in one or more alternative acts of indirect participation did not vote in 2014. But the more acts of such alternative indirect participation engaged in, the higher the likelihood of voting.

Figure 11.11: Modes of non-electoral political participation
Note: The question was: ‘There are various forms of political action that people take to express their views about something the government should or should not do. Have you done any of the following, or would you consider doing them?’ Response categories were: have done within the last five years, have done more than five years ago, have not done, might consider, have not done, would never. Forms of action: Signed a petition, made a select committee submission, taken part in a consultation with central or local government, written to a newspaper, gone on a protest march, demonstration, or hikoi, phoned a talkback radio show, not bought a product or service for political or ethical reasons, bought something to support its making or sale for political or ethical reasons, used Facebook, Twitter or other social media to promote an issue, been in contact with a politician or government official in person, writing or another way.
Source: New Zealand Election Study 2014.
The role of the internet in relation to young people’s political knowledge and participation has attracted considerable scholarly and public attention (Bakker and De Vreese 2011). Pew Research on millennials in the United States reveals that the younger generation of potential voters are more likely to rely on Facebook for their political news rather than local television news, and are less likely to be familiar with more traditional sources of news (Mitchell et al. 2016). However, Facebook links often send users to traditional sources in print or video format. Barack Obama’s campaign team’s use of Facebook, Twitter and YouTube in the 2008 presidential election and the apparent increase in youth turnout went on to spark much discussion (Bakker and de Vreese 2011; Chen 2010, 2015; Curtin 2010).

Figure 11.12: Acts of direct and indirect participation over the last five years
Source: New Zealand Election Study 2014.
We asked respondents about their internet use in the 2014 election campaign, although questions focused on blogs and YouTube rather than Facebook and Twitter. Only 6 per cent of respondents visited YouTube (14 per cent of those aged 18–30 did so) while 6 per cent accessed a political blog (with 12 per cent of 18–30-year-olds accessing information in this way). Young people thus tended to check blogs and YouTube more frequently for election information than the average.
When looking at internet usage more generally, Figure 11.13 shows that those respondents aged 18–30 are more likely than those over 65 to have internet access and appear significantly more likely to use it to gather information on the election. However, internet use is not limited to those labelled ‘millennials’. It is apparent that those aged 31–45 also access the internet for political information, suggesting that parties would get good value from a multimedia strategy that reaches all voters. Although the numbers are relatively small, they reflect the Electoral Commission’s findings, which showed those aged 18–29 were more likely to notice election advertising via social media, websites, signs and bus shelters (Electoral Commission 2014e). Those aged 30–49 were more likely to notice advertising on television, while those aged 50 years plus were likely to notice advertising via newspapers and pamphlets or fliers. Analysis of social media participation in the 2011 election in New Zealand indicated a tendency for top-down use by political parties (Murchison 2015; Ross and Bürger 2014). Young voters were more likely than those over 35 to use social media to engage in political activities and to source their political news (Diesing, cited in Murchison 2015: 527).

Figure 11.13: Percentage of respondents using the internet for election information, by age group
Source: New Zealand Election Study 2014.
In 2014, all the major and substantial small parties had Facebook pages. With 49,300 likes, the Greens were significantly more popular than the rest. The Internet Party was in second place with 19,100 likes. However, liking numbers do not always lead to success. The Pākehā Party was a Facebook phenomenon that received 42,000 likes within a month of going live in July 2013. Much of the discussion that ensued focused on whether the party was racist or not (Edwards 2014e; Manhire 2013), and whether ‘liking’ a page constituted a political activity. The party remains unregistered but still maintains a Facebook presence.
Media analysis from July 2014 indicates that in terms of engagement, Labour (16,000 fans) and the Greens were most popular among those aged 25–34 years of age, while the National Party appealed to a broader age group, those between 18 and 34 (14,000 fans). ACT NZ and the Internet Party both had a younger following. ACT’s was significantly smaller at 2,000 fans, with the largest chunk of its engaged audience falling in the 18–24-year-old category, whereas the Māori Party appealed to those aged between 25 and 44. The MANA Party appeared to have the oldest Facebook audience among Kiwi political parties, appealing for the most part to 45–54 year olds (Venuto 2014).
The 2014 campaign was different to previous elections on the social media front. Social media was proclaimed to be the ‘new campaign trail’ (Gulliver 2014). Twitter was said to have made ‘everyone a political pundit’. The New Zealand Herald published the top 100 tweeters to follow, including journalists, bloggers, politicians, comedians and a range of semi-anonymous others (Edwards 2014f). The 2014 election was also labelled the ‘selfie’ election (Murchison 2015). The Electoral Commission published guidelines on the appropriate use of the selfie during voting (Electoral Commission 2014e). Prime minister Key proved himself to be a popular selfie subject (Gulliver 2014). It was the Greens that were judged to be the most social media savvy party in the campaign (Manning 2014; Venuto 2014).
Given that social media appears to be pervasive in the lives of young people, many go on to make a case that voting should be made possible on the internet. We asked respondents about their preference for online voting versus the current polling booth option, and their confidence in the security of online voting. Figure 11.14 shows how the different age groups responded. Younger voters were more open to the use of online voting than the old. Around half of the respondents under 45 were sufficiently comfortable with the security and privacy of online voting. There is considerably less support for the online option amongst older respondents: only 20 per cent would opt for online voting if given the option. In 2013, the government established an independent working party to consider the feasibility of online voting in local elections, with a possible trial in 2016. Despite the working party recommending a trial, the government decided against this option, citing security issues for its decision (Radio New Zealand 2016). Online voting in New Zealand is therefore ‘on hold’. This caution may be justified.
When asked if online voting would have changed one’s likelihood of voting, 69 per cent of NZES respondents said it would have made no difference, 14 per cent that they would have been more likely to vote, offset by 10 per cent who said online voting would make them less likely to do so. The rest did not know. This suggests that online voting does not necessarily lead to significantly higher turnout, even among the young. Postal voting for New Zealand local elections was introduced to make voting easier and more convenient, but after a brief upswing, turnout continued downward. Some suggest that online voting may enhance rather than reduce turnout bias towards those with more resources. Were online voting to be adopted and opportunities to vote in person reduced, as has been the case with postal voting in local elections, such biases could be further exacerbated.
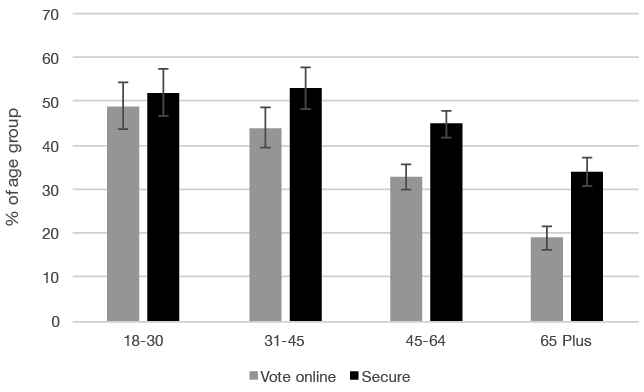
Figure 11.14: Interest in online voting by age groups (in percentages)
Note: The questions were: ‘If you had a choice between voting on the internet or voting at a polling place, which of the two would you prefer?’; and ‘If you were able to vote online, how confident would you be about the security and privacy of doing so?’ For the second question, the chart indicates the percentage of those very confident or fairly confident in the security of online voting.
Source: New Zealand Election Study 2014.
Norway’s experience of internet voting in local elections in 2011 found no turnout increase but also no biasing effects (Segaard, Baldersheim and Saglie 2013). Two sources report that Estonian experience has led to a small increase in turnout and no biasing effects (Madise and Vinkel 2014). Fears of biases have receded as uptake has increased (Vassil et al. 2016). But there is contrary evidence that online voters are ‘more urban, richer, and better-educated than conventional voters and non-voters’ (Lust 2015). Methodologically, when using observational data, the effects of internet voting are difficult to establish in a robust fashion due to the self-selection of those who choose to use it or not; experimental evidence comparing randomly assigned treatment and non-treatment effects would be preferable, but that raises questions of external validity. Of most importance, there is a broader consensus that the security of internet voting is poor and, that by the very nature of the technology, there is no easy fix (for example, Springall et al. 2014). At best, internet voting could enhance turnout slightly and perhaps make existing biases no worse, but its promise is modest at best.
What else can be done to reduce ‘inequalities’ in turnout? The Electoral Commission’s survey findings reveal that the second biggest reason given for why people did not vote was a lack of interest: 27 per cent of non-voters said that they did not vote because of a lack of interest, up from 21 per cent in 2011 (Electoral Commission 2014c). The 2014 NZES makes it possible to classify non-voters into those who chose not to vote (26 per cent), those who didn’t get around to it (28 per cent) and those who indicated in their survey response that they voted, but in fact did not do so according to the official record (39 per cent).
Both online and mainstream media pointed to young people’s political apathy (Forschler 2014; M. Robinson 2014; Whelan and Hunt 2014). Certainly, the 2014 NZES finds significant relationships between age and political interest and political knowledge: the young have less of both than the old. But as political participation is learned behaviour, one would not expect anything else. Internationally, young people’s lower rates of voting participation have often been attributed to declining interest in politics over time. Qualitative research conducted in Britain indicates that it is not that young people are disinterested in politics as such, but rather they feel ‘disillusioned with, and alienated from formal politics’ (O’Toole et al. 2005: 59; see also Dermody, Hanmer-Lloyd and Scullion 2010; Henn, Weinstein and Wring 2002). Other studies have also refuted the accusations that young people are politically apathetic (Loader 2007). Yet doubts remain about the kinds of alternative politics young people may identify as relevant, particularly where actions involved are more ‘expressive’ than ‘instrumental’. Talk among groups of like-minded people does not necessarily translate into behaviour that may affect the actions of governments.
The 2014 NZES reveals that young people were unlikely to attend political meetings or rallies during the campaign, but respondents from other age groups were equally unlikely to do so. Similarly, as shown in Figure 11.15, young people said they discussed politics as much as older people. While the number of respondents under 30 was comparatively small, compared with the 46 plus and 65 plus categories, we see that a considerable percentage of young people talked about politics during the election campaign.
Why does this engagement in political discussions amongst those under 30 not translate into a vote on election day? As noted above, talk is not the same as action. Young voters are more likely to feel alienated or ambivalent about the value of voting than those who are older. Drawing on various NZES questions, we find that in New Zealand in 2014 young people were significantly less likely to believe that their votes would ‘count’, a little less likely to believe that voting makes a difference and that who is in power can make a difference, and a little more likely to believe that globalisation reduces government’s ‘room for manoeuvre’. Qualitative analysis could no doubt provide further evidence and insight (for example, Vromen et al. 2016). Lower turnout might also relate to more rational decisions about the lack of electoral competitiveness in 2014 or a sense that few of the parties had much to offer younger voters.

Figure 11.15: Discussing politics by age group (in percentages)
Note: The percentage referring to discussing politics (‘Yes’) combines those who said they discussed politics either occasionally or frequently.
Source: New Zealand Election Study 2014.
Conclusion
In 1971, National MP George Gair wrote in the Nelson Evening Mail that ‘the chances of democracy failing … by a break in the atomic stalemate … is far less than the chances of us falling victim to the consequence of a suffocating apathy … Democracy belongs to the people, or it is not a democracy’ (cited in Curtin 2013b). Forty years on, in 2011, National prime minister John Key remarked that ‘if you don’t vote you can’t complain’ and noted ‘our [National] voters largely turned up’.
By 2014, Key and his party strategists were not so confident about their core voter turnout. Both major parties were keen to woo more voters to the ballot box. However, if Labour had imagined they could persuade anything close to a majority of the missing million to vote for them, they would have been sorely disappointed. As has been suggested both in the academic scholarship and in our chapter on the Māori electorates, the relationship between a concern about rising inequality and voter turnout is not straightforward. Those who own a house are more likely to vote than those who rent, but the turnout gap between these two groups has not grown in tandem with turnout decline. The proportion of renters to owners has been changing in favour of the former, making the differences more significant. Low asset ownership among the young is associated with low turnout in 2014, and the age gap is increasing as turnout declines. Because there is limited knowledge about those who are not enrolled to vote, we cannot confidently refute the hypothesis of progressive disempowerment of those on low incomes. But neither can we confirm it.
Previous Next



