


 menu
The Doubters' Dilemma
2
Accounting for the Missing Students: Calculating retention rates in Language & Culture programs
2.1. The importance of validity when calculating attrition and retention rates
Retention rates are only useful as tools of comparison and discussion when they are realistic, replicable and consistent. This chapter is designed to give readers a deeper understanding of the concept of ‘retention rates’ and the ways in which they have typically been calculated. Using data from the case study institution (ANU), we consider in detail the processes and limitations of calculating retention rates, and the diverse issues that are relevant in the calculation of retention (i.e. the proportion of students who remain in a course of study) versus the calculation of attrition (i.e. the proportion of students who leave a course of study). Attrition can occur naturally (i.e. the student completes the program of study) or by choice (i.e. the student continues to study at the same university, but no longer chooses to study in that discipline area; or the student leaves the university). We focus particularly on the shortcomings of current methods of calculation, and describe how these led us to develop some new concepts and methods of calculating retention, the latter being presented in sufficient detail to allow full replication of our approach in future research.
The main difficulty with calculating retention rates is that one of the key components of measuring retention, the measure of attrition, is very difficult to determine for specific disciplines. The Australian Government department responsible for higher education calculates attrition for a given university essentially on the basis of the formula:
Retention + Attrition + Completion = 100%
(Lukic et al., 2004; see Chapter 1).
Attrition, consequently, is defined as the number of non-completing students who were enrolled in a particular university in a given year, but not enrolled in the following year, that is:
Attrition = 100% – Completion – Retention.
A similar formula could in theory be used to calculate attrition for disciplines or programs (Gabb et al., 2006, 3). However, whereas it is easy to identify enrolment at a university or in a specific program, enrolment in majors or disciplines (L&C or others) is difficult at many universities, including ANU, because there is no requirement for students to ‘declare a major’.
2.2. Calculating retention rates at ANU: The complexity of language enrolments
Our first attempt at obtaining an overall ANU-wide retention rate from 2008 to 2009 was to use the centrally provided enrolment lists (see Chapter 3) to calculate the proportion of students who were enrolled in an L&C course in 2008, but were not enrolled in such a course in 2009. Dividing the latter by the former yielded a 54 per cent retention rate.
However, while this method gives a simple estimation of retention from 2008 to 2009, it does not fully address attrition. First, the 46 per cent of students enrolled in 2008 who were not enrolled in 2009 actually comprise a combination of three subgroups:
- Those students who had discontinued L&C studies but had continued to study at ANU (i.e. were enrolled in studies in non-L&C programs);
- Those who had completely discontinued studying at ANU (i.e. were no longer enrolled in any ANU courses, but had not completed their degree program); and
- Those who were no longer enrolled in any ANU courses because they had completed their degree program.
Disappointingly, it was not possible to access the information needed to assess the component of overall attrition that related specifically to groups 2 and 3. Moreover, the simple calculation described above excluded students who were not enrolled in an L&C course in 2008, but who did commence L&C study in 2009 at a level other than Beginner (an issue to which we will return shortly). To ensure reliability and validity in the calculations, therefore, a more comprehensive method of determining retention and estimating attrition was needed.
To reveal the complexity of language enrolments at ANU more fully, the analysis focused on all enrolment data for 2009 across the whole university, focusing on the proportion of ANU students who were enrolled in L&C courses, and distinguishing whether they were enrolled in Level 1 (Beginner) or higher-level courses (Table 2.I). These calculations showed that, in 2009, L&C courses accounted for 6.4 per cent of the total ANU student load, and 6.6 per cent of the Level 1 (Beginner courses) student load. This relatively simple approach allows for a comparison of ANU and other universities in regards to the proportion of L&C enrolments. ANU was at the lower end of the universities surveyed by LASP1, where the proportion varied from 5 per cent to 12 per cent, with about half the universities having less than 10 per cent of their students studying languages (Nettelbeck et al., 2007, 11). The LASP1 study also found that, among the universities surveyed, more than 50 per cent of L&C enrolments were in Level 1/Beginner courses (Nettelbeck et al., 2007, 11). By contrast, students who were enrolled in Level 1/Beginner language courses at ANU in 2009 constituted some 39 per cent of the student load in L&C courses.
Table 2.I. Language & Culture enrolments in 2009 discriminated by level and commencing/continuing status
|
Level |
Commencing ANU degree |
Continuing ANU degree |
Total |
Per cent Commencing |
Per cent Continuing |
|
Beginner (Level 1) Language & Culture courses |
119.9 |
63.9 |
183.8 |
65.2% |
34.8% |
|
Non-Beginner (Level 2 and 3) Language & Culture courses |
89.5 |
261.3 |
350.8 |
25.5% |
74.5% |
|
Total Language & Culture Load |
209.4 |
325.2 |
534.6 |
39.2% |
60.8% |
|
Level 1 ANU Load |
2,118.6 |
687.4 |
2,806.0 |
75.5% |
24.5% |
|
Levels 2 and 3 ANU Load |
574.4 |
4,962.0 |
5,536.4 |
10.4% |
89.6% |
|
Total ANU Load |
2,693.0 |
5,649.4 |
8,342.4 |
32.3% |
67.7% |
|
Per cent of Language & Culture in Level 1 Load |
5.7% |
9.3% |
6.6% |
All enrolment figures are given in EFTSLs (Equivalent Full-Time Student Load). Usually 1 EFTSL = 8 students enrolled in a single subject |
|
|
Per cent of Language & Culture in Level 2 and 3 Load |
15.6% |
5.3% |
6.3% |
||
|
Percentage of Language & Culture courses at ANU |
7.8% |
5.8% |
6.4% |
||
Source: Derived from 2009 enrolment data provided by the ANU Statistical Unit.
Given the complexity of the data (Table 2.I), and the lack of data about students’ majors in the university statistics, it seemed appropriate to adapt the principles of the ‘Student Progress Ratio’, a method of aggregating student load widely used in higher education (under various names) to study student progression (Gabb et al., 2006, 5). This requires calculation of a ratio based on the student load (measured in Equivalent Full-Time Student Load, or EFTSL) at a given level of study divided by the student load enrolled in the same discipline at a previous level. In seeking a suitable methodology with which to calculate language retention rates, we began by comparing the enrolment figures in two different types of language majors over three successive years (2008 to 2010) in the normal major progression of core language courses (Beginner, Intermediate and Advanced) with those of a Social Science major. We chose the ‘Language 1’ major to be representative of languages which are taught widely in high schools, whereas the ‘Language 2’ major was representative of languages not in this category. To make the comparison easier, the student load was converted into a percentage value, that is, the 2008 enrolments were considered equivalent to 100 per cent for all three majors (Figure 2.1.a). The apparent progression through each major was then compared to the proportion of students who started studying at ANU in those three consecutive years (Figures 2.1.b to 2.1.d). The differences in the figures illustrate the impact of two phenomena, namely ‘Late Starters’ and ‘Advanced Starters’.
2.2.1. Late Starters
Late Starters were identified by Nettelbeck et al. (2007, 15) as those students who start studying a language in their second or subsequent years of university study: they are thus non-first year students in ‘first year’ (Beginner level) L&C courses. Students may choose this path for various reasons, including a change in their chosen major; an L&C course being taken as an elective; a change in degree programs to one that requires compulsory or advised language study; or personal interest. This issue is not trivial, as data analysis shows the notable magnitude of the Late Starters phenomenon. Figures 2.1.b to 2.1.d show the students from 2008–2010 classified according to their status as commencing students (that is, students who commenced a degree in that year) and continuing students (that is, students who were already enrolled in a degree before that year). For all three majors (Social Science, Language 1 and Language 2), more than 25 per cent of the students are Late Starters, that is, students who are attending introductory courses in these disciplines in their second, third or even fourth year at university (see the first column of the three graphics in Figures 2.1.b to 2.1.d, that is, the column that corresponds to Level 1/Introductory/Beginner courses in 2008).
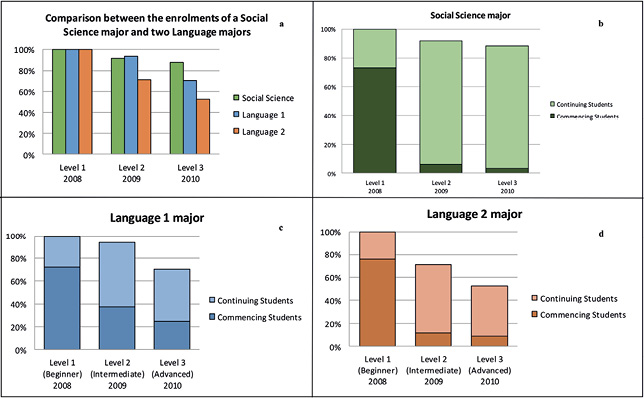
Figure 2.1. Comparison in the enrolment patterns of a Social Science major and two language majors
Source: Derived from 2008–2010 enrolment data provided by the ANU Statistical Unit.
Any attempt to measure the retention/attrition rate of students with regard to the completion of L&C majors is thus significantly confounded by the presence of Late Starters (because students who start languages in their second or third year of a degree program rarely spend additional time at university simply to complete a full L&C major sequence, which lasts at least three years). While the 2008–2010 data shows that this is not a phenomenon restricted to languages (Late Starters were also involved in the Social Science major; Figure 2.1.b), it is more prominent in L&C courses than in non-L&C ANU courses. For example, 32.6 per cent of students in Level 1/Beginner L&C courses were Late Starters, compared with 21.6 per cent in other ANU Level 1 courses (Table 2.II).
Table 2.II. Percentage of Late Starters in L&C and other ANU courses 2008–2010
|
Courses |
2008 |
2009 |
2010 |
Average 2008–2010 |
|
L&C courses |
31.3% |
34.8% |
32.3% |
32.6% |
|
Other courses |
18.1% |
24.0% |
22.6% |
21.6% |
|
All ANU |
19.0% |
24.7% |
23.2% |
22.3% |
Source: Derived from 2008–2010 enrolment data provided by the ANU Statistical Unit.
2.2.2. Advanced Starters
The LASP studies (Nettelbeck et al., 2007, 2009) were restricted to Level 1/Beginner students. As a result, these studies did not discover a second phenomenon that can confound the calculation of retention rates in L&C programs, namely the presence of ‘Advanced Starters’. These are students who enter university with a previous knowledge of the language they are choosing to study, and, following a placement test, are placed in Level 2 (Intermediate) or Level 3 (Advanced) courses. In other words, these are students who start a language major sequence at a relatively advanced level compared to Beginner students.
The relative proportion of Advanced Starters in the majors compared in Figure 2.1 shows that this is a phenomenon that is more prominent in languages than in the Social Science major. In Figure 2.1, the second and third columns (corresponding to Level 2 and Level 3 courses) show more commencing students in 2009 and 2010 in the L&C majors than in the Social Science major. Whereas one might expect that Language 1, which is taught widely in schools, might have many students arriving at university with sufficient knowledge to start studying the language at a post-Beginner level, it is notable that even Language 2—much less commonly taught in schools—also has many Advanced Starters. By comparison, the Social Science major shows fewer Advanced Starters, which reflects the relatively low number of students who could effectively start Level 2 or Level 3 Social Science courses without having completed Level 1 prerequisites. (For example, these could be students transferring with completed Level 1 courses from another university.) Overall, 24.1 per cent of all students enrolled in ANU L&C courses in 2008–2010 were Advanced Starters, compared to 8.8 per cent in all other courses ANU-wide (Table 2.III): in other words, there are almost three times as many Advanced Starters in L&C courses than in other courses.
Table 2.III. Percentage of Advanced Starters in L&C and other ANU courses 2008–2010
|
Courses |
2008 |
2009 |
2010 |
Average 2008–2010 |
|
L&C courses |
20.6% |
25.5% |
26.0% |
24.1% |
|
Other courses |
8.5% |
9.4% |
8.6% |
8.8% |
|
All ANU |
9.3% |
10.4% |
9.7% |
9.8% |
Source: Derived from 2008–2010 enrolment data provided by the ANU Statistical Unit.
2.2.3. Shortcomings in a simplistic view of retention
The two phenomena described above can significantly distort retention rates as the apparent progression of students from Level 1 to Level 3 courses is composed of a mix of students who began their degrees in different years. Figure 2.2 shows the contrast between considering the apparent student progression without taking into consideration the phenomena described above (Figure 2.2.a), and how this progression can be conceptualised when the year in which students started their degree is considered (Figure 2.2.b and c). The figure shows this for a language that is widely taught in schools (i.e. Language 1 in Figure 2.1). Specifically:
- Figure 2.2.a (which corresponds to Figure 2.1.c) shows the apparent progression of students across the three core language courses from 2008 to 2010.
- Figure 2.2.b shows that a majority of Level 3 students in 2010 for this language (in fact 69 per cent of students enrolled at Level 3) are Advanced Starters, that is, students who began studying the language in 2009 or 2010.
- Figure 2.2.c shows that the apparent retention rates are significantly reduced when only the 2008 cohort of students is considered, i.e. when both Late Starters and Advanced Starters from other student cohorts have been excluded from the calculation.
As the distortions illustrated in Figure 2.2 are, to a considerable extent, caused by the phenomenon of Advanced Starters, they come to bear particularly strongly in majors in languages that are taught widely in schools, such as the Language 1 major illustrated in Figure 2.2. We therefore contrast in Figure 2.3.a the retention rates for Language 1 with those of Language 2, a major in a language not widely taught in schools (Language 2 in Figure 2.1). In this figure, where both Advanced Starters and Late Starters are included, the Language 1 retention rate appears clearly higher than the retention rate of Language 2.
Figure 2.3.b shows the apparent progression of students across the three core language courses from 2008 to 2010 when only the 2008 cohort of students is considered. In this case, the Language 2 retention rate is higher than the retention rate of Language 1. This is because only the 2008 cohort is considered, and both Late Starters and Advanced Starters from other cohorts have been excluded from the calculation.
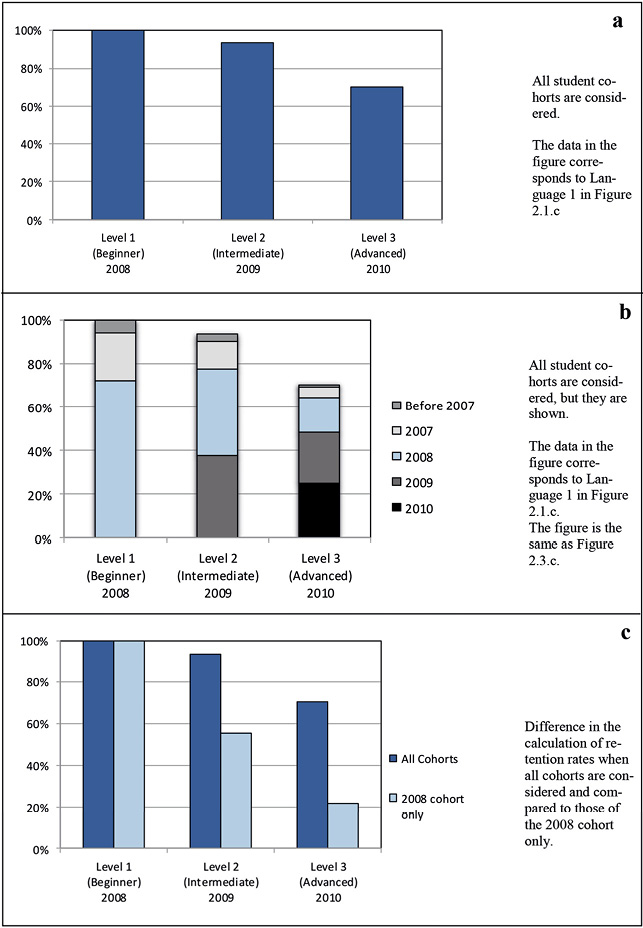
Figure 2.2. Apparent progression rates from Level 1 in 2008 to Level 3 in 2010
Source: Derived from 2008–2010 enrolment data provided by the ANU Statistical Unit.
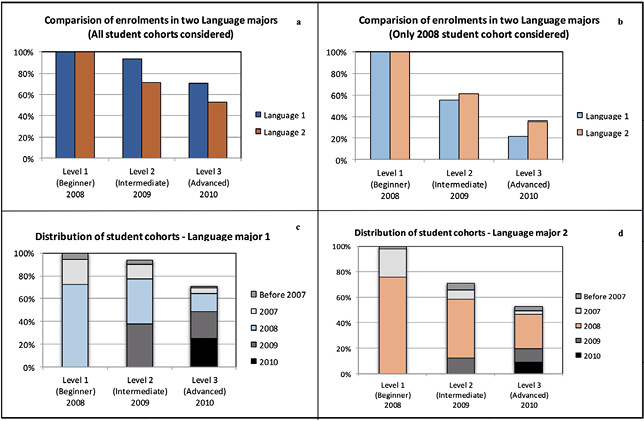
Figure 2.3. Comparison in the enrolment patterns of two Language majors when all students are considered and only the 2008 cohort of students is considered
Source: Derived from 2008–2010 enrolment data provided by the ANU Statistical Unit.
Figures 2.3.c and 2.3.d help us to understand the apparent contradiction when contrasting the two ways of exploring retention rates. Figure 2.3.c (which is identical to Figure 2.2.b) shows that a significant proportion of Level 3 students in 2010 for Language 1 are Advanced Starters, that is, students who began studying the language in 2010 (in fact 35 per cent of students enrolled at Level 3). In the case of Language 2 (Figure 2.3.d) Advanced Starters who began studying in 2010 at Level 3 are not so numerous proportionally (they account for only 17 per cent of Level 3 students).
We hope that by now the reader can see the considerable differences in calculated retention rates that occur depending on whether Late and/or Advanced Starters from different cohorts are considered or not. Indeed, we have demonstrated that it can be quite misleading to adopt the traditional way of looking at retention in majors, that is, to consider simply the number of students enrolled in one year compared with the number enrolled in the prerequisite course in a previous year. In other words, in L&C programs, unlike most other disciplines, the level at which students are enrolled does not necessarily correspond to the same year of their degree. Students in Level 1/Beginner courses thus cannot be assumed to be commencing (first year) students, because some commencing students enrol directly in Level 2 and 3 courses. Similarly, continuing students (i.e. students who have been enrolled at the university in previous years) will not always be those enrolled in Level 2 and Level 3 L&C courses, but may be also those enrolled in Beginner/Level 1 courses. This deeper analysis leads inexorably to the conclusion that a more accurate way of calculating retention rates is essential if they are to be trustworthy tools for reporting and planning.
2.3. The need for new ways of calculating language retention rates
To approximate the calculations that Nettelbeck et al. (2007, 12–13) carried out with respect to Beginner students, enrolment data for all university courses was obtained from the ANU Statistical Unit. The courses were classified according to their level (the year in the degree at which students would normally take them), and the enrolment data (measured in EFTSL) were converted for analysis by the statistical package SPSS®, taking into consideration several additional variables as well as level, such as cohort (year and semester of enrolment), part-time/full-time status, gender, domestic/international, etc. These data were used to calculate a Semester Level Retention Rate, restricting the calculation to the normal progression of Beginner/Level 1 students, Level 2 students and Level 3 students only for those students who began their degree in 2008 as Beginners. This approach filters out the distortions, discussed in the previous section, when multiple cohorts are considered simultaneously. As retention rates are then calculated semester by semester, this approach thus draws a more refined picture than the more commonly used Year Level Retention Rates, where the data of the two semesters are combined.
Included in these calculations were all L&C courses, not just the sequence of core language courses, as most languages have additional courses that parallel the core courses but focus on literature, film linguistics, etc., taught in the target language. The retention rate for each semester was thus calculated by dividing the total number of students enrolled in this semester by the number of Level 1 students enrolled in Semester 1 at the Beginner level in 2008 (Table 2.IV). Both the actual EFTSL count and the percentages that define the Semester Level Retention Rate have been highlighted in the table. Subsequent tables in this chapter, where this rate or the source figures to calculate the Semester Level Retention Rate are used, have been highlighted with the same colour.
To account for the kinds of complexities found in student enrolments, and to extend the interpretive value of the Semester Level Retention Rate, we developed the concept of a Global Retention Rate, which allowed for the inclusion of both Late Starters within the 2008 cohort (i.e. those enrolling at Beginner level after their first year at university; in our case in 2009 and 2010) and Advanced Starters (i.e. those enrolling above Beginner level in their first year at university, in 2008 or later years).
To calculate the Global Retention Rate, we thus i) restricted the cohort of students to be analysed to those who enrolled at ANU in 2008; and ii) calculated the retention rate as the rate of enrolment in L&C studies in the sequence of six consecutive semesters from Semester 1, 2008, to Semester 2, 2010.
Table 2.IV. Semester Level Retention Rate—All ANU languages. Only students who enrolled in 2008 are considered. Enrolment measured in EFTSL
|
Semester and Year |
Enrolment |
Semester Level Retention Rate |
|
Level 1 Sem 1 2008 |
70.0 |
100.0% |
|
Level 1 Sem 2 2008 |
60.1 |
85.9% |
|
Level 2 Sem 1 2009 |
40.8 |
58.3% |
|
Level 2 Sem 2 2009 |
35.2 |
50.3% |
|
Level 3 Sem 1 2010 |
23.5 |
33.6% |
|
Level 3 Sem 2 2010 |
25.7 |
36.7% |
Source: Derived from 2008–2010 enrolment data provided by the ANU Statistical Unit.
Table 2.V. Global Retention Rate and Semester Level Retention Rate—All ANU languages. Only students who enrolled in 2008 are considered. Enrolment measured in EFTSL
|
Semester |
Level 1 |
Level 2 |
Level 3 |
Total All Levels |
Global Retention Rate |
|
Sem 1 2008 |
70.0 |
18.1 |
7.6 |
95.7 |
100.0% |
|
Sem 2 2008 |
60.1 |
18.4 |
9.8 |
88.3 |
92.3% |
|
Sem 1 2009 |
22.8 |
40.8 |
16.8 |
80.4 |
84.0% |
|
Sem 2 2009 |
13.3 |
35.2 |
17.4 |
65.9 |
68.9% |
|
Sem 1 2010 |
7.3 |
20.3 |
23.5 |
51.1 |
53.4% |
|
Sem 2 2010 |
4.1 |
14.4 |
25.7 |
44.2 |
46.2% |
|
Total All Semesters |
177.6 |
147.2 |
100.8 |
425.6 |
|
Source: Derived from 2008–2010 enrolment data provided by the ANU Statistical Unit.
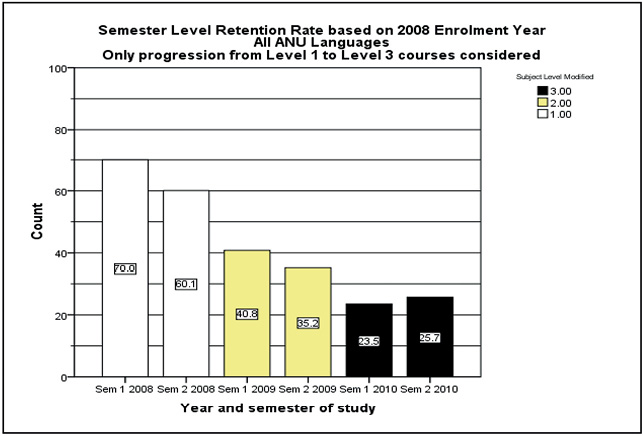
Figure 2.4. Graphical representation of the figures used to calculate the Semester Level Retention Rate. The rate is calculated using only the levels of Language & Culture study shown.
Source: Derived from 2008–2010 enrolment data provided by the ANU Statistical Unit.
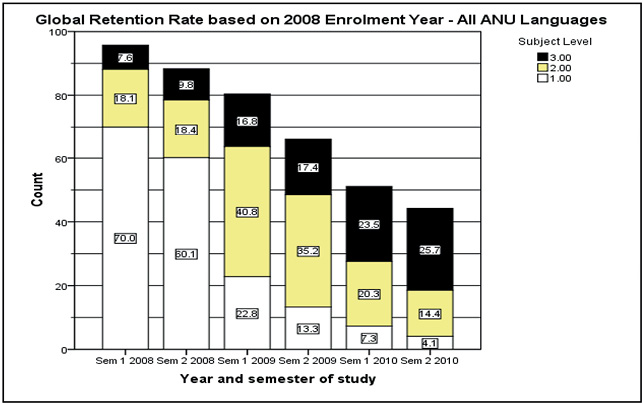
Figure 2.5. Graphical representation of the figures used to calculate the Global Retention Rate. The rate is calculated using all three levels of Language & Culture study shown in all semesters.
Source: Derived from 2008–2010 enrolment data provided by the ANU Statistical Unit.
The main difference between this approach and the traditional approach (of looking at sequences of consecutive courses in the major) is that all students from a cohort enrolled in all levels are taken into account, that is the progression perspective is switched from the progression in consecutive courses through the major to the progression of students through semesters. This approach made possible the calculation of a Global Retention Rate (Table 2.V), which includes all students of the 2008 cohort (not only those who follow the normal progression of enrolment by level in the three years under consideration but also Late and Advanced Starters within the 2008 cohort). The Equivalent Full-Time Student Load (EFTSL) per semester for all ANU languages at each level, from Semester 1, 2008 to Semester 2, 2010, is shown in Table 2.V (columns 2 to 4).
The Global Retention Rate for a given semester is calculated by dividing that semester’s total language enrolment at all levels by the total language enrolments at all levels in Semester 1, 2008. The Semester Level Retention Rates (Table 2.IV) are highlighted in Table 2.V, as these are the source semester figures for the calculations of these rates. The differences in retention rate calculations between the Semester Level Retention Rates and the Global Retention Rates for all ANU languages is evident in the final columns of Tables 2.IV and 2.V: the source student load figures used to calculate these two rates are also shown in Figures 2.4 and 2.5.
We believe that this new measure of Global Retention Rate is a potentially very useful analytical tool because it addresses the contextual complexity that arises from students entering L&C studies at different levels. While the simpler Semester Level Retention Rate only takes into consideration the apparent normal progression of students from Level 1 to Level 3 from 2008 to 2010 across the core courses in the L&C majors, the more comprehensive Global Retention Rate, in contrast, takes into account both Late and Advanced Starters in the 2008 cohort as well. This has, of course, consequences when apparent retention rates are calculated. Comparing Tables 2.IV and 2.V, we can see that the apparent student retention rate for Semester 2, 2010 (the second semester of the third year of study of the 2008 cohort) is almost 10 per cent higher if the Global Retention Rate is used (46.2 per cent) instead of the more commonly used Semester Level Retention Rate (36.7 per cent).
Another factor influencing the rates is the number of L&C courses a particular student is enrolled in for a particular semester of study. When the student loads for Semester 1, 2010 and Semester 2, 2010 are compared, the load for the latter is actually slightly higher than the load for the former (Figure 2.4). This apparent anomaly appears to be a consequence of the degree structure at ANU: an L&C major requires seven or eight courses, and students aiming to complete a major in three years usually take additional L&C courses in their last semester of study, which is generally the second semester of any given year. This leads to the apparent increase in numbers of students in Semester 2, when it in fact reflects students doing more than one L&C course in that semester (see also section 2.4). Both Global Retention Rate and Semester Level Retention Rate are cohort-based measures. While they do more effectively address some of the potential distortions found with traditional, simpler measures of retention, they nonetheless contain distortions of their own. These are discussed in detail, with reference to some methodological issues, in the following section. Nevertheless, we believe that both the Global Retention Rate and Semester Level Retention Rate illuminate pertinent issues relevant to retention in L&C programs, and, importantly, provide analytical tools that offer insights into the apparent low level of L&C retention rates as generally presented in the literature and sector debate.1 We will return to these issues in section 2.5, where we use the Global Retention Rate and Semester Level Retention Rate to compare retention rates for languages with those of other disciplines.
2.4. Further issues impacting the calculation of retention rates
In the LASP1 study, Nettelbeck et al. (2007, 14–15) found that retention rates in Australian L&C programs vary according to the specific language involved. However, they did not consider the influence of Late Starters and Advanced Starters in their calculation of retention rates. While it would be useful and interesting for us to compare the individual retention rates found by LASP1 with those of individual ANU language programs, and include the influences explored above, we cannot do so for reasons of confidentiality (i.e. we cannot report on individual disciplines or administrative units at an identified university). In order to compare the ANU retention rates in L&C courses with those for groups of cognate disciplines at ANU, we aggregated the 21 Asian, Classical, European and Middle Eastern languages taught at ANU in 2008, 2009 and 2010 into the groupings shown in Table 2.VI. Notably, this aggregation does not coincide with any administrative unit existing at the time.
Table 2.VI. Languages taught at ANU in 2008, 2009 and 2010
|
Name of group |
Languages included in this group |
|
East Asian & Pacific Languages |
Burmese, Cantonese, Chinese (Mandarin), Classical Chinese, Indonesian, Japanese, Javanese, Korean, Laotian, Melanesian Pidgins & Creoles, Thai, Tetum, Vietnamese |
|
European & Classical Languages |
Classical Greek, French, German, Italian, Latin, Spanish |
|
Middle Eastern & Central Asian Languages |
Arabic, Hindi, Persian, Russian, Sanskrit, Urdu, Turkish |
Source: ANU Undergraduate Handbooks.
As noted above, the rates defined in the previous section are cohort rates, based on course enrolments rather than on individual students’ enrolment information, and our method of calculating rates is similar to the Student Progress Ratio (Dobson and Sharma, 1993), as it determines student progression by aggregating student load. However, our rates are restricted to one cohort of students, namely those commencing a degree at ANU in 2008. Our rates are still apparent retention rates, but the distortion produced by the different cohorts of students starting L&C studies at different times in multiple cohorts is reduced. We have chosen to use these rates here because they permit comparison with the progression rates used in Nettelbeck et al. (2007), and because they allow comparison of L&C retention rates with those of other groups of disciplines. However, despite the improvements achieved by considering the 2008 cohort only, and including Advanced and Late Starters, there are still inevitable distortions remaining because of the aggregation of students in such calculations. For example, when a student discontinues studying a language in one semester, but chooses to study another language in the following semester, this would still be counted as studying languages in the calculations reported in Tables 2.IV and 2.V.
There are four additional factors that make the chosen apparent Global and Semester Level Retention Rates still not as accurate as computations that used individual student data.
- Second semester entry: Students who commenced their university studies in second semester 2008 were not necessarily able to start L&C studies in their semester of initial enrolment. Such students increase the number of Late Starters in the first semester of the following year (as shown in Figure 2.6.a, comparing the second and third bars).
- Mode of study: Part-time students affect the apparent retention rate, as they do not necessarily follow the path of studying languages in every semester under consideration. As Figure 2.6.b shows, the data include a component of part-time students. Similar influences can be found when considering combined degree students, students who enter university through associated degrees, cross-institutional enrolments and students who transfer from other institutions.
- International students: International students also appear to start L&C studies in their second or third years of study at university. This is shown in Figure 2.6.c, where it can be seen that the international student load for 2009 is higher than the load for 2008 in both semesters, and that the international student load for both semesters in 2010 is higher than the load for Semester 2, 2009. We will explore the situation of international students and students that speak a LOTE at home in section 2.6, because this has an influence on the perceptions of other students.
- Varying pathways: Similar irregularities can be found for different student pathways in language majors. For example, the load for Middle Eastern and Central Asian languages increases in second semester 2009 because the summer course study in Jordan is included (evident in Figure 2.6.d and even more obviously in Figure 2.7.d).
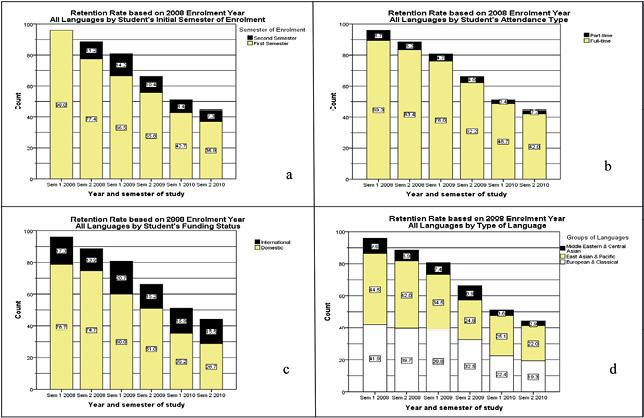
Figure 2.6. Some factors affecting the calculation of retention rates
Source: Calculated based on enrolment data provided by the ANU Statistical Unit.
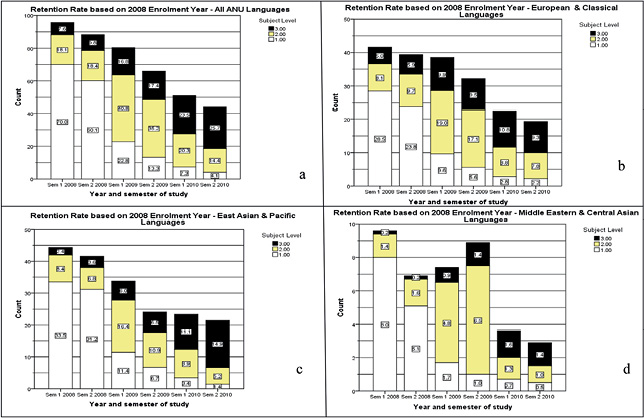
Figure 2.7. Retention rates based on 2008 Enrolment Year Student Cohort—Languages
Source: Calculated based on enrolment data provided by the ANU Statistical Unit.
In spite of all these remaining systematic distortions in rate calculations, the application of the retention rates as defined in section 2.3 is not only a significant advancement over the traditional way of calculating retention rates, but can also provide useful information when comparing L&C programs with other disciplines.
2.5. Do retention rates vary by discipline?
As previously explained, confidentiality concerns prevented us from calculating retention rates for individual ANU L&C programs, so instead we developed an approach that allowed comparisons of retention rates across ANU discipline areas. First, we compared L&C programs with the discipline grouping ‘Physical and Natural Sciences’, and specifically with two teaching areas (‘Mathematics, Statistics, Econometrics & Mathematical Finance’ and ‘Physics, Astronomy & Chemistry’) that had patterns of sequential courses in their majors similar to those found in L&C programs. Although the Global Retention Rates for all sciences were approximately similar to those for all languages, the ‘East Asian & Pacific Languages’ and ‘European & Classical Languages’ groups (as defined in Table 2.VI) performed better on this index than the grouping ‘Mathematics, Statistics, Econometrics & Mathematical Finance’ (as can be seen by comparing the columns corresponding to these disciplines in Table 2.VII). Similarly, all L&C groupings performed better than the grouping ‘Physics, Astronomy & Chemistry’ (Table 2.VII). These patterns can also be seen graphically in Figure 2.8, where the actual count of the student loads are shown. While the tables compare percentages, in the figures the important features to compare are the overall shape of the figure as a whole, the slope of the reduction of load across semesters, and the relative size of different levels of student load shown in the bars.
We also compared Global Retention Rates for all ANU L&C programs with those for diverse groupings of ANU disciplines. As can be seen in the relevant columns in Table 2.VIII, Global Retention Rates for L&C were lower than those for ‘English & Creative Arts’ and other humanities and social science disciplines, and even lower than groupings such as ‘Computer Science & Engineering’ or ‘Management & Commerce’. These patterns can also be seen graphically in Figures 2.9 and 2.10. For some of these disciplines, the comparisons are not that meaningful, simply because the majors require courses in other disciplines as prerequisites (for example, Mathematics courses are prerequisites for the Computer Science and Engineering majors).
Table 2.VII. Global Retention Rate for Languages and Sciences compared. Only students who enrolled in 2008 are considered
|
Semester |
All Languages |
East Asian & Pacific Languages |
European & Classical Languages |
Middle Eastern & Central Asian Languages |
All Physical & Natural Sciences |
Mathematics, Statistics, Econometrics & Mathematical Finance |
Physics, Astronomy & Chemistry |
|
Sem 1 2008 |
100.0% |
100.0% |
100.0% |
100.0% |
100.0% |
100.0% |
100.0% |
|
Sem 2 2008 |
92.3% |
93.1% |
94.7% |
71.9% |
90.0% |
94.7% |
67.4% |
|
Sem 1 2009 |
84.0% |
77.7% |
92.5% |
77.1% |
83.3% |
78.8% |
49.0% |
|
Sem 2 2009 |
68.9% |
55.2% |
77.4% |
92.7% |
61.0% |
63.1% |
35.2% |
|
Sem 1 2010 |
53.4% |
52.1% |
53.8% |
37.5% |
55.2% |
46.2% |
29.5% |
|
Sem 2 2010 |
46.2% |
47.9% |
46.4% |
30.2% |
51.7% |
36.7% |
21.8% |
Source: Calculated based on enrolment data provided by the ANU Statistical Unit.
Table 2.VIII. Global Retention Rate for Languages and other groups of disciplines compared. Only students who enrolled in 2008 are considered
|
Semester |
All Languages |
English & Creative Arts |
Area Studies, International Relations & Political Science |
Sociology, Anthropology & Archaeology |
Biology, Zoology & Environmental Sciences |
Computer Science & Engineering |
Management & Commerce |
|
Sem 1 2008 |
100.0% |
100.0% |
100.0% |
100.0% |
100.0% |
100.0% |
100.0% |
|
Sem 2 2008 |
92.3% |
105.2% |
97.9% |
108.9% |
118.1% |
117.5% |
134.0% |
|
Sem 1 2009 |
84.0% |
88.5% |
81.4% |
98.9% |
101.9% |
102.3% |
111.3% |
|
Sem 2 2009 |
68.9% |
81.5% |
73.3% |
113.9% |
88.4% |
107.9% |
113.5% |
|
Sem 1 2010 |
53.4% |
67.9% |
80.1% |
71.8% |
80.0% |
85.3% |
113.7% |
|
Sem 2 2010 |
46.2% |
61.8% |
63.5% |
70.7% |
73.1% |
77.9% |
90.0% |
Source: Calculated based on enrolment data provided by the ANU Statistical Unit.
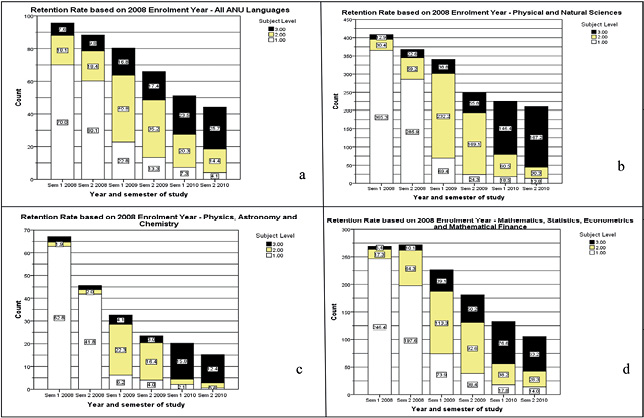
Figure 2.8. Retention rates based on 2008 Enrolment Year Student Cohort—Languages compared with Sciences
Source: Calculated based on enrolment data provided by the ANU Statistical Unit.
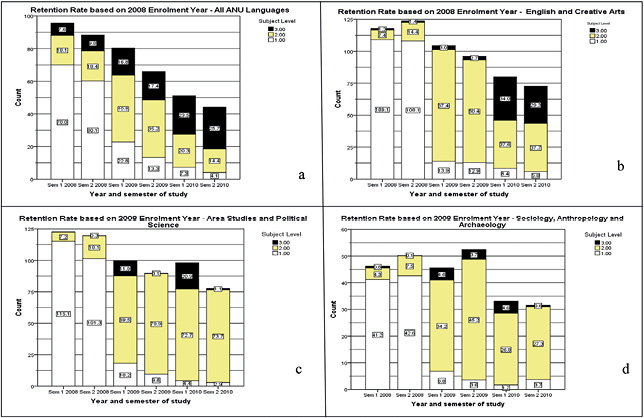
Figure 2.9. Retention rates based on 2008 Enrolment Year Student Cohort—Languages compared with other disciplines 1
Source: Calculated based on enrolment data provided by the ANU Statistical Unit.
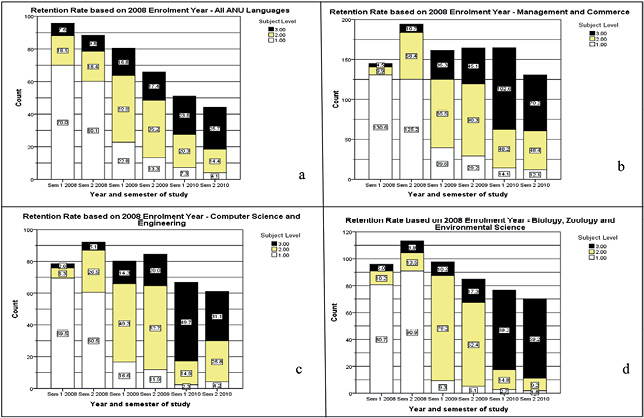
Figure 2.10. Retention rates based on 2008 Enrolment Year Student Cohort—Languages compared with other disciplines 2
Source: Calculated based on enrolment data provided by the ANU Statistical Unit.
We also believe that the lower rate of retention in L&C courses is partly a reflection of the cumulative structure of L&C majors compared with majors in other disciplines, and partly an outcome of the type of content available to students (itself a manifestation of the language of instruction in those disciplines). Clearly, the diverse structures of the relevant major within a degree, or of the degrees themselves, also play a significant role in retention rates, by influencing students’ decision-making with respect to continuing or discontinuing L&C study. This represents a key impacting factor in the different retention rates, so is worth expanding on.
We can conceptualise a language major as a string of connected and related courses, which build on previous courses from Beginner level (Figure 2.11.a), and therefore create a crucial set of prerequisites for those students who wish to study L&C at an advanced level. Consider a student who wishes to study Advanced Persian I: before being able to enrol, she must either show that she has successfully completed four semesters of compulsory Introductory and Intermediate Persian courses, or she must be able to demonstrate (usually through a placement test) an equivalent background in Persian (for example, through study elsewhere). If the student arrives at university with a particular interest in engaging with Persian literature, she may have to study for four or five semesters simply to attain the language skills needed to engage effectively with complex literary texts. While there will of course normally be some exposure to literary texts in conjunction with language studies in Beginner and Intermediate courses, in general in-depth literature study is not possible unless and until students have begun to master the relevant language skills.
In contrast, if the same student were to arrive at university with an interest in English literature, and wanted to complete an English major, she could immediately choose from three or four introductory courses on different aspects of English literature, and an array of later year (Level 2 and 3) courses (Figure 2.11.b). Notably, this would be the case even if the student’s first language was not English: the level of English proficiency required to study in Australia would normally allow her, even in the first year of a degree, to be viewed at the equivalent level of language mastery of an Advanced Persian I student. Furthermore, even if the student of Persian had attained sufficient mastery of the language to engage with complex texts, the range of subject choices would remain much more limited than for the student of English, simply because L&C programs are typically unable to provide a wide range of electives. This deficit is a direct outcome of the need for L&C programs to devote a significant proportion of their comparatively impoverished resources to meet the needs of Beginner and Intermediate students.
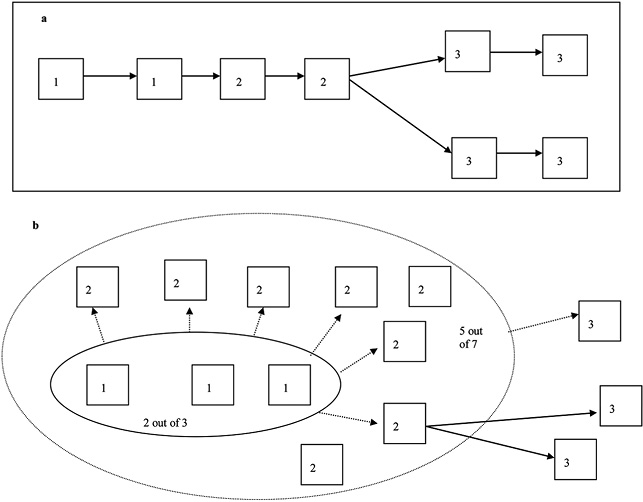
Figure 2.11. Schematic representation of two types of undergraduate majors
Source: Based on an analysis of the structure of ANU majors.
The differences in degree structures between L&C and other programs are similarly influential. For example, a student enrolled in the ANU general Engineering degree can choose from a (limited) set of Engineering majors and, after having completed the basic Level 1 courses, may select from a wide variety of elective Engineering courses. In contrast, an ANU L&C student has far fewer electives from which to choose, and many of the so-called elective options in the degree program are actually taken up with courses directed at achieving mastery of the language itself. Although this situation may be alleviated somewhat by enrolment in the ANU Bachelor of Languages or Bachelor of Arts, which have a high proportion of electives, in general universities have only a limited capacity to provide advanced courses that are taught in a target language and cater to the full spectrum of students’ interests.
How do these structural differences influence retention rates? Sciences, like Languages, have majors that comprise a sequence of correlated courses, and require a long process of mastering basic knowledge before the more interesting content can be accessed (Figure 2.11.a). When we compare Languages with Sciences using the more restrictive Semester Level Retention Rate (Table 2.IX), we find that they are quite comparable, with some Languages performing even better than the two selected groupings of Science disciplines.
We can conclude then that the perceived lower retention rates in Languages are structurally conditioned by the shape of the disciplinary major at ANU and by the relatively few students who enter university with sufficient language proficiency to allow them to start their L&C studies at later-year levels (Level 2 or Level 3 courses). The latter situation appears to be a consequence of the relatively low provision of language teaching at secondary level in Australia (Chapter 1, section 1.3). It is not a coincidence that retention rates for Languages are comparable to those in the Sciences, as these disciplines have similarly structured majors: both require commitment to progressive study over several semesters. Increasingly, it is becoming apparent that inadequate high school science teaching is creating similar issues for tertiary sciences as has happened with languages, that is, allowing students to enter university without a solid foundation in the relevant discipline. One could argue that this factor too is contributing to the similarity of retention rates.
Table 2.IX. Semester Level Retention Rate for Languages and Sciences compared. Only students who enrolled in 2008 are considered
|
Level & Semester |
All Languages |
East Asian & Pacific Languages |
European & Classical Languages |
Middle Eastern & Central Asian Languages |
All Physical & Natural Sciences |
Mathematics, Statistics, Econometrics & Mathematical Finance |
Physics, Astronomy & Chemistry |
|
Level 1 Sem 1 2008 |
100.0% |
100.0% |
100.0% |
100.0% |
100.0% |
100.0% |
100.0% |
|
Level 1 Sem 2 2008 |
85.9% |
93.1% |
83.5% |
63.8% |
78.3% |
74.7% |
66.6% |
|
Level 2 Sem 1 2009 |
58.3% |
49.0% |
66.7% |
60.0% |
63.6% |
42.9% |
35.5% |
|
Level 2 Sem 2 2009 |
50.3% |
32.5% |
60.0% |
81.3% |
46.3% |
35.0% |
26.1% |
|
Level 3 Sem 1 2010 |
33.6% |
33.1% |
37.9% |
20.0% |
40.1% |
29.0% |
25.2% |
|
Level 3 Sem 2 2010 |
36.7% |
44.5% |
32.6% |
17.5% |
45.8% |
23.9% |
19.7% |
Source: Calculated based on enrolment data provided by the ANU Statistical Unit.
2.6. Late starters at advanced levels—Students who speak a language other than English (LOTE) at home
Our data exploration below will show that the group we designate as Late Starters includes not only those students who enrol in Beginner L&C courses when they are close to completing their degrees, but also those students who enrol in Advanced L&C courses at that stage. This phenomenon was not discovered in the LASP1 and LASP2 studies (Nettelbeck et al., 2007, 2009) simply because both studies were restricted to Beginner level. The ANU case study found that international students and domestic students who speak a LOTE at home tend to enrol directly in L&C courses at Advanced levels after they have commenced their university studies. In general, we will also explore whether retention rates in L&C programs are significantly influenced by the number of enrolled students who speak a LOTE at home.
In Chapter 1 (section 1.7) we noted the LASP2 finding that some 50 per cent of students at Beginner level in Japanese reported speaking Chinese at home (Nettelbeck et al., 2009, 12). In our analysis, we questioned whether this was a relevant finding, worthy of consideration or merely an incidental one. Unfortunately, while the ANU study included a demographic question that allowed us to distinguish between domestic and international students, the LASP2 survey did not, so direct comparison was not possible. Nevertheless, given that Chinese students constitute about 27 per cent of all international student enrolments (the largest group Australia-wide by far: Australian Bureau of Statistics, 2011), we decided to explore the issue using the Global Retention Rate and Semester Level Retention Rate calculations described in this chapter. To make the analysis clearer, we compare the variable classifying students according to the language spoken at home (English/LOTE) with an unrelated variable traditionally associated with differences in retention rates for L&C studies, namely student gender.
Table 2.X. Retention rates for students who report that they speak English at home. Only students who enrolled in 2008 considered—All ANU languages
|
Semester |
Level 1 |
Level 2 |
Level 3 |
Total All Levels |
Global Retention Rate |
Semester Level Retention Rate |
|
Sem 1 2008 |
51.5 |
12.7 |
4.6 |
68.8 |
100.0% |
100.0% |
|
Sem 2 2008 |
45.5 |
13.9 |
5.3 |
64.7 |
94.0% |
88.3% |
|
Sem 1 2009 |
11.1 |
29.4 |
11.2 |
51.7 |
75.1% |
57.1% |
|
Sem 2 2009 |
6.8 |
26.4 |
11.1 |
44.3 |
64.4% |
51.3% |
|
Sem 1 2010 |
4.1 |
13.9 |
14.2 |
32.2 |
46.8% |
27.6% |
|
Sem 2 2010 |
2.6 |
9.6 |
14.4 |
26.6 |
38.7% |
28.0% |
|
Total All Semesters |
121.6 |
105.9 |
60.8 |
288.3 |
Source: Calculated based on enrolment data provided by the ANU Statistical Unit.
Table 2.XI. Retention rates for students who report that they speak a LOTE at home. Only students who enrolled in 2008 considered—All ANU languages
|
Semester |
Level 1 |
Level 2 |
Level 3 |
Total All Levels |
Global Retention Rate |
Semester Level Retention Rate |
|
Sem 1 2008 |
18.5 |
5.4 |
3.0 |
26.9 |
100.0% |
100.0% |
|
Sem 2 2008 |
14.6 |
4.5 |
4.5 |
23.6 |
87.7% |
78.9% |
|
Sem 1 2009 |
11.7 |
11.4 |
5.6 |
28.7 |
106.7% |
61.6% |
|
Sem 2 2009 |
6.5 |
8.8 |
6.3 |
21.6 |
80.3% |
47.6% |
|
Sem 1 2010 |
3.2 |
6.4 |
9.3 |
18.9 |
70.3% |
50.3% |
|
Sem 2 2010 |
1.5 |
4.8 |
11.3 |
17.6 |
65.4% |
61.1% |
|
Total All Semesters |
56.0 |
41.3 |
40.0 |
137.3 |
Source: Calculated based on enrolment data provided by the ANU Statistical Unit.
Table 2.XII. Retention rates for female students. Only students who enrolled in 2008 considered—All ANU languages
|
Semester |
Level 1 |
Level 2 |
Level 3 |
Total All Levels |
Global Retention Rate |
Semester Level Retention Rate |
|
Sem 1 2008 |
42.6 |
12.2 |
4.2 |
59.0 |
100.0% |
100.0% |
|
Sem 2 2008 |
37.1 |
12.3 |
5.7 |
55.1 |
93.4% |
87.1% |
|
Sem 1 2009 |
14.1 |
26.2 |
10.7 |
51.0 |
86.4% |
61.5% |
|
Sem 2 2009 |
7.3 |
22.3 |
11.2 |
40.8 |
69.2% |
52.3% |
|
Sem 1 2010 |
4.1 |
13.9 |
16.0 |
34.0 |
57.6% |
37.6% |
|
Sem 2 2010 |
2.7 |
9.8 |
17.1 |
29.6 |
50.2% |
40.1% |
|
Total All Semesters |
107.9 |
96.7 |
64.9 |
269.5 |
Source: Calculated based on enrolment data provided by the ANU Statistical Unit.
Table 2.XIII. Retention rates for male students. Only students who enrolled in 2008 considered—All ANU languages
|
Semester |
Level 1 |
Level 2 |
Level 3 |
Total All Levels |
Global Retention Rate |
Semester Level Retention Rate |
|
Sem 1 2008 |
27.4 |
5.9 |
3.4 |
36.7 |
100.0% |
100.0% |
|
Sem 2 2008 |
23.0 |
6.1 |
4.1 |
33.2 |
90.5% |
83.9% |
|
Sem 1 2009 |
8.7 |
14.6 |
6.1 |
29.4 |
80.1% |
53.3% |
|
Sem 2 2009 |
6.0 |
12.9 |
6.2 |
25.1 |
68.4% |
47.1% |
|
Sem 1 2010 |
3.2 |
6.4 |
7.5 |
17.1 |
46.6% |
27.4% |
|
Sem 2 2010 |
1.4 |
4.6 |
8.6 |
14.6 |
39.8% |
31.4% |
|
Total All Semesters |
69.7 |
50.5 |
35.9 |
156.1 |
Source: Calculated based on enrolment data provided by the ANU Statistical Unit.
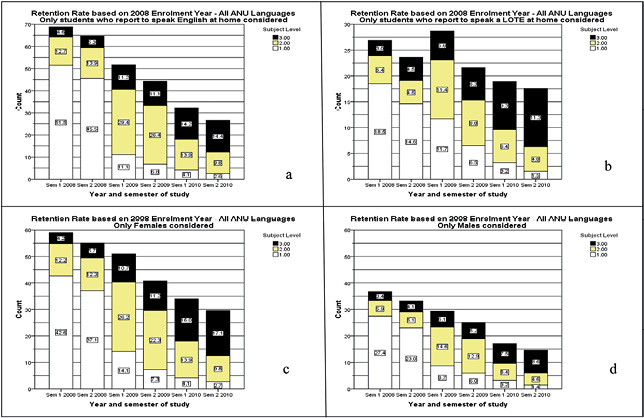
Figure 2.12. Comparison of enrolment patterns by language spoken at home and gender—All ANU languages
Source: Calculated based on enrolment data provided by the ANU Statistical Unit.
We calculated the load enrolment data and the retention rates (Global Retention Rate and Semester Level Retention Rate) for all students enrolled in ANU L&C programs who either speak English at home (Table 2.X) or speak a LOTE at home (Table 2.XI). We also calculated the corresponding Global Retention Rate and Semester Level Retention Rate for female and male students in our data (Tables 2.XII and 2.XIII respectively). All these data are summarised in Figure 2.12. When the retention rates for these four groups of students (i.e. speak English at home, speak a LOTE at home, female, male) are compared, the enrolment pattern of LOTE students (Table 2.XI) shows two anomalies. First, the Global Retention Rate increases to 106.7 per cent in Semester 1, 2009. Second, the Semester Level Retention Rate decreases from Semester 1, 2008 to Semester 2, 2009, but then increases again in 2010, with a pronounced increase from Semester 1, 2010 to Semester 2, 2010. Notably, the latter increase is much greater than the few percentage points we might expect (as shown in the cases of non-LOTE students, males and females), because of the impact of ANU students who choose to take more than one Level 3 course in their final semester to complete requisite language majors (as previously noted).
To investigate these anomalies further, we undertook an extensive analysis of enrolment data, and found two major contributing factors: the enrolment behaviour of international students and the specific LOTE spoken at home.
Table 2.XIV. Percentage of international students in each year and level—All ANU languages
|
Semester |
Level 1 |
Level 2 |
Level 3 |
Total All Levels |
|
Sem 1 2008 |
19.4% |
13.3% |
17.1% |
18.1% |
|
Sem 2 2008 |
17.3% |
9.2% |
18.4% |
15.7% |
|
Sem 1 2009 |
41.7% |
19.4% |
19.6% |
25.7% |
|
Sem 2 2009 |
36.8% |
16.5% |
25.9% |
23.1% |
|
Sem 1 2010 |
39.7% |
24.6% |
34.0% |
31.1% |
|
Sem 2 2010 |
34.1% |
30.6% |
37.7% |
35.1% |
|
Total All Semesters |
24.0% |
18.5% |
28.4% |
23.1% |
Source: Derived from 2008-2010 enrolment data provided by the ANU Statistical Unit.
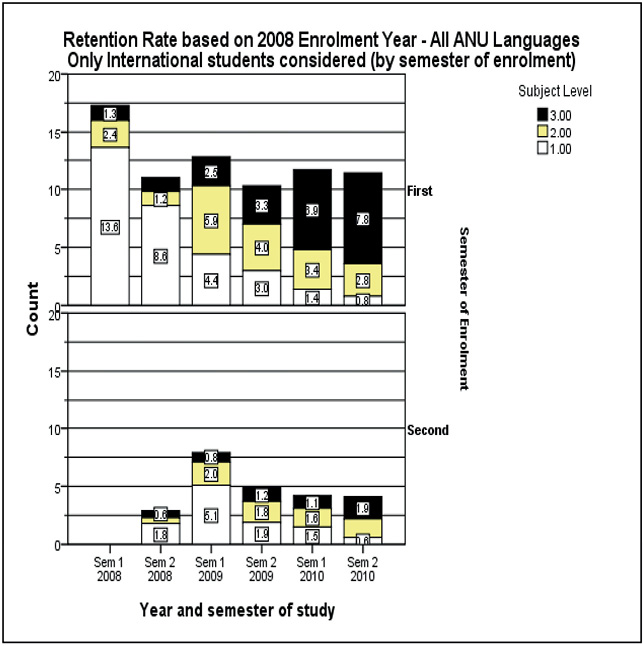
Figure 2.13. Comparison of enrolment patterns for international students who enrolled in first and second semester 2008—All ANU languages
Source: Calculated based on enrolment data provided by the ANU Statistical Unit.
The first anomaly—an increase in Global Retention Rate from 2008 to 2009 (Table 2.XI) is explained in part by the enrolment behaviour of international students. Some international students who start in the first semester of the academic year are actually enrolled in preparatory courses, and move into their degree program only in the second semester, while other international students actually arrive to study at ANU in the second semester (‘mid-year entry’). In both situations, students without any knowledge of the language they want to study must wait to start L&C studies in Semester 1 of the following year (i.e. Semester 1, 2009 in this study), as borne out by the increase in enrolments in Semester 1, 2009 when compared to Semester 2, 2008 (as shown in Figure 2.13). We also believe that some international students, still adapting to studying in English in the Australian educational system, may even choose to start learning a new language only in their second or third year of study in Australia. This may explain the fluctuations in the percentages of enrolments of international students (Table 2.XIV).
The second anomaly—the increase in the number and proportion of LOTE-at-home speakers taking Level 3 courses in Semester 2, 2010 (Table 2.XV)—is likely to relate largely to the enrolment as Late Starters of those among these students who already have knowledge of the target study language, that is they commence study at post-Beginner level (either because they are native speakers of the target language or because they have previously studied that language before coming to Australia), but can also be influenced by the availability of parallel thematic courses at a higher level.
Table 2.XV. Percentage of students who speak a LOTE at home in each year and level—All ANU languages
|
Semester |
Level 1 |
Level 2 |
Level 3 |
Total All Levels |
|
Sem 1 2008 |
26.4% |
29.8% |
39.5% |
28.1% |
|
Sem 2 2008 |
24.3% |
24.5% |
45.9% |
26.7% |
|
Sem 1 2009 |
51.3% |
27.9% |
33.3% |
35.7% |
|
Sem 2 2009 |
48.9% |
25.0% |
36.2% |
32.8% |
|
Sem 1 2010 |
43.8% |
31.5% |
39.6% |
37.0% |
|
Sem 2 2010 |
36.6% |
33.3% |
44.0% |
39.8% |
|
Total All Semesters |
31.5% |
28.1% |
39.7% |
32.3% |
Source: Derived from 2008-2010 enrolment data provided by the ANU Statistical Unit.
These explanations still do not reveal the whole story, however. When we examined the overall proportion of the 2008 cohort of students who spoke a LOTE at home more closely, considering all L&C students in all ANU programs, all years, and all levels (Table 2.XV), we found that the proportion of LOTE students was higher at Levels 2 and 3 in 2010. Indeed, the proportion of such students in the Level 3 classes in Semester 2, 2010 was significantly higher than that found in the Level 1 classes in Semester 1, 2008. Even assuming a 100 per cent retention of all LOTE students, these high percentages call for an explanation. We believe that this finding is a clear indicator not only that the retention rate of students who speak a LOTE at home is much higher than that of students who speak only English at home, but also that there are many such LOTE students who are Late Starters enrolling directly into Level 2 and 3 L&C courses (missing the Beginner level) in their third year of study at ANU. A comparison of the size of the level 3 enrolments for international students in Semester 1, 2010 (8.0) with the size of the level 2 enrolments in Semester 2, 2009 (5.8) shows that there is an increase in the number of international students that cannot be explained by the normal progression of students in a major (Figure 2.15b).
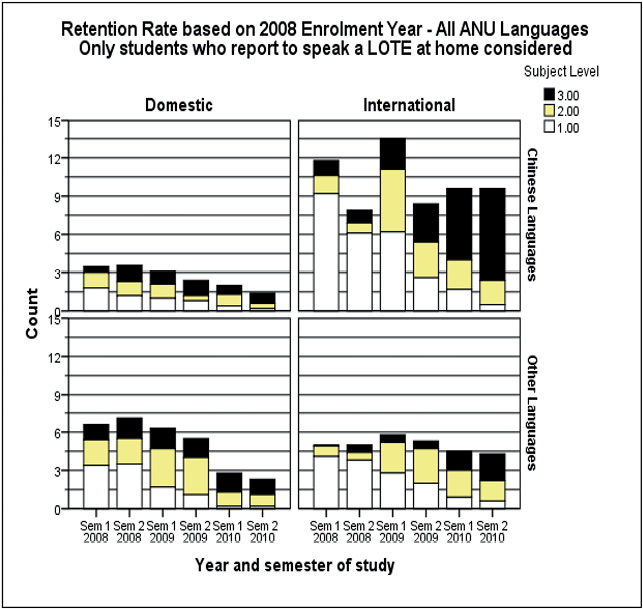
Figure 2.14. Global Retention Rate for domestic and international students, discriminated by the type of LOTE spoken at home. Only students who enrolled in 2008 and report to speak a LOTE at home are considered. The figure provides load for all ANU languages studied.
Source: Calculated based on enrolment data provided by the ANU Statistical Unit.
Moreover, a more detailed investigation, shown in Figures 2.14 and 2.15, shows that the Late Starter phenomenon associated with students who speak a LOTE at home could be explained by the enrolment behaviour of those international students who reported speaking a Chinese language at home (that is, not only major Chinese languages, such as Mandarin and Cantonese, but also others such as Chang Chow, Hunan, Kan and Hakka). A more detailed exploration (not shown here) found that these students enrolled in courses in Chinese-English translation, Classical Chinese and Cantonese as well as in diverse Level 3 (Advanced) courses in other languages.
Unfortunately, as our data were based on course enrolments and not individual student enrolments, we cannot calculate the proportion of students who had not previously studied a language at ANU but enrolled directly at Level 3. Nevertheless, the enrolment pattern for students who report speaking a Chinese language at home suggests that this behaviour may have a significant impact (Figure 2.14). After considering additional analyses related to this issue (Figure 2.15), we conclude that students who speak Chinese languages are likely to enrol in courses in other Asian languages at the Beginner level—which supports the LASP2 finding (Nettelbeck et al., 2009), and also likely to enrol in Level 3 courses and translation courses at an Advanced level. In fact, if Figures 2.15.b and 2.15.d are compared, it can be calculated that more than 75 per cent of international students enrolled in Level 3 L&C courses among the 2008 cohort are students who speak Chinese at home. Moreover, it is likely that this behaviour is typical of international students in general, that is, their first enrolment may occur at any level from Beginner to Level 3 and advanced translation. We therefore extend the finding by Nettelbeck et al. (2009) that students who speak a Chinese language at home are important contributors to enrolment anomalies beyond the Beginner level, and to note that other international students, and domestic Australian students who speak a LOTE at home, also contribute to these confounding influences on retention rates at all levels of L&C studies.
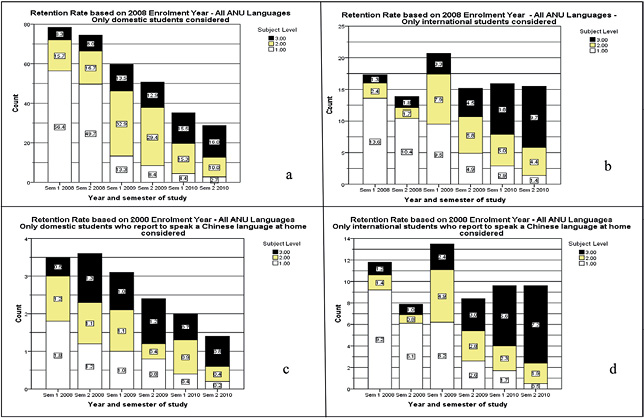
Figure 2.15. Comparison of enrolment patterns for domestic and international students in general and domestic and international students who speak a Chinese language at home—All ANU Languages
Source: Calculated based on enrolment data provided by the ANU Statistical Unit.
In other words, our data shows that students who begin studying a language when they are close to completing their degrees includes not only those students who enrol in Beginner L&C courses (which we designate as Late Starters), but also those students who enrol in Advanced L&C courses at that stage of their degrees. This also means that Advanced Starters are not only first year students who begin their major at an Advanced level, but also students who are close to completing their degree who begin to study L&C courses at advanced language levels. While this is obviously an important finding in relation to the calculation of retention rates, it is also important when thinking about how domestic students are influenced in their thinking about discontinuing. We know that, with regard to Year 12 language examinations, students from English speaking backgrounds feel that the presence of LOTE native speakers impacts negatively on their grades (Lo Bianco, 2009, 50–52; Orton, 2008, 27–29), and these attitudes are almost certainly also found among tertiary students. We will come back to this issue in Chapter 5 when we discuss the issue of mixed levels in advanced courses.
In this chapter, we have reported a new, more reliable way of calculating retention rates—the Global Retention Rate—based on the principles of the Student Progress Ratio. Using this measure we have been able to calculate retention rates for L&C programs from 2008 to 2010 and we have compared the rates of the 2008 student cohort to those of other disciplines at ANU. Unfortunately, we have not been able to do similar calculations for attrition rates because we lack the necessary data, namely completion rates and information on students who discontinue university studies at ANU altogether (section 2.4). We were also able to explore the situation of LOTE and international students using the new calculations.
We found that the retention rates for languages, traditionally conceived as low, are in fact comparable to those in disciplines with similar structures in their majors, such as the sciences. We also found that retention rates in languages are influenced by the phenomena of Late Starters and Advanced Starters more than in other university disciplines. Finally, we generalised the findings of Nettelbeck et al. (2009) regarding international students who have Chinese as a mother tongue, and showed that their influence goes beyond the enrolments at Beginner levels.
1 Except when otherwise indicated, all the figures and tables presented in the rest of this chapter contain rates that have been calculated using our reorganisation of the data provided by the ANU Statistical Unit, processed with SPSS®.
Previous



