


 menu
The Doubters' Dilemma
3
Splitting the Masses: Methodology and data analysis
3.1.1. Planning the data collection
An exploratory data collection was conducted in 2008. We refer to this as Phase 1, because we did a more comprehensive data collection later, which we call Phase 2. There were two steps in Phase 1: i) Focus-group student interviews, to provide background information and help inform the development of the data collection instruments; and ii) an online questionnaire, to focus and expand on quantitative aspects of the study.
The online questionnaire targeted two groups of students: ‘Continuers’ (i.e. students who had enrolled in a Beginner L&C course in 2007 and had continued their study in 2008); and ‘Discontinuers’ (i.e. students who had enrolled in a Beginner L&C course in 2007 and had discontinued their study of that language in 2008). To ensure that the privacy of individual students was protected, a core research group based in the university’s evaluation and academic development unit (Centre for Educational Development and Academic Methods) carried out all data collection and analyses. The online questionnaires were hosted on the university’s dedicated online survey system, ANU Polling Online (APOLLO©).
3.1.2. Questionnaire design
In developing the questionnaires, we used some questions from previous studies on student retention and motivation as a starting point, and further elaborated them into four categories:
- Background information, including previous experience of languages and demographic information;
- Reasons for studying a language at university;
- Experience of language study at university; and
- Reasons for discontinuing language study (only asked of Discontinuers) or reasons for continuing language study and, where applicable, for thinking about discontinuing or deferring (only asked of Continuers).
We were able to supplement the collected survey data with ANU internal institutional data on program of study, age, gender, grades obtained in language courses, enrolment category (full-time or part-time, domestic or international), and language spoken at home.
Table 3.I. Languages represented in the focus group discussions (two students were enrolled in more than one language)
|
Language |
No. of Students |
|
Arabic |
3 |
|
Chinese |
11 |
|
French |
8 |
|
German |
1 |
|
Hindi |
1 |
|
Indonesian |
4 |
|
Japanese |
7 |
|
Korean |
1 |
|
Spanish |
9 |
|
Turkish |
1 |
|
Not mentioned |
8 |
Source: Phase 1 Focus Groups Data.
3.1.3. Data collection
The data collection process was trialled in April 2008. Students who were studying a language at ANU at that time were asked to participate in focus groups through an invitation flyer distributed by lecturers in language classes. Four focus groups were held, with a total of 52 participants (both first and second year students), representing at least 10 languages (Table 3.I). The primary purpose of these focus groups was to test and refine the draft questionnaire, especially in terms of providing appropriate response options.
Table 3.II. Response rate for the two pilot questionnaire surveys (includes some repeat entries: students enrolled in more than one language course were allowed to complete a survey for each language)
|
|
Continuing |
Discontinuing |
||||
|
Enrolled |
Responded |
% |
Invited |
Responded |
% |
|
|
Arabic |
39 |
14 |
36 |
26 |
12 |
46 |
|
Chinese |
51 |
30 |
59 |
34 |
9 |
26 |
|
French |
85 |
37 |
44 |
52 |
11 |
21 |
|
German |
13 |
7 |
54 |
34 |
11 |
32 |
|
Hindi |
12 |
1 |
8 |
4 |
1 |
25 |
|
Indonesian |
21 |
3 |
14 |
13 |
4 |
31 |
|
Italian |
18 |
3 |
17 |
28 |
4 |
14 |
|
Japanese |
121 |
50 |
41 |
53 |
12 |
23 |
|
Korean |
11 |
2 |
18 |
7 |
0 |
- |
|
Persian |
5 |
2 |
40 |
3 |
2 |
67 |
|
Sanskrit |
1 |
0 |
- |
5 |
2 |
40 |
|
Spanish |
69 |
4 |
6 |
45 |
11 |
24 |
|
Thai |
6 |
6 |
100 |
5 |
5 |
100 |
|
Turkish |
4 |
0 |
- |
2 |
1 |
50 |
|
Urdu |
5 |
0 |
- |
|
0 |
- |
|
Vietnamese |
4 |
0 |
- |
3 |
2 |
67 |
|
Other, or not specified |
|
4 |
|
|
3 |
|
|
TOTAL |
465 |
163 |
35 |
314 |
91 |
29 |
Sources: ANU Statistical Unit 2008 Enrolment Data and Phase 1 Questionnaire Data.
Formal data collection began in June 2008. All students who had continued into the second year of their language study in 2008 (Continuers) and all students who had discontinued their language study in 2008 (Discontinuers) were invited to complete an online questionnaire. To reach Continuers, flyers were distributed in class by the relevant lecturers. To reach Discontinuers, the relevant language convener sent personal emails to those students identified in this category. As an incentive to participate in the survey, both groups of students were told that they could choose to provide contact details (which would be kept separate from their responses) to go into a draw for three prizes (an mp3 player worth $300 and two book vouchers worth $100 each). In total, 254 questionnaires were completed, 163 by Continuers and 91 by Discontinuers, representing at least 16 languages (Table 3.II).
The response rates for students from different L&C programs varied from 0 to 100 per cent. Although the total response rate for Discontinuers was notably good for surveys of this type, no more than 12 students responded from any one language. This left little room to explore possible differences between languages, and instead required that we combine responses from several languages for most analyses.
While the Phase 1 findings are presented in some detail in section 3.3, it is important to discuss them at this point specifically in terms of their impact on the Phase 2 methodology, and in particular, on the statistical analysis of the Phase 2 data.
3.2. Implications of the Phase 1 findings from a methodological perspective
In brief, the most striking feature of the Phase 1 data was the lack of difference between Continuers and Discontinuers across the range of learning and motivational dimensions that we explored. Both groups reported similar backgrounds in pre-existing language knowledge, similar social relationships with second language speakers/learners, similar reasons for enrolling in ab initio language study and similar experiences of that study.
Two key differences did, however, hint at the underlying complexities. First, Continuers were more likely than Discontinuers to be at an earlier stage of their degree, and to have language study as a compulsory part of that degree. Continuers were also more likely to rate extrinsic or instrumental reasons (employment, degree requirements, life/work in a country of that language), more important than intrinsic reasons (such as interest in specific history/culture of the target language, or of languages in general) in their decision to study the language. Second, although no one reason for discontinuing language study was regarded as important by more than half the Discontinuers, some reasons were more common than others, and students’ decisions to discontinue appeared to be characterised by a cumulative combination of reasons rather than one or two reasons alone. Moreover, almost all the most common reasons given for discontinuing were related, and correlated, to what can be summarised as ‘performing unexpectedly poorly in the course’. At first glance, these findings appeared intuitively understandable: students who had poor experiences associated with their learning performance in a Beginner language course and no extrinsic reasons to continue were more likely to give up. However, the breadth and depth of the Phase 1 data allowed us to investigate the detail, and show that the ‘obvious’ was not so.
When we considered the quality of learning experiences and learning outcomes in more depth, we found that Discontinuers and Continuers reported equivalent experiences of teaching and learning, and equivalent learning outcomes from their Beginner course. What were we to make of this apparent paradox? One possible explanation was that students were influenced not so much by their reasons for discontinuing but rather by their reasons for continuing: that is, all students may experience similar pressures to discontinue, but some experience more pressures to continue. Evidence for this viewpoint included our finding of a higher proportion of compulsory language study amongst Continuers, and the greater importance ascribed to instrumental reasons for language study by Continuers (as previously described).
Overall, then, the Phase 1 study raised more questions than it provided answers, and showed the deep complexity underlying the deceptively simple concepts of attrition and retention. Although we had learned much about students’ backgrounds and motivations in general, our exhaustive exploration of the Phase 1 data with conventional statistical techniques showed virtually no significant differences between students who decided to continue with L&C studies and those who did not. It thus became obvious that for us to feel confident that we understood why students discontinued L&C programs at ANU, and what we could do about it, not only did we need more data, and not restricted to students who have completed a Beginner L&C course only, to increase sample sizes, but we also needed a much more sophisticated way of analysing and interpreting that data.
3.3. Beyond the dichotomy: Moving towards more effective statistical analyses
Our Phase 1 study had been based on the assumption that there would be clear differences between students who continued their L&C studies and those who did not. So when our use of conventional statistical techniques failed to identify clear characteristic differences between Continuers and Discontinuers, we decided to explore the data beyond that basic dichotomy. Considering the respondents as a whole, one additional discriminatory characteristic available to us was the qualitative description of the students’ reasons for continuing or discontinuing their language studies. We used this data to devise a new classification based on students’ commitment to language study, and their circumstances. Initially, we used a cross-tabulation of commitment to language studies and the Continuer/Discontinuer dichotomy (Table 3.III) to derive four new categories, which we labelled Committed Students (committed Continuers), Doubters (less committed Continuers), Reluctant Quitters (committed Discontinuers) and Voluntary Quitters (less committed Discontinuers).
Table 3.III. Classification of students’ commitment to language study
|
Commitment to language studies |
Continuing Students |
Discontinuing Students |
|
High |
Committed Students Did not think of discontinuing and continued |
Reluctant Quitters Had no choice but to discontinue (wanted to continue) |
|
Low |
Doubters Thought of discontinuing but continued (or had to continue) |
Voluntary Quitters Discontinued (Thought of discontinuing and had discontinued) |
Source: Extrapolated from an analysis of Phase 1 Questionnaire Data.
Our exploration of the data grouped in this way certainly showed important differences among the four groups, but also, somewhat surprisingly, demonstrated unexpected similarities between some subgroups.
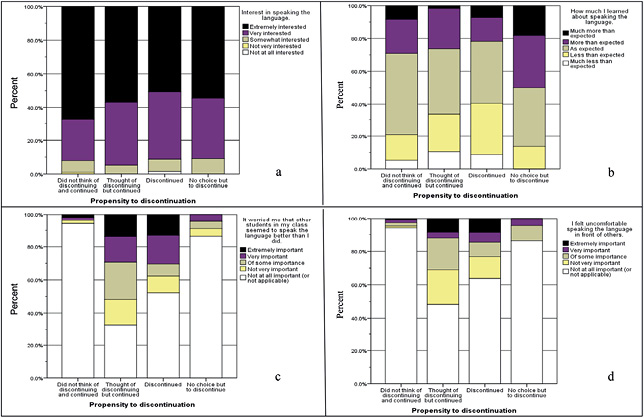
Figure 3.1. The issue of learning to speak the language
Source: Phase 1 Questionnaire Data.
To illustrate this, we will look at the data related to a topic that will be discussed later, namely the issue of learning to speak the language (Figure 3.1). When exploring the answers for the four groups, we found that all four groups showed a very strong interest in acquiring spoken language (Figure 3.1.a). However, the two groups characterised as Committed Students (did not think of discontinuing) and Reluctant Quitters (had no choice but to discontinue) reported that they had learned more spoken language than they had expected in their courses, while the Doubters (thought of discontinuing but continued) and Voluntary Quitters (discontinued voluntarily) reported that they had learned less of the spoken language than they had expected, and less than the other two groups (Figure 3.1.b). These subgroups belonged to different categories in our dichotomous Continuing/Discontinuing analysis.
These results suggested another hypothesis, namely that an important factor influencing students to abandon their L&C study might be their failure to achieve their learning expectations in terms of spoken language. This hypothesis was supported by the finding that Doubters and Voluntary Quitters were more likely (than Committed Students and Reluctant Quitters) to identify two additional reasons that reflected language anxiety: ‘worrying that other students seem to speak better’ and ‘feeling uncomfortable to speak the language in front of others’ (Figures 3.1.c and 3.1.d). At this point in analyses of the Phase 1 data, it became clear that the lack of statistically significant differences between Continuers (comprising the Committed Student and Doubter subgroups) and Discontinuers (comprising the Voluntary Quitters and Reluctant Quitters subgroups) might be a consequence of the internal diversity and spread within the Continuer and Discontinuer groups. To examine this possibility more fully, we decided to explore the data set in greater detail with other statistical techniques.
Table 3.IV. Chi-square analysis of variables in Figure 3.1 according to two different groupings of students
|
Question |
Continuing / Discontinuing |
4 groups |
|
Interest in speaking the language |
5.756 |
10.632 |
|
How much I learned about speaking the language |
4.908 |
14.315* |
|
I felt uncomfortable speaking the language in front of others |
3.201 |
54.635** |
|
It worried me that other students in my class seemed to speak the language better than I did |
5.928 |
84.302** |
* significant at the 0.05 level **significant at the 0.001 level
Source: Phase 1 Questionnaire Data.
Conventional statistical analyses had not identified many significant differences between Continuing and Discontinuing students. For example, there were no statistically significant values coming from Chi-square analysis of cross-tabulated variables (from Figure 3.1.a–d) with the traditional Continuing/Discontinuing dichotomy (Table 3.IV, column 2), whereas the four group classification proposed in Table 3.III (Table 3.IV, column 3) did show significant differences among groups for variables such as ‘It worried me that other students in my class seemed to speak the language better than I did’ or ‘I felt uncomfortable about speaking the language in front of others’. This motivated us to explore retention and attrition with a more detailed classification of students than the initially proposed Continuer/Discontinuer dichotomy.
Given the complexity of the Phase 1 data, we were particularly keen to apply a data reduction statistical technique called Discriminant Analysis (Keckla, 1980), which allows researchers to examine the combination of predictors that best separate the groups with regard to a specific dependent variable. (More details provided in section 3.4.3). In our case, we trialled the use of the variable related to relative commitment (propensity to discontinue) that is, the variable that gave rise to the four groups of students described above (Table 3.III). Unfortunately, the Phase 1 data did not meet the basic assumption of the statistical procedure. Nevertheless, we now recognised a way in which to discriminate usefully among groups of respondents beyond the Continuer/Discontinuer dichotomy: with the much larger data set to be collected in Phase 2, we potentially had a more effective statistical tool to help us explore attrition and retention in more depth.
3.4.1. The Phase 2 data collection instruments
Like Phase 1, Phase 2 was aimed at investigating retention and attrition in L&C programs at ANU and placing the results in the broader context of all Australian universities. Building on the Phase 1 questionnaire, three Phase 2 questionnaires were developed and implemented using the same ANU Apollo© online survey software. The three versions of the questionnaire (Appendices) were respectively administered to:
- students who were enrolled in Beginner courses in 2009 (110 questions; Group 1)
- students who were enrolled in post-Beginner courses that is, Intermediate or Advanced in 2009 (125 questions; Group 2)
- students who had been enrolled in at least one L&C course in 2008, and had since discontinued (111 questions; Group 3).
The questionnaires for Groups 1 and 3 each had four groups of questions:
- background information (basic academic and demographic characteristics)
- reasons for studying the language
- experience of language study
- reasons for discontinuing or deferring language study, or thinking about discontinuing.
The questionnaire for Group 2 students (Continuers) had an additional section on ‘reasons for continuing’. Again, the questions were mostly close-ended (predetermined answers) but some had options for further details. Most questions required answers on a five-point scale (i.e. ‘not at all important’; ‘not very important’; ‘of some importance’; ‘very important’, and ‘extremely important’).
There were two important differences between the Phase 1 and Phase 2 questionnaires. First, while Phase 1 questionnaires were limited to students who had completed a Beginner level course in the previous year, Phase 2 questionnaires were aimed at all students studying languages at ANU, to look holistically at the complex phenomenon, that is, to include students who enter or discontinue L&C studies at different levels (as explored in sections 2.2 and 2.6). Second, the Phase 2 questionnaire included additional questions to allow easier identification of the four subgroups identified in the analysis of the Phase 1 data (where the difference between Reluctant Quitters and Voluntary Quitters was gathered from answers to open-ended questions).
3.4.2. Target respondents, data collection and response rates
The target students for Phase 2 were those enrolled in a Beginner or later year ANU L&C course in Semester 1, 2009 (as at 31 March, the census date for the Australian Government’s Higher Education Contribution Scheme), as well as those who had been enrolled in an ANU L&C course in Semester 1, 2008 at any level, but who had subsequently discontinued their L&C enrolment. To identify the Phase 2 sample, we obtained ANU Student Administration Office records of all students enrolled in any language course in 2008 and 2009.
According to these records, 854 students were enrolled in Beginner level language courses in 2009, and 1,354 were enrolled as continuing students in Intermediate and subsequent courses. This group of 2,208 students was considered the Phase 2 sampling universe (indicating the number of enrolments for all L&C courses, rather than the precise number of students, as some students were enrolled in more than one course). From the same records, we identified 1,033 students as having discontinued L&C studies in 2009 (that is, they had been enrolled in at least one L&C course in 2008 but were not enrolled in an L&C course in 2009). As we could not confirm the number of students who discontinued their study in each language course, we took the total number of discontinued students as our sampling universe.
The Phase 2 data were collected online (again using the Apollo© web-based interface) between May and September 2009. As required by our approved ANU Human Research Ethics Protocol, full information was given with the survey instrument about the objectives of the survey, the confidentiality of the personal information provided, and the time frame. Having had success obtaining good response rates in Phase 1 by using mp3 devices and book vouchers as participation incentives, we again used these incentives in Phase 2. Continuing respondents were recruited via in-class announcements, supported by postings on individual course sites within the ANU Learning Management System. Reminder emails were sent to students’ ANU email addresses. Where possible, students were given time to complete the questionnaires during a scheduled class in a classroom with IT facilities. All students who had discontinued L&C studies, as indicated by university records and manual comparisons of 2008 and 2009 enrolment lists, and who had a valid ANU email address recorded by Student Administration, were emailed and offered the opportunity to participate in the online survey. To augment this approach, we also encouraged students enrolled in L&C studies in 2009 to contact known student peers who had discontinued L&C studies.
For ethical and privacy reasons, we could only attempt to contact discontinued students via extant ANU email addresses (not personal email addresses). As we do not know what proportion of students who graduate or leave the university before completing their studies are likely to check their ANU emails, one frustration in this kind of research is that we must assume that all non-respondents have chosen not to respond (and thus include them in calculating response rates), whereas it is more likely that many students who have discontinued studies at a university (whether because they have graduated or because they have left the university before completion) no longer check their university email addresses and therefore have effectively never received the invitation to participate. Unfortunately, we have no means of even estimating the proportion of our contacted sample for whom this was the case. Our calculated response rates should therefore be considered minima rather than accurate values.
Of the 2,208 enrolled students that we invited to participate in the Phase 2 survey, 1,283 responded, across a range of L&C programs (Table 3.V), comprising:
- 432 students enrolled in a Beginner level course (51 per cent of all enrolled students)
- 520 students enrolled in a more advanced course (38 per cent of all enrolled students)
- 321 students who had been enrolled in a language course in the previous year (2008), but had since discontinued their language study (31 per cent of all enrolled students).1
A total of 38 responses were excluded from the data set because they were invalid or incomplete. Courses in the Classics program, which did not participate in Phase 1 of the study, did participate in Phase 2.
Table 3.V. Response rate of individual languages discriminated by level—Full ANU study sample. Students enrolled in 2009
|
Language |
Beginner Students |
Post-Beginner Students 2009 |
||||
|
Enrolled 2009 |
Responded |
% Response |
Enrolled 2009 |
Responded |
% Response |
|
|
Ancient Greek |
8 |
6 |
75.0 |
23 |
20 |
87.0 |
|
Arabic |
47 |
18 |
38.3 |
84 |
34 |
40.5 |
|
Chinese |
102 |
65 |
63.7 |
237 |
84 |
35.4 |
|
Classics |
37 |
8 |
21.6 |
23 |
2 |
8.7 |
|
French |
172 |
82 |
47.7 |
221 |
100 |
45.2 |
|
German |
57 |
47 |
82.5 |
89 |
36 |
40.4 |
|
Hindi |
10 |
1 |
10.0 |
20 |
4 |
20.0 |
|
Indonesian |
34 |
11 |
32.4 |
56 |
25 |
44.6 |
|
Italian |
36 |
20 |
55.6 |
49 |
17 |
34.7 |
|
Japanese |
190 |
32 |
16.8 |
241 |
62 |
25.7 |
|
Korean |
15 |
15 |
100.0 |
31 |
9 |
29.0 |
|
Latin |
14 |
12 |
85.7 |
24 |
17 |
70.8 |
|
Persian |
7 |
5 |
71.4 |
15 |
4 |
26.7 |
|
Sanskrit |
9 |
3 |
33.3 |
10 |
1 |
10.0 |
|
Spanish |
103 |
93 |
90.3 |
196 |
95 |
48.5 |
|
Thai |
13 |
12 |
92.3 |
18 |
1 |
5.6 |
|
Others |
8 |
8 |
100 |
40 |
29 |
72.5 |
|
Total |
854 |
432 |
50.6 |
1,354 |
520 |
38.4 |
Sources: ANU Statistical Unit 2008 Enrolment Data and Phase 2 Questionnaire Data.
3.4.3. Phase 2 data analysis
When the online surveys were completed, responses were downloaded in SPSS® format for recoding and analysis. Existing variables were recoded and some new variables computed to suit the planned data exploration. We merged the data from two of the surveys—the second or later year continuing students in 2009 and the discontinued students—as these students comprised our interest group. Realising that we would indeed need to move beyond the basic dichotomy of Continuer/Discontinuer, as we had foreseen from our experience with the Phase 1 data, we revisited the categorisation of students into four groups through the use of a dependent variable that indicated the propensity to discontinue (as explained in section 3.3). In contrast to the manual classification undertaken in Phase 1, in Phase 2 this variable was calculated from three direct survey variables—namely the student’s present status (Continuer or Discontinuer), the reason for discontinuing (for Discontinuers), and whether the student reported having seriously thought about discontinuing. This classification, essentially based on each student’s ‘commitment’ to language study and their personal circumstances (Table 3.III), created the same variable with four categories that we used in the exploration of Phase 1 data:
- Committed Students (those who had continued L&C studies and had not thought of discontinuing)
- Doubters (those who had thought about discontinuing but had decided to continue)
- Voluntary Quitters (those who wanted to discontinue and had done so)
- Reluctant Quitters (those who reported wanting to continue but had actually discontinued).
However, although the new variable (propensity to discontinue) allowed for the classification of all students, we found that there were too few cases in the Reluctant Quitters for the relevant analyses to be carried out. This was the outcome, we believe, of the great difficulty in contacting students who are no longer members of an enrolled class, and may even have left the university, as discussed previously. As a result, we felt compelled to combine the Reluctant Quitters with the Voluntary Quitters into a new collective category called simply Quitters (i.e. those who had discontinued L&C studies, the old Discontinuers category). The classification of students for the analysis, then, corresponded to the distribution in Table 3.VI.
Table 3.VI. Reclassification of students’ commitment to language study—Full ANU study sample
|
Commitment to language studies |
Continuing Students |
Discontinuing Students |
|
High |
Committed Students Did not think of discontinuing and continued |
Quitters Discontinued. Include both:
|
|
Low |
Doubters Thought of discontinuing but continued (or had to continue) |
Source: Extrapolated from an analysis of Phase 2 Questionnaire Data.
As with Phase 1, we first used conventional statistical methods to investigate the possibility of significant differences between characteristics and responses of Continuers and Discontinuers. Although the larger sample size did allow us to find more differences between the groups than we had in Phase 1, we still could not discover any reliable way of clearly differentiating the two groups. We also used factor analysis to try to find a bottom-up classification of the variables that described reasons for discontinuing L&C studies (reported in Jansen and Schmidt 2011). This factor analysis focused on a sub-sample of the Phase 2 data that pertained to reasons for ‘discontinuing’ and ‘thinking about discontinuing’. The sample comprised 671 students who had either discontinued their language studies, or declared that they had seriously considered discontinuing. The two groups were combined when a statistical comparison confirmed that they were very closely related. Analysis identified four underlying factors, weighted fairly equally, which could be summarised as follows: ‘having difficulties with language learning’ (factor 1); ‘negative learning experiences, often contrary to expectation’ (factor 2); ‘practical, external reasons’ (factor 3); and ‘affective reasons’ (factor 4).
Although the results were useful for other purposes, as we will see in Chapter 4, the student classification issue was not illuminated further with this procedure when the continuing/discontinuing dichotomy was used to explore the results. However, when we used the three group classification that corresponded to Table 3.VI, we found no less than 49 variables that showed significant differences among the three groups, and 24 additional variables that showed significant differences between subgroups. Traditional data analysis would have stopped here, postulated that the three-way classification of students should be the basis of analysis, and carried out a detailed analysis of the differences between the groupings based on the rankings of the variables that had shown significant differences between the groups. To have done this, however, would have overlooked the implication that what these significant differences show is the individual relationship of a particular variable with the variable that classifies student’s commitment to language studies, without taking into consideration the overall relationship of all the variables that describe the sample. To justify more conclusively that this classification of students should be the basis of analysis, and to understand the phenomena in all their complexity, we again tried using the data reduction statistical technique of Discriminant Analysis (Keckla, 1980), which had been tested unsuccessfully with the Phase 1 data (see above, section 3.3).
3.4.4. Applying Discriminant Analysis to the Phase 2 data
Discriminant Analysis is the traditional data analysis method that allows researchers to examine the combination of predictors that best separate the groups under examination with respect to the dependent variable (Tabachnick and Fidell, 2005, 2.1.3.6). A Discriminant Function Analysis was used to explore the Phase 2 sample according to the three group classification of Committed Students, Doubters and Quitters (corresponding to Table 3.VI). The main aim was to ascertain the validity of using this three-way classification, which we named as the dependent variable ‘propensity to discontinue’. Unlike factor analysis, where the aim is to explain the distribution of data based on a group of variables, Functional Canonical Analysis (FCA) postulates that there is a dependent variable (in this case the ‘propensity to discontinue’ variable), that explains the behaviour of the independent variables (in this case, all the responses to other survey questions). Like factor analysis, however, FCA uses the results of the analysis to suggest which factors or variables differentiate between the cases (in this case why some people have more or less propensity to discontinue language courses).
A total of 106 independent variables associated with the ‘propensity to discontinue’ dependent variable were suitable to be considered into the model. Based on the Analysis of Variance (ANOVA) function output, the model determined 79 variables significant in the analysis (with significance based on the Wilks’s Lambda value, such that the smaller the Wilks’s Lambda, the more important the independent variable to the discriminant function: Stevens, 2002, 287–289). Hence, only the variables with significant Wilks’s Lambda values were considered for the final Discriminant Function Analysis. All remaining variables were dropped from the analysis, although we made an exception for the variable that classified gender and included it in the final model, because it is a variable traditionally associated with language proficiency, and was already linked to differences in our calculations of retention rates (Chapter 2, section 2.6). Hence, we ran the next step of the Discriminant Analysis with 80 variables.
Before the FCA test could be used, however, we needed to test two requisite assumptions—the homogeneity of covariance matrices, and multivariate normality—by running Box’s M Test of equality of covariance matrices. In the case of the sample from the second survey, the Box’s M Test of equality of covariance matrices proved to be not significant (with Box’s M significance p>0.05), so we concluded that the three groups do not differ in their covariance matrices, which is the assumption we needed to run the Discriminant Analysis.
Table 3.VII.a. Discriminant Function. Eigenvalues
|
Function |
Eigenvalue |
% of Variance |
Cumulative % |
Canonical Correlation |
|
1 |
11.514a |
85 |
85 |
0.959 |
|
2 |
2.030a |
15 |
100 |
0.819 |
a. First 2 canonical discriminant functions were used in the analysis.
Table 3.VII.b. Discriminant Function. Wilks’s Lambda
|
Test of Function(s) |
Wilks’s Lambda |
Chi-square |
Df |
Sig. |
|
1 through 2 |
0.026 |
2835.61 |
46 |
0.000 |
|
2 |
0.33 |
864.688 |
22 |
0.000 |
Source: Discriminant Analysis of Phase 2 Questionnaire Data.
On computing a Discriminant Function, we noted that the dependent variable, propensity to discontinuation, has three groups, so the number of discriminant functions computed is two (Table 3.VII.a). The eigenvalues show how much of the variance in the dependent variable is accounted for by each of the functions. Wilks’s Lambda shows each function is significant (Table 3.VII.b). The structure matrix (Table 3.VIII) shows the correlations of each significant variable with each discriminant function. The variables are ranked by their contribution to the first axis, the one which accounts for more variance. The correlations serve like factor loadings in factor analysis—that is, by identifying the largest absolute correlations associated with each discriminant function it is possible to gain insight into which variables are the most representative using the stepwise method of Discriminant Analysis, and to further select a smaller set of variables that allow to explain how people are classified by the two functions (Tables 3.IX.a and 3.IX.b). The standardised Discriminant Function coefficients in these two tables serve the same purpose as beta weights in multiple regressions: they indicate the relative importance of the independent variables in predicting the dependent. The standardised Discriminant Function coefficients were used to assess each independent variable’s unique contribution to the discriminant function (Keckla, 1980, 52–58). The two key tables (Tables 3.IX.a and 3.IX.b) show the same 23 variables identified as contributing more weight to the variance of each axis in the structure matrix: in Table 3.IX.a, the variables are ranked by the first discriminant function, while in Table 3.IX.b the variables are ranked by the second discriminant function.
Table 3.VIII. Structure Matrix—Significant Variables—Full ANU study sample
|
Function |
Rank of Variables in |
|||
|
Variables |
F1 |
F2 |
Func 1 |
Func 2 |
|
I enjoy learning the language. |
.732* |
.088 |
1 |
42 |
|
I think knowing more than one language is important. |
.657* |
.171 |
2 |
26 |
|
I feel I am progressing well with the language. |
.515* |
-.100 |
3 |
36 |
|
I get good marks/grades. |
.477* |
-.050 |
4 |
52 |
|
I like the learning materials. |
.473* |
-.049 |
5 |
53 |
|
I like the way it is taught. |
.472* |
-.049 |
6 |
54 |
|
The workload is manageable. |
.445* |
-.058 |
7 |
48 |
|
It would be a shame to give up at this stage. |
.367* |
.210 |
8 |
23 |
|
I find the language easy to learn. |
.348* |
-.028 |
9 |
61 |
|
My family keeps encouraging me to study the language. |
.281* |
-.011 |
10 |
75 |
|
I need to use the language in my work. |
.244* |
.016 |
11 |
70 |
|
My friends have also continued learning the language. |
.216* |
-.027 |
12 |
63 |
|
No better study alternatives are available. |
.191* |
.083 |
13 |
43 |
|
Other study commitments. |
-.171 |
.335* |
14 |
17 |
|
People are discouraging me from continuing language study. |
-.168 |
.353* |
15 |
15 |
|
Timetable clash. |
-.127 |
.213* |
16 |
22 |
|
I feel uncomfortable speaking the language in front of others. |
-.123 |
.413* |
17 |
10 |
|
I don’t like the way the language is being taught. |
-.122 |
.423* |
18 |
9 |
|
I’m finding the workload too high. |
-.116 |
.560* |
19 |
1 |
|
I’m not enjoying the course content. |
-.113 |
.488* |
20 |
5 |
|
My expectations are not being met. |
-.111 |
.403* |
21 |
12 |
|
I’m not satisfied with my progress. |
-.110 |
.504* |
22 |
4 |
|
To participate in cultural activities of the language group. |
.109* |
-.064 |
23 |
45 |
|
To help me in my other studies. |
.104* |
.031 |
24 |
59 |
|
Paid work commitments. |
-.099 |
.301* |
25 |
18 |
|
Teaching/learning materials (including the textbook). |
.099* |
-.099 |
26 |
37 |
|
I’m not getting good marks/grades. |
-.098 |
.440* |
27 |
7 |
|
Not enough class time is spent on speaking the language. |
-.098 |
.446* |
28 |
6 |
|
I fell behind in my studies and can’t catch up. |
-.097 |
.384* |
29 |
13 |
|
I’m interested in the history and culture of the language. |
.094* |
-.017 |
30 |
68 |
|
I’m finding the course too difficult. |
-.094 |
.507* |
31 |
3 |
|
I didn’t think I would get to use the language outside university. |
-.091 |
.345* |
32 |
16 |
|
How interested were you in writing the language? |
.078* |
-.034 |
33 |
57 |
|
I’m thinking of terminating all of my studies. |
-.078 |
.178* |
34 |
25 |
|
Because of the reputation of this language at ANU. |
.075* |
-.068 |
35 |
44 |
|
My family encouraged me to study it. |
.073* |
-.014 |
36 |
74 |
|
Financial reasons. |
-.069 |
.196* |
37 |
24 |
|
It worries me that other students seem to speak better than I do. |
-.065 |
.432* |
38 |
8 |
|
To understand people and cultures outside of my own. |
.065* |
.016 |
39 |
71 |
|
How well I learned to write the language. |
.063* |
-.046 |
40 |
55 |
|
Sex of students. |
-.062* |
-.009 |
41 |
77 |
|
Number of language courses studied. |
.060* |
.015 |
42 |
72 |
|
Experience of previous language learning. |
.059 |
-.113* |
43 |
32 |
|
Class sizes are too big. |
-.058 |
.406* |
44 |
11 |
|
I do not fit in with other students in the course. |
-.057 |
.365* |
45 |
14 |
|
For employment reasons. |
.053* |
.019 |
46 |
66 |
|
Age of respondents. |
-.052* |
.006 |
47 |
78 |
|
How interested were you in reading the language. |
.046* |
-.028 |
48 |
62 |
|
Because I had previously studied the language. |
.045* |
-.016 |
49 |
69 |
|
Enjoyment of language learning. |
.044 |
-.094* |
50 |
39 |
|
I thought it would be an easy subject. |
-.042* |
.010 |
51 |
76 |
|
Family commitments. |
-.040 |
.296* |
52 |
19 |
|
To live or work in a country where this language is spoken. |
.036* |
-.022 |
53 |
65 |
|
I enjoy language learning. |
.036 |
-.111* |
54 |
33 |
|
Learning environment and facilities. |
.034 |
-.126* |
55 |
28 |
|
Problems with daily travel. |
-.034 |
.254* |
56 |
20 |
|
Support from fellow students. |
.032 |
-.103* |
57 |
35 |
|
Teachers’ teaching skills. |
.029 |
-.121* |
58 |
31 |
|
Approachability and availability of teachers. |
.024 |
-.090* |
59 |
41 |
|
My friends are discontinuing. |
-.021 |
.544* |
60 |
2 |
|
What languages do you speak with your relative? |
.021 |
-.024* |
61 |
64 |
|
To communicate with native speakers of the language. |
.019 |
-.063* |
62 |
47 |
|
Workload associated with learning to write the language. |
.018 |
.096* |
63 |
38 |
|
How well I learned to read the language. |
.015* |
-.002 |
64 |
79 |
|
How well I learned to understand other speakers. |
-.015 |
-.109* |
65 |
34 |
|
Index of family knowledge of languages. |
.014 |
-.045* |
66 |
56 |
|
How much freedom did you have to choose whether or not you study a language as part of your degree? |
-.014 |
-.018* |
67 |
67 |
|
To travel to where this language is spoken. |
.014 |
-.033* |
68 |
58 |
|
I have a family background in this language. |
-.014 |
-.030* |
69 |
60 |
|
Because I have previously spent time in a country where the language is spoken. |
-.012 |
-.064* |
70 |
46 |
|
How much I learned about the culture of the language. |
.011 |
-.053* |
71 |
50 |
|
To complete my degree. |
.009 |
.054* |
72 |
49 |
|
Index of extended family knowledge of languages. |
.009 |
-.015* |
73 |
73 |
|
How well I learned to speak the language. |
.009 |
-.126* |
74 |
29 |
|
Overall difficulty of the course. |
.009 |
.152* |
75 |
27 |
|
Advice and feedback from teachers. |
.008 |
-.125* |
76 |
30 |
|
Health reasons. |
-.006 |
.243* |
77 |
21 |
|
My friends are studying this language. |
.005 |
.052* |
78 |
51 |
|
Does your degree require compulsory language study? |
-.001* |
.000 |
79 |
80 |
|
Difficulty learning the grammar in particular. |
.001 |
.094* |
80 |
40 |
Source: Discriminant Analysis of Phase 2 Questionnaire Data.
*Largest absolute correlation between each variable and any discriminant function.
Before exploring how well the discriminant function works for the Phase 2 sample, it is important to consider the graphical representation of the Canonical Discriminant Functions (Figure 3.2). Here we can see how the whole sample is distributed in the two-dimensional space by plotting each respondent score in the space created by the two functions. Figure 3.2.a shows the plotting of the three groups under analysis together. Figure 3.2.b plots those students who reported that they seriously thought of discontinuing L&C studies, but continued (Doubters). Figure 3.2.c plots those students who discontinued L&C studies (Quitters). Figure 3.2.d plots those students who did not think of discontinuing L&C studies (Committed Students).
Table 3.IX.a. Standardised Canonical Discriminant Function Coefficients (ranked by Function 1)
|
|
Function |
Rank of Variables in |
||
|
Variables |
1 |
2 |
Func 1 |
Func 2 |
|
I think knowing more than one language is important. |
.459 |
.166 |
1 |
13 |
|
I enjoy learning the language. |
.457 |
.300 |
2 |
3 |
|
People are discouraging me from continuing language study. |
-.274 |
.393 |
3 |
1 |
|
No better study alternatives are available. |
.265 |
.082 |
4 |
20 |
|
I get good marks/grades. |
.156 |
-.118 |
5 |
16 |
|
It would be a shame to give up at this stage. |
.139 |
.225 |
6 |
6 |
|
Other study commitments. |
-.139 |
.174 |
7 |
11 |
|
Paid work commitments. |
-.130 |
-.010 |
8 |
23 |
|
I enjoy language learning. |
-.130 |
-.163 |
9 |
14 |
|
My friends are discontinuing. |
.129 |
.290 |
10 |
4 |
|
For employment reasons. |
-.121 |
.011 |
11 |
22 |
|
I like the learning materials. |
.118 |
-.095 |
12 |
17 |
|
Timetable clash. |
-.115 |
.049 |
13 |
21 |
|
Difficulty learning the grammar in particular. |
.090 |
-.085 |
14 |
18 |
|
Enjoyment of language learning. |
-.085 |
.082 |
15 |
19 |
|
I feel I am progressing well with the language. |
.076 |
-.168 |
16 |
12 |
|
Not enough class time is spent on speaking the language. |
-.071 |
.193 |
17 |
8 |
|
I didn’t think I would get to use the language outside university. |
-.049 |
.200 |
18 |
7 |
|
Age of respondents. |
-.046 |
.149 |
19 |
15 |
|
To communicate with native speakers of the language. |
-.045 |
-.186 |
20 |
10 |
|
I’m thinking of terminating all of my studies. |
-.033 |
.263 |
21 |
5 |
|
I’m not enjoying the course content. |
.013 |
.186 |
22 |
9 |
|
I’m finding the workload too high. |
.009 |
.345 |
23 |
2 |
Table 3.IX.b. Standardised Canonical Discriminant Function Coefficients (ranked by Function 2)
|
|
Function |
Rank of Variables in |
||
|
Variables |
1 |
2 |
Func 1 |
Func 2 |
|
People are discouraging me from continuing language study. |
-.274 |
.393 |
3 |
1 |
|
I’m finding the workload too high. |
.009 |
.345 |
23 |
2 |
|
I enjoy learning the language. |
.457 |
.300 |
2 |
3 |
|
My friends are discontinuing. |
.129 |
.290 |
10 |
4 |
|
I’m thinking of terminating all of my studies. |
-.033 |
.263 |
21 |
5 |
|
It would be a shame to give up at this stage. |
.139 |
.225 |
6 |
6 |
|
I didn’t think I would get to use the language outside university. |
-.049 |
.200 |
18 |
7 |
|
Not enough class time is spent on speaking the language. |
-.071 |
.193 |
17 |
8 |
|
I’m not enjoying the course content. |
.013 |
.186 |
22 |
9 |
|
To communicate with native speakers of the language. |
-.045 |
-.186 |
20 |
10 |
|
Other study commitments. |
-.139 |
.174 |
7 |
11 |
|
I feel I am progressing well with the language. |
.076 |
-.168 |
16 |
12 |
|
I think knowing more than one language is important. |
.459 |
.166 |
1 |
13 |
|
I enjoy language learning. |
-.130 |
-.163 |
9 |
14 |
|
Age of respondents. |
-.046 |
.149 |
19 |
15 |
|
I get good marks/grades. |
.156 |
-.118 |
5 |
16 |
|
I like the learning materials. |
.118 |
-.095 |
12 |
17 |
|
Difficulty learning the grammar in particular. |
.090 |
-.085 |
14 |
18 |
|
Enjoyment of language learning. |
-.085 |
.082 |
15 |
19 |
|
No better study alternatives are available. |
.265 |
.082 |
4 |
20 |
|
Timetable clash. |
-.115 |
.049 |
13 |
21 |
|
For employment reasons. |
-.121 |
.011 |
11 |
22 |
|
Paid work commitments. |
-.130 |
-.010 |
8 |
23 |
Source: Discriminant Analysis of Phase 2 Questionnaire Data.
It can be seen that the classification into three groups allows plotting respondents of the survey into three clearly defined clouds, as defined by the dependent variable (that is the three-way distinction between Quitters, Doubters and Committed Students). While the clouds for Committed Students and Quitters are relatively compact, and there is little spread of respondents’ scores over the other categories, the cloud of Doubters is more dispersed in the plot, and also shows considerable more overlap with the other categories.
Table 3.X shows the Classification Results of a cross-validation classification of the three groups in the dependent variable. The cross-validation of scores for each case is used to assess how well the discriminant function works, and if it works equally well for each group of the dependent variable. Here it correctly classifies about 96 per cent of the cases, which validates using the three groups in the rest of the data analysis. However, the classification is not equally good for each of the groups. The Classification Results procedure correctly classifies all the Quitters (100 per cent), and almost all Committed Students (97.3 per cent), but only 86.7 per cent of the Doubters in the Canonical Discriminant Functions. This confirms what the observation of the plotting of scores (Figure 3.2) allowed us to predict, as it misclassifies some of the Doubters as Committed Students (7.6 per cent) and Quitters (5.7 per cent). This points to the need to characterise the Doubters in contrast to the other two categories with other techniques, something which we have carried out and report in detail in Chapter 5.
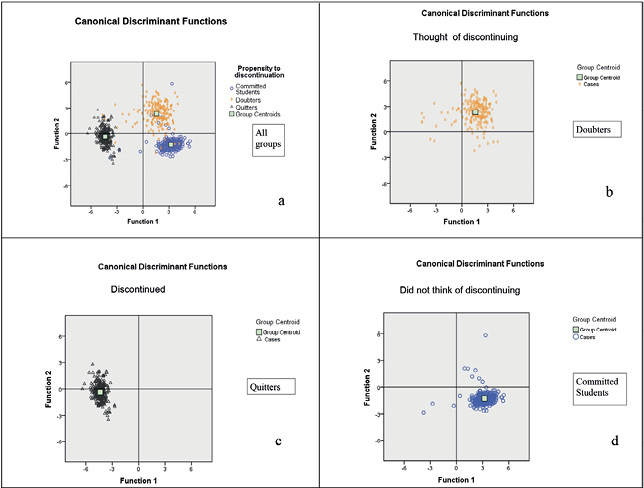
Figure 3.2. Graphical representation of the Canonical Discriminant Functions—Full ANU study sample
Source: Discriminant Analysis of Phase 2 Questionnaire Data.
Table 3.X. Classification Resultsbc for the Canonical Discriminant Functions
|
Group membership |
Values of the variable “Propensity to discontinuation” |
Predicted Group Membership |
Total |
||||
|
Committed Students Did not think of discontinuing and continued |
Doubters Thought of discontinuing but continued |
Quitters Discontinued |
|||||
|
Original |
Count |
Committed Students |
Did not think of discontinuing and continued |
293 |
6 |
2 |
301 |
|
Doubters |
Thought of discontinuing but continued |
14 |
186 |
10 |
210 |
||
|
Quitters |
Discontinued |
0 |
0 |
297 |
297 |
||
|
% |
Committed Students |
Did not think of discontinuing and continued |
97.3 |
2.0 |
0.7 |
100.0 |
|
|
Doubters |
Thought of discontinuing but continued |
6.7 |
88.6 |
4.8 |
100.0 |
||
|
Quitters |
Discontinued |
0.0 |
0.0 |
100.0 |
100.0 |
||
|
Cross-validateda |
Count |
Committed Students |
Did not think of discontinuing and continued |
293 |
6 |
2 |
301 |
|
Doubters |
Thought of discontinuing but continued |
16 |
182 |
12 |
210 |
||
|
Quitters |
Discontinued |
0 |
0 |
297 |
297 |
||
|
% |
Committed Students |
Did not think of discontinuing and continued |
97.3 |
2.0 |
0.7 |
100 |
|
|
Doubters |
Thought of discontinuing but continued |
7.6 |
86.7 |
5.7 |
100 |
||
|
Quitters |
Discontinued |
0.0 |
0.0 |
100.0 |
100 |
||
a. Cross validation is done only for those cases in the analysis. In cross validation, each case is classified by the functions derived from all cases other than that case.
b. 96.0% of original grouped cases correctly classified.
c. 95.5% of cross-validated grouped cases correctly classified.
Source: Discriminant Analysis of Phase 2 Questionnaire Data.
Figure 3.2 and Tables 3.IX.a and 3.IX.b allow us also to propose a preliminary overall interpretation of the differences among the groups, based on the projection of the centroids of the clouds over each of the axes. Function 1 in Figure 3.2 orders the groups in the following sequence: Quitters, Doubters and Committed Students. An exploration of the positive and negative correlations in Table 3.IX.a allows for the uncontroversial and straightforward interpretation that Function 1 stands for commitment and ability to undertake L&C studies.
Function 2 in Figure 3.2 orders the groups in the following sequence: Committed Students, Quitters and Doubters. This function, as well as the ordering of variables in Table 3.IX.b, is more difficult to interpret. As we will explain in detail in Chapter 5, we propose that this function can be interpreted with a construct called ‘Language Capital’. However, before doing this, we require a full characterisation of each of the groups of students.
In conclusion, the Discriminant Analysis performed on the full ANU sample indicated that the three groups in the dependent variable were maximally separated by 79 independent variables, of which 23 were more important than others in explaining the variance of each axis of the Discriminant Analysis plot (Figure 3.2). What the plot did not reveal, however, were the details needed to characterise inter-group differences between Committed Students, Quitters and Doubters in function 2, which is where Chapter 4 will take up the story, using individual variables that we reported as significant in this chapter.
1 These are not shown in Table 3.V because we can only calculate the response rate for the whole group and not for individual languages.
Previous



