


 menu
China's New Sources of Economic Growth: Vol. 2
3. China’s Macroeconomic Balancing Act: Shifting to New Drivers of Growth and Sustaining Financial Stability
Yiping Huang, Yan Shen and Qiuzi Fu
Introduction
At the National People’s Congress (NPC) meeting in early March 2017, the Chinese Government set its annual growth target at 6.5 per cent, a notch down from the actual performance of 6.7 per cent in the previous year. It vowed, however, to achieve better results, if possible (see Figure 3.1). In the first quarter of 2017, better than expected results were recorded, with growth in gross domestic product (GDP) reaching 6.9 per cent. High-frequency economic data, such as those on industrial production, trade and fixed-asset investment, also confirm that, since mid-2016, economic momentum has continued to improve. Analysts’ views on the economic outlook through 2017, however, remain divided. Some believe the economy will do better than in the previous year while others predict a sharp moderation of growth across the year.
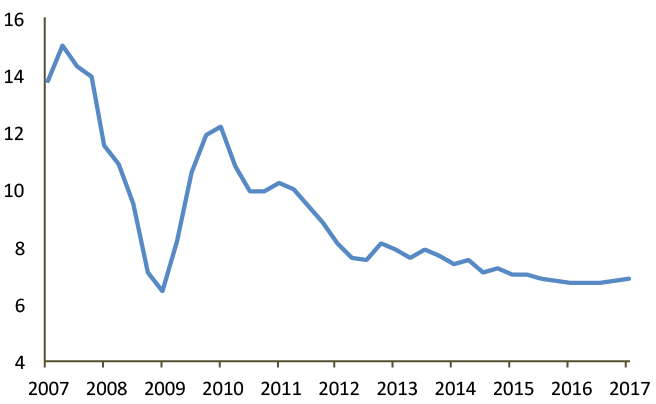
Figure 3.1 Quarterly GDP growth in China, 2007–16 (percentage year-on-year)
Source: CEIC Database: www.ceicdata.com.
We are cautiously confident of the continuation of the current upswing, partly because some of the key drivers of the improvement in economic activity over the past several quarters might not be sustainable. This does not necessarily imply, however, that the Chinese economy will be unable to achieve its growth target. Across various levels, the government is especially committed to supporting growth in the lead-up to the 19th NPC in the third quarter of 2017.
At both the Central Economic Work Conference in December 2016 and the recent NPC, policymakers set the basic tone for economic policy as ‘making progress while maintaining stability’. They specifically outlined three key features of macroeconomic policies for 2017: 1) adopting proactive fiscal policy but prudent/neutral monetary policy; 2) increasing exchange rate flexibility while maintaining basic exchange rate stability; and 3) prioritising the control and resolution of systemic financial risks.
Any bottoming out of economic growth in the near term will likely be short-lived. Since 2010, economists have been debating the nature of the growth slowdown. Some argue that it is a cyclical phenomenon, while others believe it is mainly a change in trend. While these assessments are certainly correct, they probably do not pay sufficient attention to the structural shifts that the current growth slowdown is making necessary, and thus could lead to inappropriate policy suggestions.
The most important cause of the current growth slowdown is a structural one: most of the industries that supported strong economic growth during the past several decades have lost competitiveness, but new industries and the forces driving them, such as consumption, have not developed sufficiently to carry the Chinese economy forward with the previous levels of momentum. In the past, two engines—export and investment—were the main drivers of Chinese growth, while consumption was relatively weak. These two engines were facilitated, respectively, by the labour-intensive manufacturing industries along the southeast coast and the resource-based heavy industries in the northeast and northwest of the country. Both have since lost competitiveness.
In a way, China is confronting challenges today that are typical of the ‘middle-income trap’ hypothesis. That is, prior to an economy reaching the industrial competitiveness frontier—or at least before momentum in that direction is sufficiently large—downward pressure on growth continues. During the past six years, economists have repeatedly forecast the bottoming out of growth in every quarter. But every bottoming out was followed by even slower growth—a trend that evidently continues.
In this chapter, we: 1) briefly forecast the performance of the Chinese economy in the near term; 2) estimate the scale of China’s transition towards those identified ‘new’ drivers of growth; 3) elaborate on the risks and potential of useful policies for maintaining growth in the future; and 4) suggest some appropriate policy strategies.
The remainder of this chapter is organised as follows. The next section discusses some of the key drivers of the short-term growth outlook and concludes that, while some important uncertainties remain, the economy should be able to achieve its growth target of 6.5 per cent. The third section outlines the new-economy index (NEI), developed by one of the authors of this chapter, to draw some implications from the recent literature. In particular, the share of the new economy in the overall economy remains relatively small and there is a clear trade-off between the new and the old economies. Section four analyses the key risks facing the Chinese economy, especially zombie firms and systemic financial risks, followed by some policy recommendations in the final section.
Cyclical versus structural factors
High-frequency official data, grassroots surveys and independent big data analyses agree that Chinese economic momentum picked up after mid-2016. This improved economic outlook was led by three factors: infrastructure investment, property investment and manufacturing investment (see Figure 3.2). Between March and August 2016, growth in infrastructure investment slowed steadily but quickly stabilised thereafter. Property investment also increased marginally after July 2016, while manufacturing investment picked up even more visibly after June 2016.
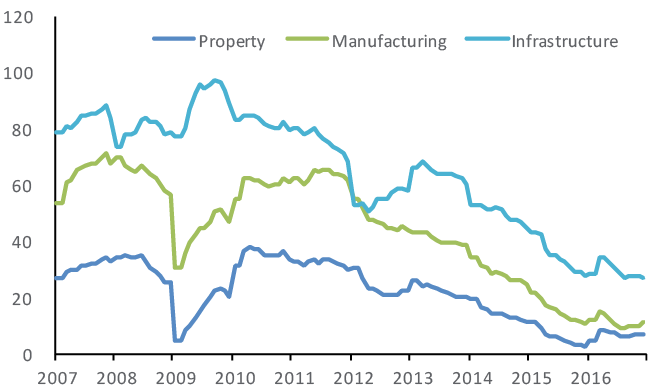
Figure 3.2 Monthly growth of fixed-asset investment in property, infrastructure and manufacturing, 2007–16 (percentage year-on-year)
Source: Wind Database: www.wind.com.cn.
It is important to ask whether these trends are likely to continue throughout the year ahead. Property sales, for example, have already softened in several major cities, after widespread tightening policies introduced during the National Day holiday in 2016. Interestingly, growth in property sales started to moderate from early 2016. Property prices, however, are far more resilient, even after the tightening policies were introduced (see Figure 3.3). Levels of property investment continue to do well in early 2017; however, if sales do not recover, it will be a matter when, not if, property investment weakens.
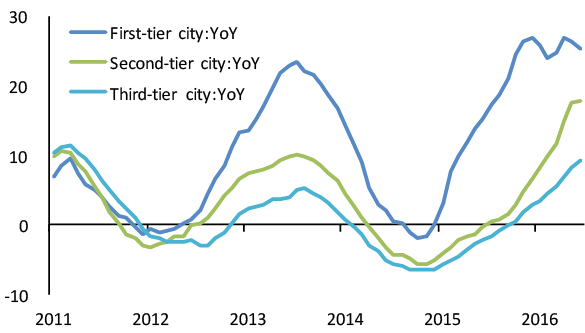
Figure 3.3 Monthly growth of property prices for groups of cities, 2007–16 (per cent)
Source: Wind Database: www.wind.com.cn.
Improvements in manufacturing investment, especially in the private sector, come as something of a surprise, explained in part by the sharp turnaround of the producer price index (PPI). After experiencing more than 50 continuous months of negative growth, the PPI turned positive in September 2016 and rose to 7.8 per cent in February 2017. This change—heavily associated with changes in commodities markets—was likely driven by the Chinese Government’s efforts to reduce excess capacity, especially in steel and coal, and also by an improved global economic outlook. The end of deflation in particular has provided important support for investor confidence.
Whether or not this improvement can be sustained depends partly on transmission from the PPI to the consumer price index (CPI). For instance, in February 2017, while the PPI hit a cyclical high, the CPI stayed at 0.5 per cent (Figure 3.4). This led to concern that any rise in upstream industry prices could squeeze the profit margins of downstream industries, leading to an abrupt end to the improvement in manufacturing investment. Some analysts, however, believe that what happened in February was temporary because: 1) the CPI excluding food was in fact in the more healthy 2–3 per cent range; 2) transmission from the PPI to the CPI could be experiencing a time lag; and 3) broad-based improvements in manufacturing profitability started to emerge.
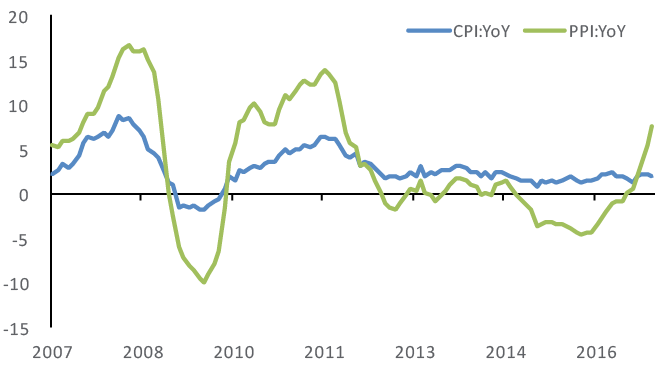
Figure 3.4 Monthly PPI and CPI, 2007–16 (per cent)
Source: Wind Database: www.wind.com.cn.
Despite uncertainty about the sustainability of the recovery in property and manufacturing investment growth, there are two important factors underpinning China’s growth performance in the near term. First, the growth outlook has brightened somewhat for most developed economies, especially the United States, Japan and the European Union (EU), which could induce increased demand for China’s exports. Second, as Chinese leaders emphasise the importance of stability ahead of the party congress, local governments are strongly motivated to support growth. Therefore, the Chinese economy will likely be able to achieve the 6.5 per cent growth target in 2017, even if some of the downside risks do materialise.
This otherwise benign scenario, however, may not continue for long because current improvements in economic momentum are being driven mainly by cyclical and not structural factors. During the past several years, there has been heated debate about the nature of the current growth slowdown, with some commentators believing it to be cyclical while others claim it is a long-term trend. Among the important challenges is the need for industrial upgrading in response to the fact that industries that previously supported rapid economic growth are no longer sufficiently competitive or generating enough demand to achieve the previous levels of growth. During the first three decades of its economic reform, China’s surging economic growth was driven by exports and capital investment. More recently, consumption levels have been rising relative to GDP (Figure 3.5). Before any industrial upgrading is complete, any bottoming out and upturn in economic activity could be short-lived. To some extent, this is typically reflective of the middle-income trap phenomenon.
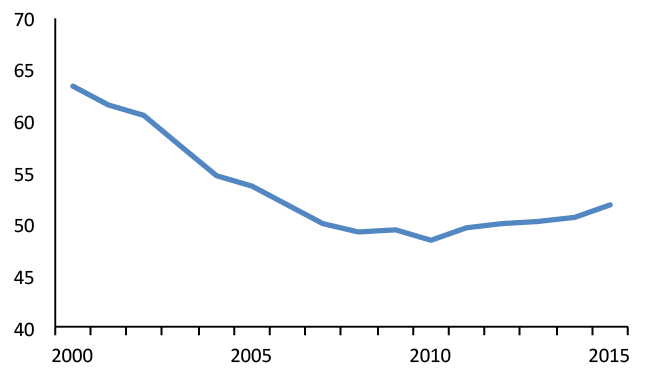
Figure 3.5 Consumption share of GDP, 2000–15 (per cent)
Source: CEIC Database: www.ceicdata.com.
Assessing the emergence of the ‘new’ economy
After more than three decades of rapid economic growth, China has entered the ‘new normal’ stage in which economic growth is slowing and the earlier export-oriented, investment-pulling growth pattern is no longer sustainable. Moreover, space for further export growth appears to be limited given that China’s share in global exports grew from 0.8 per cent in 1978 to 14 per cent in 2015, surpassing Germany (12.1 per cent in 1987) and Japan (9.52 per cent in 1988) at their peak levels. The after-tax return to capital dropped from 12 per cent before 2005 to 4.17 per cent in 2013 (Bai et al. 2006; Bai and Zhang 2014). In parallel, labour costs have been increasing as the demographic dividend began to disappear from around 2013. From 1982 to 2000, the demographic dividend was an important source of growth, contributing 26.8 per cent of the growth in per capita GDP (Cai and Wang 2005). In terms of population structure, China is ‘ageing before affluence’, and the share of those aged 60 and above is projected to increase from 10 per cent of the population in 2000 to about 30 per cent in 2050 (Cai 2010)—increasing the burden of providing support to the elderly.
As China’s previous sources of rapid growth become less effective, the capacity of the ‘new economy’ to offset this slowdown will determine whether China can enjoy sustainable growth from now on. China’s ongoing economic transition will be considered successful only if these new sectors can drive productivity increases and technological advancement. To better gauge the extent of China’s economic transition, it may be useful to measure the size of the new-economy sector and understand how it interacts with the traditional-economy sector. However, partly because of the lack of a clear definition of what constitutes the ‘new-economy’ sector, official statistics cannot help us answer these questions. To fill the void, we have constructed an index that tracks the size and change of the new-economy sector in China using big data collected from the internet.
The new-economy index
To construct the NEI, we first need to specify the scope of the new-economy sector, which includes both newly developed industries and upgraded existing industries. Based on international experience and observations about China, we define an industry as belonging to the new-economy sector if: 1) it is human-capital intensive, technology intensive and/or has a low share of fixed capital investment in its cost structure; and 2) its development follows the country’s industrial policies. We use the Industry Input–Output Table for 2010 and the Sixth Economics Census1 data to identify industries satisfying these standards.
Specifically, we consider an industry to be human-capital intensive if the sum of income from labour and the operating surplus is more than 70 per cent of the value added, the average level of workers’ education is more than 12 years and its share of research and development (R&D) is among the top 10 per cent for that industry. The industrial policies we refer to include documents such as the Guidance for Accelerating the Development of High-Tech Service Industries, issued by the State Council in 2011; the Decision to Accelerate the Cultivation and Development of Strategic Emerging Industries, released in 2012; and Made in China 2025, released in 2015. Ten industries are identified as belonging to the new-economy sector: energy conservation and environmental protection, new energy, new energy vehicles, new materials, new information technology (IT) and information services, recreation, high-tech services and R&D, biological medicine, financial and legal services and high-tech equipment manufacturing.2
It is not feasible to directly measure the size of the new-economy sector, as the official statistics do not yet measure its contribution to GDP. We instead focus on the share of the new-economy sector in the whole economy, and particularly its share of inputs. If a Cobb–Douglas production function is employed, the share of the new economy in total output can be calculated from the relative shares of capital, labour and technology, with appropriate weights. The focus of the construction then becomes how to measure capital, labour and technology for both the new-economy and the traditional-economy sectors.
As official statistics do not measure the above input factors for the two sectors separately, we rely on the big data obtained from the internet to accomplish this task. The data include information on registration for each new enterprise, patents and commercialisation of patents (measuring technology), millions of posts on the websites of major internet recruitment companies, population mobility via rail and air (labour), information on venture capital investment, bidding and companies listed on the New Third Board market (capital). After using machine-learning techniques to separate these inputs into the new-economy and the traditional-economy sectors, we construct the NEI and its capital, labour and technology subindices (for details, see Shen et al. 2016).3
Figure 3.6 presents the average share of new-economy industries in terms of the percentage of inputs that has been distributed to this sector between December 2015 and March 2017. The three largest industries are new IT and information services (12 per cent), financial and legal services (6 per cent) and bio-medicine (3 per cent). IT and financial services have grown relatively rapidly over the years, so it is not surprising this is the largest industry in the new-economy sector. The industry with the lowest share in the new-economy sector is new energy vehicles, which is consistent with the observation that this industry is heavily supported by industrial policies but may not have enough innovation to increase its market share.
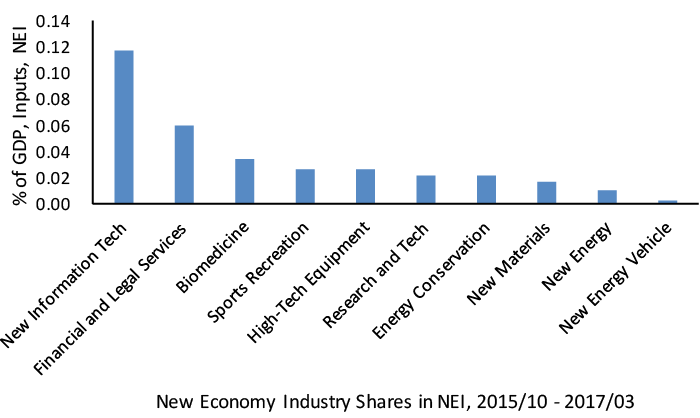
Figure 3.6 NEI industries and their shares
Source: Authors’ calculations.
Can the new-economy sector outpace the traditional-economy sector?
We document the size of our NEI and track its relative change over time. Figure 3.7 delivers two messages about the NEI. First, the new-economy sector accounts for about one-third of China’s GDP; this share increased from 31.4 per cent in October 2015 to 35 per cent in February and March 2016, and then fluctuated around 33 per cent in March 2017. Second, and worryingly, there appears to have been a declining trend in recent months, even though the series is too short for reliable seasonal adjustment. In particular, the March 2017 NEI share is 2 percentage points, or 6 per cent, lower than that of March 2016, indicating that the relative share of the new-economy sector in 2017 is lower than it was in 2016.
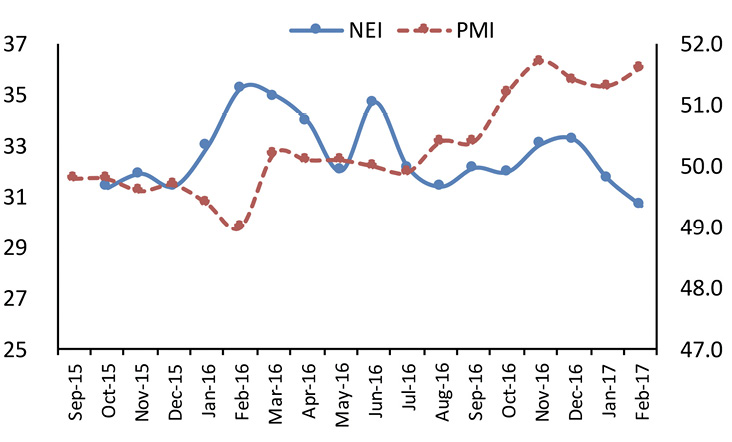
Figure 3.7 NEI (left-hand side) (per cent) and PMI in China
Source: Authors’ calculations.
As the NEI documents the relative share, the shrinkage of the new-economy sector may be due to recovery in the traditional-economy sector, the slower pace of growth in the new-economy sector or both. To find out whether the recovery of the traditional-economy sector is the main driver, we also compare the NEI with the official purchasing manager index (PMI) for manufacturing industries (Figure 3.7). The PMI is constructed based on surveys of representative firms to obtain information on their expectations about the economy. A PMI score lower than 50 indicates a pessimistic attitude towards economic prospects, and a score higher than 50 shows an optimistic attitude. As the firms surveyed in the PMI come predominantly from the traditional-economy sector, growth momentum in this sector is likely driving the PMI. Figure 3.7 clearly shows that there is a negative relationship between the NEI and the PMI—that is, when the PMI increases, the NEI tends to decrease and vice versa. This is true for 14 of the 17 months for which we have records of the NEI.
Figure 3.7 suggests there is a trade-off between the development of the new-economy and the traditional-economy sectors. In particular, starting from July 2016, the PMI passed 50, entering the zone of optimistic attitudes towards the traditional-economy sector. Even in the new-economy sector, there is evidence that industries more closely related to the traditional economy appear to attract more resources. Figure 3.8 plots the shares of the capital, labour and technology subindices in the NEI. It shows that between July 2016 and March 2017, the share of capital inputs has increased, but labour and technology decreased. We therefore need to carefully investigate whether the new-economy sector is being sacrificed to meet the short-term goal of stabilising the wider economy.
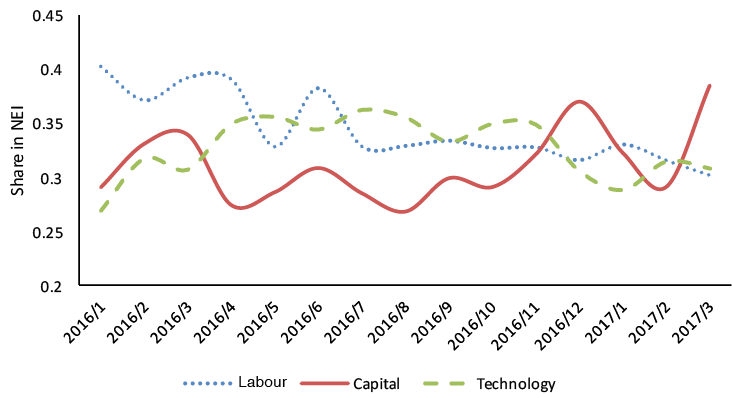
Figure 3.8 Capital, labour and technology subindices
Source: Authors’ calculations.
In Figure 3.9, we compare the NEI with the month-on-month growth rate of value added in the manufacturing industry (VAI). An interesting pattern emerges if the series is split into two periods: before and after July 2016. Before July 2016, the NEI and VAI appear to have a positive relationship; however, after July 2016, this relationship switches to negative. To be more specific, the correlation coefficient for the NEI and VAI is 0.15 before July 2016 but changes to –0.71 after that time.
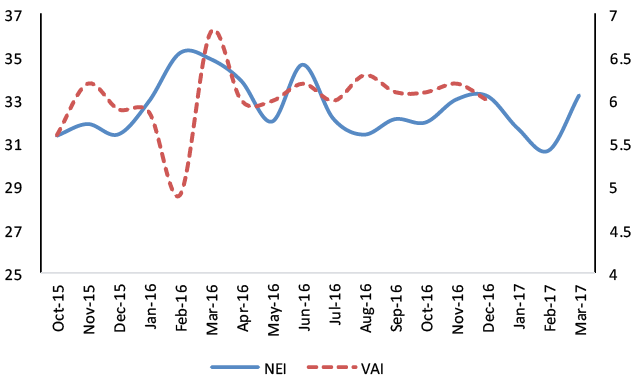
Figure 3.9 NEI (left-hand side) and month-on-month value-added growth rate (per cent)
Source: Authors’ calculations.
The trends presented here suggest that recovery of the traditional economy may hurt the development of the new economy—something also reflected in Figure 3.10, in which we compare the NEI with the month-on-month growth rate of investment in infrastructure. Again, we observe very different patterns before and after July 2016. After July 2016, an increase in the infrastructure growth rate is accompanied by a drop in the NEI, and vice versa. Figure 3.10 indicates that when more investment is directed to infrastructure, fewer resources will be accessed by the new-economy sector, limiting its growth space.
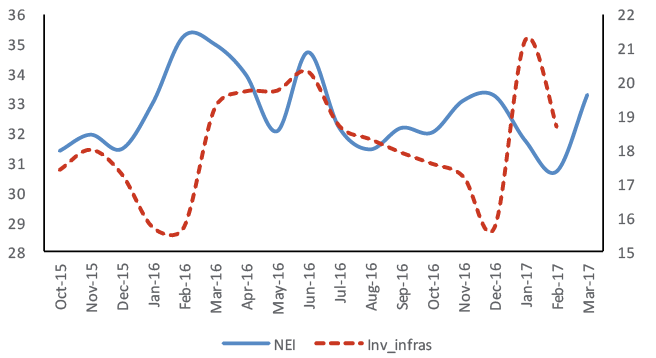
Figure 3.10 NEI (left-hand side) and month-on-month growth rate of infrastructure investment (per cent)
Source: Authors’ calculations.
Here we have described the emergence of China’s new-economy sector and established an index via which to measure it. We find that the new-economy sector comprises about one-third of the whole economy, so it will take some time to replace the traditional-economy sector as the main engine for growth. From the comparisons of the NEI with the PMI, with VAI and with the growth rate of infrastructure investment, we find a disturbing phenomenon that suggests that, in recent months, more resources have been redirected to the traditional-economy sector, limiting the growth of the new-economy sector. Policymakers may need to carefully balance the trade-off between relying on the traditional-economy sector to ‘stabilise growth’ in the short run and developing the new-economy sector to create space for sustainable, long-run and high-quality growth. Rebalancing capital structure by reducing capacity in the traditional-economy sector, eliminating ‘zombie firms’ and increasing investment in the new-economy sector could increase the efficiency of capital utilisation. As development in the new-economy sector often means exploring new business models, the market needs to be the determining factor in fostering the environment for that sector’s prosperity.
Rising systemic financial risks
At the Central Economic Work Conference in December 2016, the NPC in March 2017 and the Politburo meeting in April 2017, China’s leaders—for the first time in recent years—made repeated warnings about rising systemic financial risks.
Indeed, during the past couple of years, many financial areas—from equity and bond markets to shadow banking, property markets, digital finance and foreign exchange markets—have experienced various financial risks. For example, the Shanghai A-share Index rose from about 2,000 in May 2014 to 4,500 in May 2015, before dropping below 3,000 in May 2016. The average ratio of commercial banks’ non-performing loans (NPLs) jumped by 75 per cent during the past two years (Figure 3.11). Although the absolute ratio is still relatively low, many analysts believe that number could be significantly underestimated. The property market has also gone through three cycles since 2009, with each becoming increasingly violent (see Figure 3.3). The most recent example of financial risk is the pressure for capital flight and currency depreciation. The fact that financial risks rotate around different markets could be an important warning sign that such risks have become systemic.
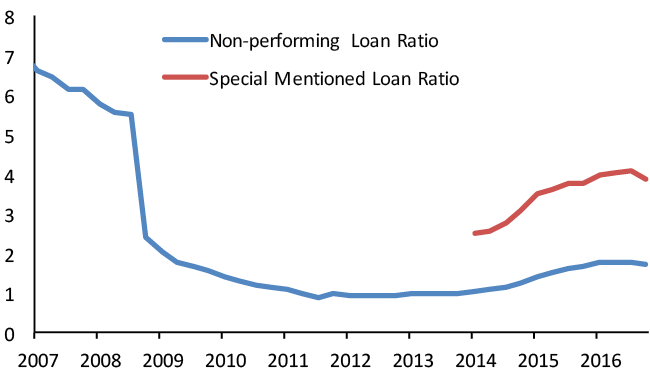
Figure 3.11 Commercial banks’ average NPL ratio (per cent)
Sources: Wind Information Company; CEIC Data Company.
To date, China remains the only major emerging market economy that has not experienced a serious financial crisis—probably for two reasons. First, continued rapid economic growth helped to subdue or hide financial risk. Second, government guarantees have supported investor confidence. A good example of this was that although the Chinese banks’ average NPL ratio probably reached 30–40 per cent at the height of the Asian Financial Crisis, China did not experience a banking crisis. With an implicit, blanket guarantee for bank deposits, depositors were not worried about the safety of their money even though the banks were technically insolvent. Therefore, the government had the time to write-off NPLs, inject capital, introduce strategic investors and list banks’ initial public offerings (IPOs) on domestic and international capital markets. Several years later, the banks were among the strongest in the world, in terms of both size of assets and profits.
Now, however, it will be increasingly difficult for China to maintain that no-crisis record. China’s current macroeconomic conditions are falling within those for a phenomenon the Bank for International Settlements (BIS) calls the ‘risky trinity’: rising leverage ratios, declining productivity and shrinking policy flexibility. On the first, between 2007 and 2014, China’s total non-financial borrowing as a proportion of GDP increased by more than 65 percentage points (Figure 3.12). Data also confirm China’s slowing total factor productivity (TFP) gains since 2008, with the incremental capital–output ratio (ICOR) rising from 3.5 in 2007 to 5.9 in 2015—implying declines in the efficiency of capital use, the effectiveness of stimulus policy and returns to investment. Finally, compared with 2007, the government’s ability to adopt expansionary fiscal and monetary policies is now more limited. Such trends suggest that the government might be less able to contain financial risks than in the past.
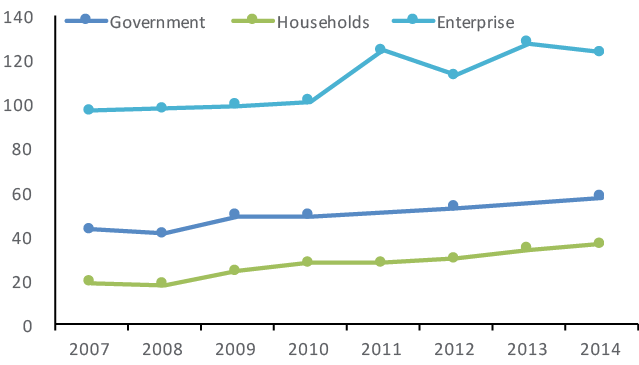
Figure 3.12 China’s leverage ratios (percentage of GDP)
Source: Wind Information Company.
In the meantime, financial risks have grown rapidly. Alongside a rising leverage ratio and falling productivity, the persistent growth slowdown and structural shifts have led to a significant deterioration of corporate balance sheets and produced large numbers of zombie firms. In a way, zombie firms have become a key source of China’s current economic problems: they hinder industrial upgrading, lower financial efficiency and increase financial risks. If we look around the country, industrial upgrading is progressing unevenly between regions. In the south of the country, where the market functions relatively effectively and entrepreneurs are empowered to play active roles in the economy, industrial upgrading is proceeding smoothly. In the north, however, where zombie firms are concentrated, industries are stuck in a state of excess capacity and innovation is proving extremely difficult. These factors are clearly reflected in the differing growth performance of individual provinces (Figure 3.13).
In addition, broad money supply (M2) reached 210 per cent of GDP at the end of 2016, which is among the highest in the world. China’s relatively high M2–GDP ratio is partly attributable to the banks’ domination of its financial system. Any financial transactions are reflected in forms of money supply and borrowing. More important, as a result of the government’s guarantee against financial risks, there is a built-in acceleration mechanism for money supply: when the economy does well, M2 must accelerate to facilitate expansion of economic activities; and when the economy does not do well, M2 must also accelerate to stabilise growth and financial markets.
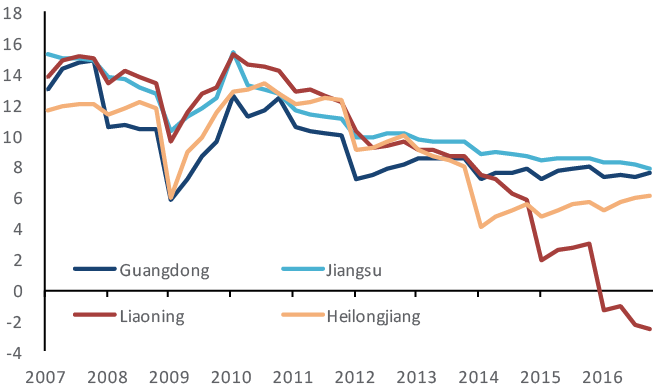
Figure 3.13 Provincial GDP growth of Guangdong, Jiangsu, Liaoning and Heilongjiang, 2007–16 (per cent)
Source: Wind Information Company.
The combination of large volumes of liquidity and limited investment channels (the other side of the coin of a bank-dominated financial system) could easily be equated with financial instability; when large amounts of liquidity flow to a single market, asset prices could quickly skyrocket, followed by a bursting bubble. This is exactly what happened during the past few years in the equity, bond, property, wealth management, digital finance and foreign exchange markets. There was one important reason financial risks were suddenly exacerbated. In the past in China, as in many other countries, M2 growth always exceeded growth in narrow money supply (M1). However, in China from October 2015, M1 growth suddenly accelerated, far exceeding the pace of M2. This essentially implies a massive transfer of funds from term to saving deposits. Depositors, however, were no longer happy with low interest rates on their term deposits and wanted to make better use of their funds; but, because of limited investment opportunities in the domestic market, wherever the funds flew, there was always first a boom and then a bust.
Concluding remarks and policy implications
China’s two fundamental macroeconomic challenges today are achieving growth sustainability and maintaining financial stability. After more than three decades of remarkable economic performance, China’s GDP has moderated steadily since 2010. Although there was an upturn in growth from late 2016, there are doubts about whether and for how long it will be sustainable. China is also the only major emerging market economy that has not yet experienced a serious financial crisis—but how much longer can it retain this record?
Analyses in this chapter led us to three important conclusions. First, recent increased economic momentum was driven mainly by cyclical factors, especially public infrastructure spending and investment in property and manufacturing. The outlook for property investment depends on future property sales, while prospects for manufacturing investment hinge on manufacturing profitability. There is little doubt, however, that China’s economy should realise its growth target in the near term given the combination of an improved global economic outlook and the fact that governments at all levels in China are strongly motivated to support growth ahead of the 19th party congress.
Second, the medium-term picture for China’s economy is less rosy, or at least less certain. The underlying cause of the slowdown in China’s economy is an incomplete transition to new drivers of growth; old industries that had previously supported China’s growth have lost competitiveness, but new industries and new drivers of growth are not yet sufficiently developed to carry China forward with equivalent momentum. The NEI discussed in this chapter suggests that the new economy accounts for only 30 per cent of the total economy so far, and, to some extent, there are clear trade-offs between the new and old economies. Recent strengthening of property and infrastructure investment, while supporting the near-term growth outlook, could actually dim the outlook in the medium term. Before the process of industrial upgrading is complete, any bottoming out and pick up in growth may be short-lived.
Third, there has been an escalation of systemic financial risks in China recently. This is probably related to slow growth, high leveraging, low productivity and limited policy flexibility. Abundant liquidity and limited investment channels have exaggerated the challenge. In recent years, financial risks have rotated between and within different markets, including the equity, property, bonds, wealth management product, digital financial and foreign exchange markets. This suggests that China’s first financial crisis might be closer than we think.
So what should the government do? Since July 2016, Chinese President Xi Jinping has advocated pushing for ‘supply-side reform’. Although interpretations of this are often diverse and sometimes confusing, in essence, supply-side reform means improving productivity instead of concentrating on cyclical demand. In 2016, the government identified five policy objectives that could be regarded as detailed tasks of supply-side reform: reducing excess capacity and housing inventory, deleveraging, lowering costs and overcoming bottlenecks.
The overall objectives of supply-side reform should be to help achieve growth sustainability and maintain financial stability. For the former, the key is to facilitate industrial upgrading—clearing out old industries and developing new ones. And, for the latter, the key is to control overall financial risks—eliminating old risks and containing new ones.
To achieve these two goals, there are lots of policy steps the government could take. Of these, the most important measures should include enforcing market discipline and improving financial regulation.
Letting market forces play a more decisive role in resource allocation was a reform principle decided by the third plenum of the 18th party congress. This is especially important today because government controls present selective challenges to growth sustainability and financial stability. One of the most sticky such issues is how to deal with zombie firms. In past years, governments at various levels have made significant efforts to develop new industries. The continued presence of old industries, especially where these have become zombie industries, reduces the urgency and space for developing new industries. Moreover, zombie firms themselves generate many financial challenges and risks. Therefore, dealing with zombie firms should be a top policy priority.
Compared with those in the 1990s, today’s zombie firms are fewer in number but much greater in size. Although the economy-wide effects of the exit of zombie firms should be much more limited now, the more localised effects on economies and societies could be much more damaging. For some zombie firms, which still enjoy competitiveness in certain areas but suffer from temporary market setbacks, measures such as granting shares to management, mixed ownership, mergers and acquisitions (M&A) and debt–equity swaps may be used to re-energise them. For others, which continuously lose money and are in old-economy industries, bankruptcy might be the only option. The central government should set up a special fund to help ease the pain of any bankruptcies in local society.
In addition, the financial regulation framework should be revamped to preserve financial stability, as the current system suffers from a number of problems. For example, regulators are not independent, so their policies are often compromised by other policy considerations, such as pressure for economic growth and achieving industrial development goals. Regulators also lack an effective coordination mechanism because of the segregated setup, which often leads to either repetition or a regulatory vacuum. Macro prudential regulation, meanwhile, remains immature and needs to be improved significantly to contain systemic financial risks.
References
Bai, C. and Zhang, Q. (2014), The return to capital in China, World Economy (10): 3–30.
Bai, C., Hsieh, C. and Qian, Y. (2006), The return to capital in China, Brookings Papers on Economic Activity (2): 61–101.
Cai, F. (2010), Demographic transition, demographic dividend, and Lewis turning point in China, China Economic Journal 3(2): 107–19.
Cai, F. and Wang, D. (2005), China’s demographic transition: Implications for growth, in R. Garnaut and L. Song (eds), The China Boom and Its Discontents, pp. 34–52, Canberra: Asia Pacific Press.
Shen, Y., Shen, M. G. and Chen, Q. (2016), Measurement of the new economy in China: Big data approach, China Economic Journal 9(3): 304–16.
Appendix 3.1
Main websites of data sources for the NEI
On labour demand
www.51job.com/ [in Chinese]
www.zhaopin.com/ [in Chinese]
www.58.com [in Chinese]
www.liepin.com/ [in Chinese]
On newly registered businesses
www.gsxt.gov.cn/index.html [in Chinese]
On capital
www.pedata.cn/ [in Chinese]
www.qianlima.com/ [in Chinese]
www.bidchance.com/ [in Chinese]
On transportation
www.ly.com/huochepiao/train [in Chinese]
www.umetrip.com (airlines) [in Chinese]
On patents
www.sipo.gov.cn/zhfwpt/zljs/ [in Chinese]
1 National Bureau of Statistics of China: www.stats.gov.cn.
2 The four-digit industry code for the new-economy sector can be found in our technical report. Available from: mt.sohu.com/20160504/n447633738.shtml.
3 Appendix 3.1 provides the main websites from which we collected the data.
Previous



