


 menu
China's New Sources of Economic Growth: Vol. 2
18. Promoting the Belt and Road Initiative by Strengthening ‘5 + 1’ Cooperation1
Biliang Hu, Qingjie Liu and Jiao Yan
Introduction
The concept of ‘5 + 1’ refers to cooperation between the five countries of the Eurasian Economic Union (EEU)—Russia, Belarus, Kazakhstan, Kyrgyzstan and Armenia—and China under the framework of the Belt and Road Initiative (BRI). Commonly abbreviated as ‘5 + 1’, this initiative deepens China’s connectivity with the emerging entity of the EEU, which was officially launched on 1 January 2015.
The process of advancing the idea of the EEU began in January 2010, when Russia, Belarus and Kazakhstan formed a customs union. On 29 May 2014, Russia, Belarus and Kazakhstan signed the ‘EEU Treaty’ in Astana, the capital of Kazakhstan. Finally, on 1 January 2015, the EEU was officially launched, with the medium-term goal of realising the free flow of goods, services, capital and labour between member countries by 2025, and, ultimately, a union similar to the European Union (EU). On 2 January 2015, Armenia also joined the EEU. Kyrgyzstan, which had originally planned to join in May 2015, joined on 12 August that year.
Also in May 2015, China and Russia formally signed an agreement stipulating they would cooperate in the construction of the Silk Road Economic Belt and in building up the EEU to stimulate regional economic growth, strengthen regional economic integration and safeguard regional peace and development.
Proposed by Chinese President Xi Jinping in 2013, the BRI aims to build a prosperous Silk Road Economic Belt and 21st-century Maritime Silk Road together with the countries in the BRI region. This initiative now includes 65 countries (see Appendix Table 18.A1) with a total population of nearly 4.6 billion (62 per cent of the global population), 40 per cent of the global land area and 31 per cent of aggregate gross domestic product (GDP).
For a number of reasons explained in this chapter, the ‘5 + 1’ initiative is key to the success of the BRI. And there remains substantial scope to enhance infrastructural and trade-related cooperation in particular. In this chapter, we first set out three areas that explain that importance: geography, resources and Sino–Russian relations. Thereafter, we explore the underlying economic trends and issues among ‘5 + 1’ countries, and finally discuss ways to promote cooperation between the two initiatives.
‘5 + 1’ cooperation and the BRI
Cooperation between China and the EEU is important to the promotion of the BRI because of the unique position of EEU countries geographically, in terms of natural resource endowment advantages and the importance of Sino–Russian relations.
Geographical position
The BRI is one of the most important contemporary initiatives in China. Building an effective ‘5 + 1’ platform is key to the incremental implementation of the BRI. On the one hand, the EEU sits geographically within the hinterland of the Eurasian landmass, which acts as a hub connecting East Asian and European trade and transportation. Thus, construction of the Silk Road Economic Belt requires China to work with Russia and Central and West Asian countries to build links along the Silk Road. The five countries of the EEU are therefore pivotal to extending the Silk Road Economic Belt westward and northward.
The BRI comprises six economic corridors, three of which link directly to EEU member countries: the China–Mongolia–Russia Economic Corridor; the New Eurasian Land Bridge Economic Corridor, which passes through Kazakhstan and Russia, and will eventually reach all the way to the Netherlands; and the China–Central Asia–West Asia Economic Corridor, which stretches from the autonomous region of Xinjiang in China’s west through to the five countries of Central Asia, including the EEU’s Kazakhstan and Kyrgyzstan. These three economic corridors are fundamental to the promotion and success of the implementation of the BRI. Through ‘5 + 1’ cooperation, moreover, the relationship among the EEU countries may be strengthened via the promotion of infrastructure construction that serves to connect the economic artery of Eurasia with logistics and transport corridors, in the process promoting free trade, capital flows and communication among countries as well as between people of the region.
Resource advantages
The basic geographic, economic and demographic statistics of the ‘5 + 1’ countries define their importance among those of the BRI. According to World Bank data, in 2015, the 64 countries within the BRI (excluding China) comprised 40.5 million square kilometres. The land area of the five EEU countries alone is 19.5 million sq km—48 per cent of the total land area of 64 BRI countries. Their total GDP in 2015 (current US dollars) was roughly US$12 trillion, of which the EEU members contributed US$1.7 trillion, or some 14 per cent of the total. Among the 64 countries (excluding China), however, the EEU members’ proportion of total population was only 5.6 per cent. In other words, with less than 6 per cent of the total population, the EEU accounted for nearly 15 per cent of GDP of the BRI countries (excluding China).
The EEU countries are also relatively rich in arable land. Data from the World Bank2 reveal that the total area of cultivated land in the 64 BRI countries (excluding China) is 575 million hectares, of which the EEU makes up 159 million ha, or 27.63 per cent of the total. Russia’s total arable land was 122 million ha, ranking it third in the world (after India and the United States); Kazakhstan had 29.4 million ha, ranking it 12th in the world, but fifth among 64 BRI countries.
Figures 18.1 and 18.2 illustrate per capita arable land and the distribution of water resources in the BRI countries, respectively. In terms of per capita arable land resources, Kazakhstan and Russia, respectively, have 1.7 ha and 0.9 ha per person, ranking them second and sixth in the world, respectively, and top two of the BRI countries. Belarus’s per capita arable land area is 0.6 ha, ranking it sixth among the BRI countries. This richness in land resources suggests that Russia, Belarus and Kazakhstan have great potential for agricultural development. In the case of Kazakhstan, its President, Nursultan Nazarbayev, has pointed out his country’s agricultural potential directly—and his hopes that China will increase its investment in agriculture there (Zhao 2015). Former Deputy Prime Minister of Kazakhstan Oraz Jandosov put forward a similar view in a BRI lecture on 11 December 2016 at Beijing Normal University’s Emerging Markets Institute (Ye 2016).
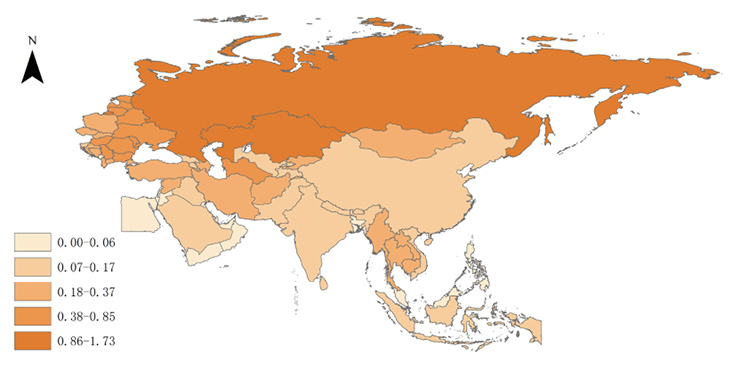
Figure 18.1 Per capita arable land area of BRI countries (hectare per person)
Source: Based on the data from the World Bank: data.worldbank.org/indicator/AG.LND.TOTL.K2.
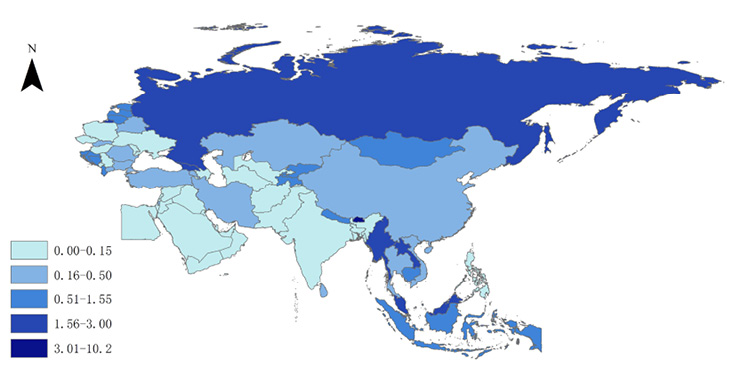
Figure 18.2 Per capita water resources of BRI countries (million cubic metres per person)
Source: Based on the data from the World Bank: data.worldbank.org/indicator/ER.H2O.INTR.K3.
EEU countries are also rich in water resources. Specifically, BRI countries held 12.4 trillion cubic metres of useable water in 2014, of which EEU countries held 4.5 trillion cu m, or 36 per cent of the total.3 In 2014, Russia’s freshwater resources were as high as 4.3 trillion cu m, or 30,000 cu m per capita—a total volume second only to Brazil globally and second among the 64 BRI countries (excluding China), behind Bhutan.
Data from the World Energy Statistics Yearbook (BP 2016) suggest that the total energy output from fossil fuels in the 64 BRI countries (excluding China) in 2015 was 4.76 billion tonnes of oil equivalent (toe), of which the production of the five EEU countries was 1.4 billion toe, or 28.93 per cent of the total. Russia’s output of 1.2 billion toe was, of course, far ahead of the other countries, and was followed by Kazakhstan’s output of 136 million toe.
In 2015, Russia’s oil production was 541 million toe, accounting for 12.4 per cent of global output. This placed Russia third in the world in terms of total oil production, after Saudi Arabia (569 million toe) and the United States (567 million toe) (Figure 18.3). Although Africa is also an important oil-producing area, its oil production was only 298 million toe in 2015—less than half that of Russia.
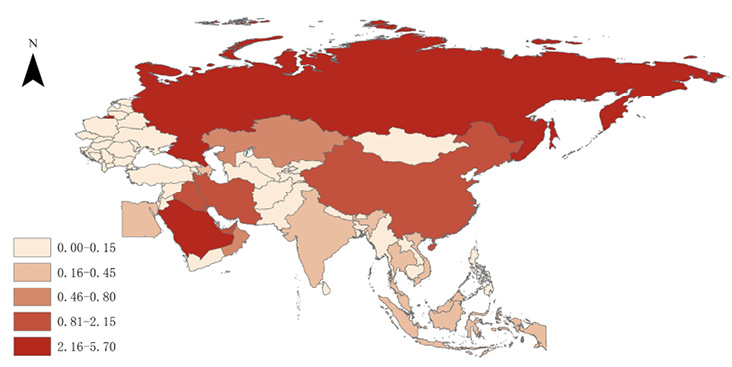
Figure 18.3 Distribution of total oil production of BRI countries (100 million toe)
Source: Based on the data from the World Energy Statistics Yearbook (BP 2016): www.bp.com/statisticalreview.
Russia’s natural gas production in 2015 was 516 million toe, accounting for 16.1 per cent of total global output—close to the production of the entire Middle East (556 million toe) and second only to the United States (705 million toe), ranking it second in the world (BP 2016). Figure 18.4 provides the distribution of natural gas production of BRI countries (toe).
In sum, EEU countries are richly endowed in agricultural, energy, water and other resources. China is home to a huge domestic market and also capital, and therefore it and the EEU countries have significant potential to cooperate under the BRI framework.
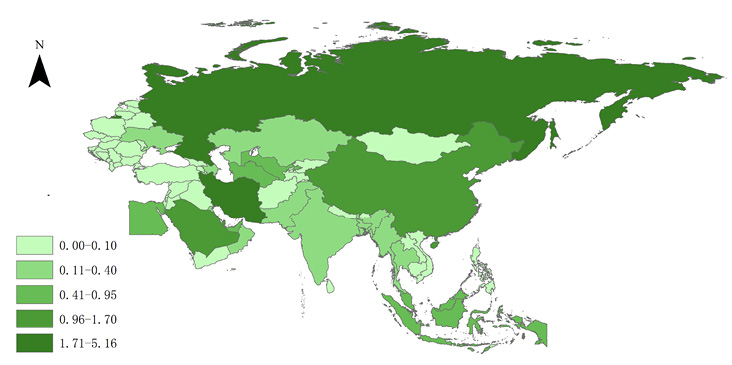
Figure 18.4 Distribution of natural gas production of BRI countries (toe)
Source: Based on the data from the World Energy Statistics Yearbook (BP 2016): www.bp.com/statisticalreview.
Sino–Russian relations
It is in the common interests of China and Russia to maintain good bilateral relations, and it is also of great significance to the implementation of the BRI. As an important neighbour of China, Russia shares with it a border of 4,300 kilometres. The BRI runs through the Eurasian landmass, an area in which Russia is a global power. China plans to work with relevant countries to build up the China–Mongolia–Russia Economic Corridor, the New Eurasian Land Bridge Economic Corridor and the China–Central Asia–West Asia Economic Corridor as an important part of strengthening cooperation with these countries, and particularly with Russia.
Under the current complicated international situation, the best choice for both China and Russia is to integrate the construction of the BRI and of the EEU. In the joint statement of the People’s Republic of China and the Russian Federation signed on 25 June 2016, the two countries clearly stressed that the signing of the Sino–Russian joint declaration on 8 May 2015 to integrate the construction of the EEU and the Silk Road Economic Belt is of great significance. The comprehensive partnership between China and Russia should be open and transparent, while focusing on the interests of both sides, and should accept the gradual participation of member countries of the EEU, the Association of Southeast Asian Nations (ASEAN) and the Shanghai Cooperation Organisation (SCO) (Global Financial Network 2016).
Trends in ‘5 + 1’ trade and investment relations
The ‘5 + 1’ cooperation also contributes to interregional economic and trade cooperation. In the context of globalisation, countries around the world are, in general, deepening economic ties and social connectivity. Regional economic integration provides effective institutional infrastructure to improve the region’s competitiveness. Four of the EEU member countries were states of the former Soviet Union, but gained their independence in 1991: Kazakhstan on 16 December, Armenia on 21 September, Kyrgyzstan on 31 August and Belarus on 25 August. China has worked to establish close relations with all of them, and economic and trade cooperation will be among the most important areas to further these relationships.
Recent relative weakening of trade ties
Trade tightness among the countries is important for future trade development, so we use the trade tightness index to measure the trade dependence of the EEU. In general, the higher the trade density, the closer are the trade ties between the two countries. The basic formula for calculating the degree of trade dependence is as follows (Equation 18.1).
Equation 18.1
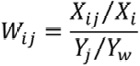
In Equation 18.1, Wij refers to the trade tightness of country i with its trading partner, country j; Xij are the exports of country i to country j; Xi are the total exports of country i; Yj is country j’s total imports; and Yw is total global imports.
Based on this formula, and using trade data from the United Nations Statistical Office,4 we can establish the trade relations of any one of the five EEU countries with the other four members (here we use the term trade connectivity index, which refers to the level of trade relations between countries; the highest is 100, while the lowest is zero). The results are shown in Appendix Table 18.A2. To more clearly highlight the trends found in our results, we also present the numbers as Figure 18.5, based on Appendix Table 18.A2.
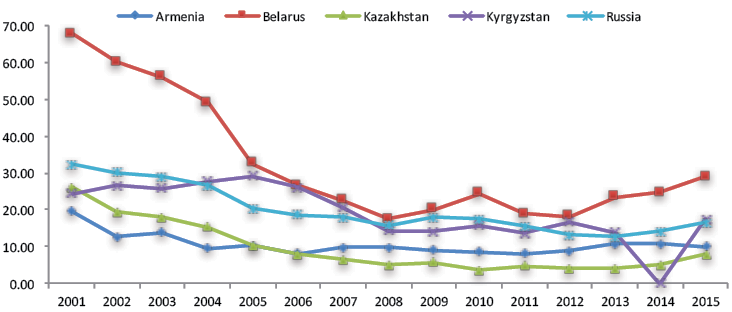
Figure 18.5 Trade tightness between one EEU country and the other four EEU countries
Source: Based on data in Appendix Table 18.A2.
In terms of the trade connectivity index, Figure 18.5 highlights that Belarus trades most tightly with the other four EEU countries. Its index peaked at 67.8 in 2001, and experienced a rapid decline afterwards, but Belarus is still the country with the highest degree of tightness among the EEU countries. Overall, the value of trade of the five EEU countries showed a declining trend, with Kazakhstan falling from 26.1 in 2001 to 7.9 in 2015, a fall of 70 per cent; Belarus fell from 67.8 to 28.97, or 57.3 per cent; Armenia and Russia fell by 49 per cent; and Kyrgyzstan fell by 28 per cent.
In general, and as Figure 18.5 reveals, there have been varying degrees of decline. This is partly explained by the strong convergence in industrial structure among the countries—that is, the trade complementarity between these countries has diminished over time. According to the estimation of Li Jianmin (2014), the degrees of trade complementarity between Russia, Belarus and Kazakhstan are all below 0.5, which is very low, so that the share of trade among these countries (internal trade) is generally lower than the proportions in their total trade (Table 18.1). This simply implies that there is huge potential for these countries to connect to countries outside the EEU, such as China, through improvements in transportation infrastructure and so on; and, therefore, these countries would benefit greatly from the construction of the Silk Road Economic Belt.
According to the data released on the website of the Eurasian Economic Commission,5 Table 18.1 shows that total internal trade in the EEU in 2015 accounted for only 13.5 per cent of total trade volume, but the trade volume of countries outside the EEU accounted for 86.5 per cent of their total trade volume; external trade was 6.4 times that of internal trade. This indicates that EEU member countries barely meet the demand for their products and market on average; however, nearly 90 per cent of the goods in the markets of the five countries were satisfied with their trade partners outside the EEU. In terms of the import and export trade volume of the member countries, Russia’s trade is the most dependent on countries outside the EEU (91.9 per cent); only 8.1 per cent comes from internal EEU trade. For Kazakhstan, the proportion of external trade was 79.2 per cent. Overall, the five EEU countries have a proportion higher than 50 per cent.
Table 18.1 Comparison of internal trade with external trade of the EEU countries, 2015
|
Trade volume inside the EEU to total trade volume (%) |
Trade volume outside the EEU to total trade volume (%) |
|||||
|
Imports and exports |
Exports |
Imports |
Imports and exports |
Exports |
Imports |
|
|
Five countries as a whole |
13.5 |
10.8 |
18.0 |
86.5 |
89.2 |
82.0 |
|
Russia |
8.1 |
8.4 |
7.7 |
91.9 |
91.6 |
92.3 |
|
Belarus |
49.5 |
41.2 |
56.8 |
50.5 |
58.8 |
43.2 |
|
Kazakhstan |
20.8 |
10.7 |
36.1 |
79.2 |
89.3 |
63.9 |
|
Kyrgyzstan |
44.3 |
32.2 |
49.3 |
55.7 |
67.8 |
50.7 |
|
Armenia |
26.3 |
15.9 |
31.1 |
73.7 |
84.1 |
68.9 |
Source: Eurasian Economic Commission (www.eurasiancommission.org).
Table 18.2 Trade between EEU member countries, 2015
|
Percentage of trade volume (US$100 million) |
|||||
|
Armenia |
Belarus |
Kazakhstan |
Russia |
Kyrgyzstan |
|
|
Armenia |
- |
0.07% |
0.01% |
2.82% |
0.001% |
|
Belarus |
0.333 |
- |
1.26% |
57.14% |
0.15% |
|
Kazakhstan |
0.056 |
5.724 |
- |
33.45% |
1.9% |
|
Russia |
12.742 |
259.282 |
151.786 |
- |
3.2% |
|
Kyrgyzstan |
0.005 |
0.69 |
8.636 |
14.544 |
- |
- not applicable
Source: Eurasian Economic Commission (www.eurasiancommission.org).
From Table 18.2, we find that more than 90 per cent of the total trade volume of US$45.4 billion in 2015 was between Russia, Belarus and Kazakhstan, and, within that, mainly between Russia and Belarus, and Russia and Kazakhstan. The trade volume between Russia and Belarus was US$26 billion, accounting for 57.14 per cent of total trade within the EEU; the trade volume between Russia and Kazakhstan was US$15.2 billion, or 33.45 per cent of total trade within the EEU. In third place, the trade volume between Kyrgyzstan and Russia was US$1.5 billion, or 3.2 per cent, followed by the trade volume between Armenia and Russia of US$1.3 billion, or 2.82 per cent. In addition to trade with Russia, trade between the other four member countries was less than US$1 billion, especially between Armenia and Kyrgyzstan, which was only US$500,000 in 2015 and only 0.002 per cent of the trade between Russia and Belarus. According to the relevant research, the main reason for this is a relatively high degree of industrial structure homogeneity between the EEU member countries. Exports are essentially resource and energy products, while imports are largely mechanical and electrical products, so the trade demand between each country is weak, and, in terms of competition with the relative high quality of the international market, there is intense competition between each EEU country (Jin 2016).
China is the EEU’s most important trade partner
Since the independence of EEU member countries, their trade with China has maintained a positive growth trend. According to trade data released by the United Nations Statistics Office, 12.5 per cent of the EEU’s total trade in 2014 was with China, making China the union’s largest foreign trade partner (Table 18.3). Due to the decline in commodity and raw material prices in recent years, the volume of foreign trade in the EEU also declined in 2015; however, according to statistics from the Eurasian Economic Commission, China still accounted for 13.61 per cent of the EEU’s total foreign trade in 2015, meaning it remained the largest trading partner. As for bilateral trade, China is also Russia’s largest trading partner, and the second-largest trade partner of Kazakhstan, Armenia and Kyrgyzstan (Zhang 2016).
Table 18.3 The top-five commodity trading partners of EEU countries
|
Year |
Trading partner |
Exports (US$100 million) |
Imports (US$100 million) |
Share (%) |
|
2014 |
China |
480 |
606 |
12.5 |
|
Germany |
392 |
377 |
8.9 |
|
|
Italy |
528 |
149 |
7.8 |
|
|
Netherlands |
784 |
61 |
6.1 |
|
|
Ukraine |
229 |
136 |
4.2 |
|
|
2015 |
China |
351 |
438 |
13.6 |
|
Germany |
269 |
241 |
8.8 |
|
|
Netherlands |
470 |
37 |
8.7 |
|
|
Italy |
306 |
103 |
7.1 |
|
|
Turkey |
208 |
56 |
4.6 |
Source: Eurasian Economic Commission (www.eurasiancommission.org).
According to the Eurasian Economic Commission, total trade value among the five EEU members in 2015 was US$45.4 billion, but total imports and exports with countries outside the EEU were as high as US$579.5 billion in the same year (US$374 billion in exports and US$205.4 billion in imports). Among the top-five trading partners of the EEU, the total trade with China was US$78.9 billion (of which US$43.8 billion was imports from China and US$35.1 billion was exports to China), accounting for 13.61 per cent of total imports and exports between EEU countries and all countries outside the EEU, making China the biggest trading partner, followed by Germany, with a trade value of US$51 billion, accounting for 8.81 per cent. Trade between the Netherlands and the EEU accounted for 8.7 per cent of the total, just less than Germany, and ranking it in third place. In fourth and fifth place were Italy and Turkey, respectively, whose shares were 7.1 per cent and 4.6 per cent, respectively. According to statistics from the Eurasian Economic Commission, until November 2016, China continued to be the EEU’s largest trading partner, with 15.4 per cent of the total trading value among all countries outside the union.
If we look over a longer period, the overall commodities trading volume showed an upward trend between China and the five EEU countries from 1992 to 2016: from 1992 to 2005, there was relatively slow growth; from 2006 to 2008, the growth was rapid; and, because of the Global Financial Crisis (GFC), the volume fell after 2009. From 2010 to 2014, high growth continued, increasing 53.43 per cent. In the past two years, the impact of falling commodity prices, such as for crude oil, has seen the trade volume decrease slightly.
China–EEU investment relations
China’s direct investment in EEU countries continued to grow over the years, rising from only US$97 million in 2003 to US$22.8 billion in 2015—an increase of 235 times (Figure 18.6). Specifically, China’s direct investment in Kazakhstan increased from US$20 million in 2003 to US$5.1 billion in 2015; its foreign direct investment (FDI) in Kyrgyzstan increased from US$16 million to US$1.1 billion, in Russia it increased from US$62 million to US$14 billion and in Belarus and Armenia it rose from almost zero to US$476 million and US$7.5 million, respectively, in 2015. We can see that China’s direct investment in Belarus has seen the largest increase, especially since the establishment of the China–Belarus Industrial Park in Minsk, the Belarus capital, which is not only the largest overseas industrial park in which China has invested, but also the largest foreign investment project in Belarus. The China–Belarus Industrial Park is playing an important role in promoting cooperation between China and EEU countries. With the construction of the Moscow–Kazan High-Speed Railway, the China–Belarus Industrial Park, the China–Kazakhstan Border Cooperation Zone and so on, economic and trade relations between China and EEU countries will be further strengthened.
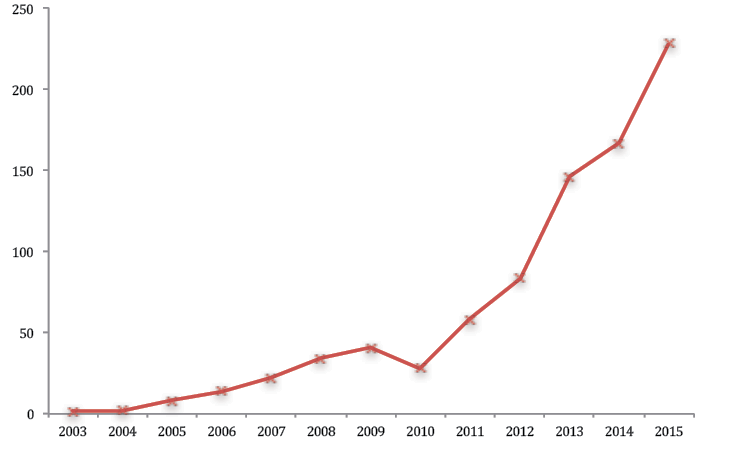
Figure 18.6 China’s direct investment in EEU countries, 2003–15 (US$100 million)
Source: MOFCOM et al. (2016).
Infrastructure: The BRI and ‘5 + 1’ cooperation
The EEU area is a key land-based transport hub connecting East Asia and Europe. Achieving infrastructure interoperability and improving the level of infrastructure in the five member countries will create an economic artery connecting the Eurasian landmass.
Transportation infrastructure construction
China is now the biggest commodity trading country in the world, and 90 per cent of Chinese exports and imports are realised through sea transportation.6 In the case of trade with European countries, about 75 per cent of commodities are transported via ocean shipping.7 Ocean shipping is normally much slower than rail transport, and, in the case of trade between Europe and China, rail transport takes only 50 per cent of the time of transportation by sea,8 with more or less the same transportation costs (Li 2015). It is therefore important for China to use more rail transportation than ocean shipping, which would also benefit European countries.
On 19 March 2011, the Chongqing–Europe International Express Railway was officially opened, which kicks off the operation of China–Europe Express Railways (Figure 18.7). The Chongqing–Europe Railway runs from Chongqing City in China, via Xi’an and Lanzhou, to Alashankou (Alataw Pass) within China. Beyond the Alataw Pass, the railway crosses Kazakhstan, Russia, Belarus and Poland, before arriving in Duisburg in Germany. This line is the southern channel of the Eurasian Land Bridge, which stretches for 11,179 km. The construction of the Chongqing–Europe Railway route is being undertaken jointly by six countries along the line—China, Kazakhstan, Russia, Belarus, Poland and Germany—and it will become one of the main routes of the China–Europe Express Railways system.
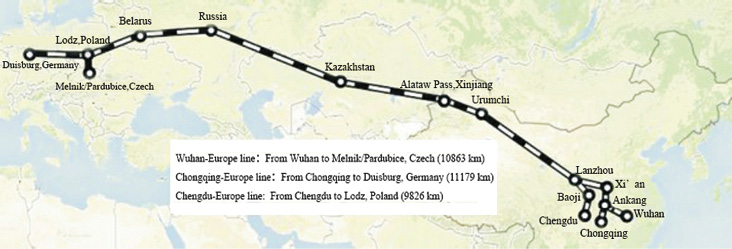
Figure 18.7 China–Europe Express Railways: Chongqing–Europe line, Wuhan–Europe line and Chengdu–Europe line
Source: finance.sina.com.cn/roll/2016-10-18/doc-ifxwvpqh7761641.shtml.
China–Europe Express Railways passes through three EEU countries—Russia, Belarus and Kazakhstan—with trains running from Chinese cities such as Zhengzhou, Wuhan, Chongqing and Chengdu to various European cities. Figure 18.7 shows three of these important lines. According to statistics from the China Railway Corporation, from the successful opening of China–Europe Express Railways in March 2011 until June 2016, 1,881 trains passed through the EEU countries, realising a total of US$17 billion in import and export value during this time (Sina Online 2016). China–Europe Express Railways directly supports the promotion of trade between China and Europe, and it has become an important part of the construction of the Silk Road Economic Belt.
As the main countries of the EEU, Russia, Kazakhstan and Belarus will also be important in building up the Silk Road Economic Belt. The EEU countries have also put forward ideas for building Eurasian transport corridors, including the Far East region development strategy proposed by Russia, the ‘Bright Road’ infrastructure development strategy proposed by Kazakhstan, Kyrgyzstan’s railway construction strategy, along with the BRI, which focuses very much on infrastructure interconnection; all of these therefore have strong complementarity.
Energy infrastructure
At present, although Russia and Central Asian countries are among the big oil and natural gas producers in the world and China is a big oil and natural gas importer, they do not have much of a voice in the energy arena. Western developed countries have placed economic sanctions on Russia over the Ukraine crisis, and China’s oil imports have long been from the ‘turbulent arc’ of the Middle East, which constantly threatens China’s oil security (Figure 18.8). To address this situation, promoting ‘5 + 1’ cooperation through the framework of the Silk Road Economic Belt to facilitate the establishment of an energy community is a viable option, and energy infrastructure construction has become the primary task.
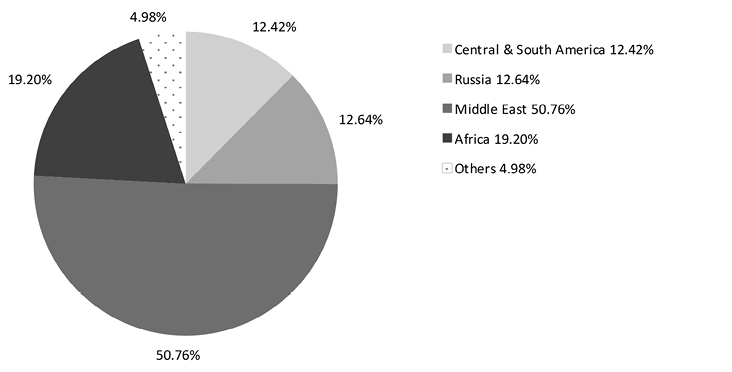
Figure 18.8 Sources of China’s oil imports
Source: BP (2016).
The China–Central Asia gas pipeline starts on the border of Turkmenistan and Uzbekistan, on the right bank of the Amu Darya (Amu River), crosses Central Uzbekistan and southern Kazakhstan and enters China east of Horgos, thus forming the ‘West–East natural gas transmission’ corridor. The natural gas pipeline is about 10,000 km long, with 8,000 km of that inside China, 188 km inside Turkmenistan, 530 km in Uzbekistan and 1,300 km in Kazakhstan. As of December 2016, all three sections of the line—China–Central Asia gas pipeline A, B and C—operated successfully. The D line is being laid, and will be completed in 2020, with a total length of 1,000 km and capacity to deliver 30 billion cu m of gas annually (Table 18.4). Assuming that China consumed 400–420 billion cu m of natural gas in 2010, completion of the D line will meet more than 20 per cent of the country’s domestic demand for natural gas (Ma and Wei 2017). The four China–Central Asia gas pipeline sections will form an artery of gas transport from Central Asia to China.
Table 18.4 China–Central Asia natural gas pipeline construction
|
Line |
Source country |
Pipe length (km) |
Gas delivery per year (billion cu m) |
Start of operations |
|
Line A |
Turkmenistan |
1,830 |
30 |
December 2009 |
|
Line B |
Uzbekistan |
1,830 |
30 |
October 2010 |
|
Line C |
Uzbekistan |
1,830 |
25 |
May 2014 |
|
Line D |
Turkmenistan |
1,000 |
30 |
2020 |
Source: news.cnpc.com.cn/system/2014/09/15/001507242.shtml.
A total of 2,018 km of pipeline lies outside China, 64.42 per cent of which passes through Kazakhstan (an important EEU member), representing almost two-thirds of the total length of China’s overseas pipelines; Turkmenistan and Uzbekistan account for 9.32 per cent and 26.26 per cent of the total, respectively. It is clear that promotion of ‘5 + 1’ energy infrastructure cooperation between China and the EEU is essential to smooth construction of the China–Central Asia natural gas pipeline.
China and Kazakhstan have already worked closely together on energy infrastructure construction. The China–Kazakhstan crude oil pipeline is the first such transnational pipeline and is of strategic significance for both countries, transporting crude oil directly from Kazakhstan to the Chinese consumer market without crossing a third country. The China–Kazakhstan crude oil pipeline begins in Kazakhstan’s western Atyrau District and crosses into China via the Alataw Pass. The first phase of the project was completed in May 2006 and the second phase was put into operation in 2009, and was included in the Twelfth Five-Year Plan’s focus on energy transport construction (State Council of China 2013). In 2015, the pipeline transported 10.8 million tonnes of crude oil to China, the volume having exceeded 10 million tonnes for five consecutive years—for a total of 56.8 million tonnes from 2011 to 2015. From July 2006 to the end of 2015, the pipeline transported 87.2 million tonnes of crude oil to China from Kazakhstan, playing an important role in China’s quest for energy security (China Petroleum News Center 2016).
Promoting policy coordination through ‘5 + 1’ cooperation
We have discussed how to promote the construction of the BRI through ‘5 + 1’ cooperation in terms of trade, investment and infrastructure construction. Establishing an effective cooperation mechanism to coordinate all aspects of the BRI is essential. In light of one of the author’s recent field surveys in Kazakhstan and Kyrgyzstan—two EEU countries—combined with our discussion above, we propose the following important policy coordination to strengthen ‘5 + 1’ cooperation and further promote the BRI.
The first area is funding. We suggest the following actions:
- Encourage Chinese financial institutions to provide finance to the five EEU countries—in particular, to support qualified Chinese private companies to open financial businesses in those countries.
- Establish a number of special funds through policy coordination. China has already set up the Silk Road Fund to support the BRI, but relying solely on state funding will not be enough. At present, China and the EEU countries have large volumes of private capital looking for investment opportunities, so the establishment of special funds would help attract private sector funding.
- Issue special bonds to support important infrastructure projects.
- Consider a special BRI international board on the Chinese stock exchange to raise funds for companies investing in countries along the BRI, particularly the EEU members.
- In recent years, there has been widespread exchange rate instability among the EEU countries. Since the renminbi has been defined as a special drawing rights (SDR) basket currency, meaning it can be used for international settlement and exchange, it is possible to build a financial stability zone based on the renminbi in the BRI and especially in the Silk Road Economic Belt, therefore helping maintain regional financial stability.
A second avenue for deepening cooperation is through investment policy coordination. Through field surveys, we found that the EEU countries have interests in establishing closer investment partnerships with China; Kazakhstan’s demands are particularly apparent. In fact, the Kazakh Government and the Chinese Government have had some good communication relating to investment policy coordination—with, for example, the two countries signing an agreement on investment cooperation for 2016–22. However, some Chinese businesspeople told the authors that it was sometimes difficult to obtain a visa for Kazakhstan even for investment purposes, thus policy coordination in this area will be good for both sides in terms of increasing Chinese investment in Kazakhstan.
A third vehicle via which EEU relations can be deepened is enhanced trade policy coordination. Since China and Russia have signed an agreement to promote ‘5 + 1’ cooperation at the highest levels of leadership, we propose the formation of a ‘5 + 1’ free-trade agreement (FTA) as soon as possible. This would be good not only for promoting the BRI, but also to drive trade prosperity and economic growth for the five EEU countries.
Finally, the ‘5 + 1’ countries could also increase industrial policy coordination. The five EEU countries have industrial advantages in agriculture, energy and minerals, but the manufacturing industry is underdeveloped and industrialisation is lagging behind. Further coordination of industrial policy would directly contribute to the promotion of complementary development between China and these countries in relevant industries, to promote regional economic prosperity.
References
BP (2016), Statistical Review of World Energy, London: BP. Available from: www.bp.com/statisticalreview.
China Petroleum News Center (2016), More than 10 million tons of oil per year transported by China—Kazakhstan pipeline during the past five years Available from: news.cnpc.com.cn/system/2016/01/12/001575462.shtml.
Global Financial Network (2016), Sino–Russian joint statement: The establishment of Eurasian comprehensive partnership, Global Financial Network, 27 June. Available from: www.qqjr.com/quanqiu/zc/2016-06-27/3537.html.
Jin, R. (2016), Speed up to integrate the Belt and Road strategy and the Eurasian Economic Union, Macroeconomic Management 3: 41–3.
Li, G. (2015), Railway cost is the same as ocean shipping: Chongqing–Europe Express Railways becomes the new channel of China–Europe trading, 21st Century Economic Report, 15 May.
Li, J. (2014), Silk Road Economic Belt, Eurasian Economic Union and Sino Russian cooperation, Academic Journal of Russian Studies 5:7-18.
Ma, X. and Wei, M. (2017), Development status and construction progress of the six economic corridors along the Belt and Road, the First Financial Research Institute of China. Available from: mt.sohu.com/20170201/n479757185.shtml.
Ming, H., Zhang, Q. and Xin, Q. (2009), Kazakhstan oil industry overview, International Petroleum Economy 2: 41.
Ministry of Commerce of China (MOFCOM), National Bureau of Statistics of China (NBS) and State Administration of Foreign Exchange of China (2016), China’s Outward Foreign Direct Investment Statistics Bulletin, Beijing: China Statistics Press.
Sina Online (2016), The Belt and Road construction accelerates: China-Europe express railway trains will be about 5000 a year by 2020, , Sina Online, 18 October. Available from: finance.sina.com.cn/roll/2016-10-18/doc-ifxwvpqh7761641.shtml.
State Council of China (2013), State Council on printing and distributing the ‘Twelfth Five-Year Plan’ for Energy Development, No. 2 [2013], State Council of China. Available from: www.gov.cn/zwgk/2013-01/23/content_2318554.htm.
Wang, W., Zhu, M. and Wu, W. (2011), Study on the trade structure and effect of the Russian–Belarus–Kazakhstan Customs Union, Russia, Central Asia and Eastern European Market 12: 29–35.
Wu, J. (2013), Choosing the Growth Model in China, Shanghai: Shanghai Far East Publishing House.
Ye, X. (2016), Chinese and foreign well-known people on the Belt and Road Initiative, People’s Daily Overseas Edition, 19 December: 2. Available from: paper.people.com.cn/rmrbhwb/html/2016-12/19/content_1736845.htm.
Zhang, G. (2016), On the foundation, problems and countermeasures of a free trade zone between China and Eurasian Economic Union, Chinese University Social Sciences 4: 96–107.
Zhao, Y. (2015), Nazarbayev says Kazakhstan’s agricultural development potential is huge, International Online, 5 June. Available from: gb.cri.cn/42071/2015/06/05/8011s4987823.htm.
Zhou, M. (2015), Huge potential for cooperation between the Belt and Road and Eurasian Economic Union, China Economic Weekly 18: 22–4.
Appendix 18.1
Table 18.A1 Basic information about 65 BRI countries, 2015
|
Country code |
Country |
GDP (US$ billion) |
Population (million) |
Land area (million sq km) |
|
1 |
China |
11,007.70 |
1,371.220 |
9.3882 |
|
2 |
Russian Federation |
1,331.21 |
144.097 |
16.3769 |
|
3 |
Mongolia |
11.74 |
2.959 |
1.5536 |
|
4 |
Singapore |
292.74 |
5.535 |
0.0007 |
|
5 |
Brunei Darussalam |
12.93 |
0.423 |
0.0053 |
|
6 |
Thailand |
395.17 |
67.959 |
0.5109 |
|
7 |
Malaysia |
296.28 |
30.331 |
0.3286 |
|
8 |
Indonesia |
861.93 |
257.564 |
1.8116 |
|
9 |
Vietnam |
193.60 |
91.704 |
0.3101 |
|
10 |
Philippines |
292.45 |
100.699 |
0.2982 |
|
11 |
Myanmar |
62.60 |
53.897 |
0.6531 |
|
12 |
Cambodia |
18.05 |
15.578 |
0.1765 |
|
13 |
Laos |
12.37 |
6.802 |
0.2308 |
|
14 |
Timor-Leste |
1.44 |
1.245 |
0.0149 |
|
15 |
Afghanistan |
19.33 |
32.527 |
0.6529 |
|
16 |
Nepal |
21.19 |
28.514 |
0.1434 |
|
17 |
Maldives |
3.44 |
0.409 |
0.0003 |
|
18 |
India |
2,095.40 |
1,311.051 |
2.9732 |
|
19 |
Pakistan |
271.05 |
188.925 |
0.7709 |
|
20 |
Bangladesh |
195.08 |
160.996 |
0.1302 |
|
21 |
Sri Lanka |
82.32 |
20.966 |
0.0627 |
|
22 |
Bhutan |
2.06 |
0.775 |
0.0381 |
|
23 |
Saudi Arabia |
646.00 |
31.540 |
2.1497 |
|
24 |
United Arab Emirates |
370.30 |
9.157 |
0.0836 |
|
25 |
Oman |
69.83 |
4.491 |
0.3095 |
|
26 |
Israel |
299.42 |
8.380 |
0.0216 |
|
27 |
Kuwait |
114.04 |
3.892 |
0.0178 |
|
28 |
Qatar |
164.64 |
2.235 |
0.0116 |
|
29 |
Bahrain |
31.13 |
1.377 |
0.0008 |
|
30 |
Iran |
425.33 |
79.109 |
1.6286 |
|
31 |
Turkey |
717.88 |
78.666 |
0.7696 |
|
32 |
Iraq |
180.07 |
36.423 |
0.4343 |
|
33 |
Jordan |
37.52 |
7.595 |
0.0888 |
|
34 |
Lebanon |
47.08 |
5.851 |
0.0102 |
|
35 |
Egypt |
330.78 |
91.508 |
0.9955 |
|
36 |
Yemen |
37.73 |
26.832 |
0.5280 |
|
37 |
Syria |
n.a. |
18.502 |
0.1836 |
|
38 |
Palestine |
12.68 |
4.422 |
0.0060 |
|
39 |
Belarus |
54.61 |
9.513 |
0.2029 |
|
40 |
Georgia |
13.97 |
3.679 |
0.0695 |
|
41 |
Azerbaijan |
53.05 |
9.651 |
0.0827 |
|
42 |
Ukraine |
90.62 |
45.198 |
0.5793 |
|
43 |
Armenia |
10.53 |
3.018 |
0.0285 |
|
44 |
Moldova |
6.57 |
3.554 |
0.0329 |
|
45 |
Poland |
477.07 |
37.999 |
0.3062 |
|
46 |
Czech Republic |
185.16 |
10.551 |
0.0772 |
|
47 |
Slovakia |
87.26 |
5.424 |
0.0481 |
|
48 |
Hungary |
121.72 |
9.845 |
0.0905 |
|
49 |
Latvia |
27.00 |
1.978 |
0.0622 |
|
50 |
Lithuania |
41.17 |
2.910 |
0.0627 |
|
51 |
Slovenia |
42.77 |
2.064 |
0.0201 |
|
52 |
Estonia |
22.46 |
1.312 |
0.0424 |
|
53 |
Croatia |
48.73 |
4.224 |
0.0560 |
|
54 |
Romania |
177.95 |
19.832 |
0.2300 |
|
55 |
Bulgaria |
50.20 |
7.178 |
0.1086 |
|
56 |
Albania |
11.40 |
2.889 |
0.0274 |
|
57 |
Serbia |
37.16 |
7.098 |
0.0875 |
|
58 |
Macedonia |
10.09 |
2.078 |
0.0252 |
|
59 |
Bosnia and Herzegovina |
16.19 |
3.810 |
0.0512 |
|
60 |
Montenegro |
3.99 |
0.622 |
0.0135 |
|
61 |
Kazakhstan |
184.39 |
17.544 |
2.6997 |
|
62 |
Turkmenistan |
35.85 |
5.374 |
0.4699 |
|
63 |
Uzbekistan |
66.73 |
31.300 |
0.4254 |
|
64 |
Kyrgyzstan |
6.57 |
5.957 |
0.1918 |
|
65 |
Tajikistan |
7.85 |
8.482 |
0.1400 |
Source: World Bank statistical database (data.worldbank.org).
Table 18.A2 Trade connectivity index between EEU member countries, 2001–15
|
Year |
Armenia |
Belarus |
Kazakhstan |
Kyrgyzstan |
Russia |
|
2001 |
19.66 |
67.80 |
26.10 |
24.44 |
32.26 |
|
2002 |
12.64 |
60.07 |
19.24 |
26.43 |
30.19 |
|
2003 |
13.70 |
56.00 |
17.79 |
25.89 |
28.99 |
|
2004 |
9.60 |
49.10 |
15.14 |
27.73 |
26.49 |
|
2005 |
10.08 |
32.62 |
10.24 |
29.18 |
20.26 |
|
2006 |
8.09 |
26.53 |
7.88 |
26.02 |
18.53 |
|
2007 |
9.82 |
22.39 |
6.42 |
20.50 |
17.79 |
|
2008 |
9.64 |
17.33 |
4.92 |
14.28 |
15.71 |
|
2009 |
8.95 |
20.15 |
5.57 |
14.02 |
17.80 |
|
2010 |
8.62 |
24.30 |
3.40 |
15.64 |
17.44 |
|
2011 |
8.02 |
18.90 |
4.61 |
13.45 |
15.40 |
|
2012 |
8.84 |
18.13 |
3.97 |
16.58 |
13.12 |
|
2013 |
10.61 |
23.47 |
3.90 |
13.85 |
12.53 |
|
2014 |
10.76 |
24.68 |
5.00 |
0.00 |
14.06 |
|
2015 |
10.07 |
28.97 |
7.90 |
17.51 |
16.35 |
Note: The trade connectivity index between countries can be as high as 100 and as low as zero, which means there is no trade relationship.
Source: Authors’ calculations based on the trade database of the United Nations Statistical Office (comtrade.un.org/data/).
1 This research is financially supported by the Fundamental Research Funds for the Central Universities and Beijing Normal University’s Interdisciplinary Research Project ‘Paths and Implementation of Promoting the Belt and Road Construction through International Cooperation’.
Previous



