


 menu
A Bark But No Bite
2
The fall and rise of inequality in New Zealand
Discussion of social and economic inequality in political debate is not unique to New Zealand; concerns about inequality have re-entered politics around the world. In many countries, inequality in incomes and wealth has increased. Technological change, globalisation and the conscious policy decisions of government elites are the explanations usually assigned (Pakulski 2005; Wilkinson and Pickett 2009; Piketty 2013). Before turning to the theoretical and empirical dimensions of our study, this chapter outlines the philosophical context, and unpacks the ideas and realities of economic inequality in New Zealand with reference to comparable countries. It also reviews inequalities experienced by women and by Māori, New Zealand’s indigenous population.
Inequality in philosophy and New Zealand politics
The concepts of equality and inequality are complex and contested. It is only since the eighteenth century that the idea that all human beings deserve equal respect and dignity has been widely accepted (Vlastos 1962; Kymlicka 1990: 5). If one accepts equality of respect and therefore dignity, one should also accept equality of opportunity: the idea that everybody should have an equal chance of making their way in the world, and should be able to develop their potential however they wish. Acceptance of equality of respect and opportunity has been delayed until more recently for women and many minority ethnic groups. Arising from these dimensions of the concept, group-based demands for equal rights, equal voice and equal access to political and economic power raise the stakes still further.
Equality is not the same as identity, which is the mathematical sense of equality. Numerically, an ‘equals’ sign means ‘the same as’. Outside mathematics, a judgement of equality presumes a difference between whatever is being compared (Westen 1990). The idea of absolute social and economic equality is therefore self-contradictory: human beings cannot all be the same, living in entirely identical situations. Even in a communist society, Marx (1875) thought that income should be distributed according to people’s needs, which are often different.1 Dealing with inequality is about dealing with differences that are acknowledged, justified on grounds of fairness and rationality, and treated with respect. The existence of difference, including entrenched inequalities, may mean that the pursuit of greater social equality may require treating some groups of people more favourably than others, if only on a temporary basis.
Our main focus in this book is on economic inequality. On the economic dimension, there are obvious differences between income and wealth inequality. Wealth is a result of the accumulation of previous income, some of which may be inherited within a family. It forms a ‘stock’ of assets that may be used to generate day-to-day income by way of interest, rents or dividends from stocks and shares. Income is a ‘flow’. Most people’s income derives from a wage or a salary. Those on higher incomes may be able to save, and thus accumulate assets and wealth. Those on lower incomes find it more difficult, and may need to have their incomes supplemented by the state. In our analysis of inequality in New Zealand, we distinguish between income and wealth, the latter in the form of asset ownership.
Most economists used to argue that greater inequality leads to a wealthier society. In his influential theory of justice, John Rawls (1971) argues that economic inequality can be justified if the benefits of increasing wealth make the poor better off than they would have been had society remained equal and wealth not increased. After 30 years’ experience of policies based on that assumption, it is now sharply contested, even among economists (IMF 2014; Ostry et al. 2014). Within many countries, increased wealth has gone to the wealthy. The poor and even the not-so-poor are doing worse, or just holding on (Milanovic 2016). Too high a level of inequality in outcomes inevitably harms social mobility and equality of opportunity. Some try to minimise the importance of seeking more equality in outcomes while endorsing equality of opportunity. But where outcomes are greatly unequal, there can be little or no equality of opportunity.
Inequality in New Zealand politics
Consistent with John Rawls’ ideas, Tony Blair and ‘New Labour’ in Britain argued that increased inequality that helps generate wealth can be welcomed as long as the rich pay their taxes and the poor get an appreciable share (Mandelson, quoted in Brown 2012; Blair, quoted in Lansley 2006: 24). Even earlier, when the New Zealand Labour Party reviewed its principles in the late 1970s, it also seemed to adopt this interpretation of Rawlsian philosophy (Vowles 1987). As Labour prime minister David Lange put it in 1986, ‘social democrats must accept the existence of economic inequality because it is the engine that drives the economy’ (Lange 1986).
Lange’s statement was a departure from a long tradition. From its beginnings as an outpost of the British Empire, New Zealand has had an egalitarian tradition, shared in part by its neighbour, Australia. New Zealand was a leader in the achievement of full representative democracy, giving voting rights to Māori as early as 1867, and to women in 1893. Late nineteenth- and early twentieth-century reforms pursued in New Zealand and Australia were underpinned by a rich tradition of egalitarian liberal ideas that overlapped with the principles of the emerging Labour movement. This combination produced a brand of politics whereby moderate Labour activists and unionists aligned themselves with the governing Liberal Party. Together they pioneered a set of policies that reflected early colonial values of equal opportunity for all and the desire for social, moral and racial harmony (Belich 2001: 853; Sawer 2003; Sinclair 1967). The early Liberals imagined themselves as able to represent labour, farmers and entrepreneurs, prompting legislative change on four fronts: land, labour, welfare and women’s rights (Belich 2001: 22–23, 42–44; Curtin 2015; Lyon 1982; Vowles 1982).
After the Liberals fell from power in 1912, the egalitarian torch was taken up by the Labour Party; established in 1916 with a leadership of socialists and former syndicalists. Labour’s radical aspirations moderated rapidly during the 1920s. In office from 1935 until 1949, the First Labour Government established one of the world’s first welfare states. Labour’s Social Security Act 1938 was underpinned by the principle that every New Zealander had a right to a reasonable standard of living, and that this was best ensured through universal welfare benefits. Universalism eliminated the humiliation of receiving charity and brought together the needy and the middle classes into a ‘new welfare society’ (Belich 2001: 262). The increased wages and salaries of low- and middle-income earners benefited businesses and manufacturing, as did improved pensions. This collective response was viewed as enabling individual advancement, and reinforcing traditional and popular understandings of equality of opportunity and respect in New Zealand. Over the next 40 years, governments did little to modify the relevant policy settings, reinforcing the notion that sharing wealth and prosperity across society was desirable (Chapman 1981).
Equality of respect and equality of opportunity were strongly held values among the European settlers who arrived in New Zealand and Australia in the nineteenth century. Many were ‘aspirational’, seeking to improve their lives and those of their families. But faced with successive recessions as the new colonies struggled to find overseas markets and products to sell in them, a concern for security emerged early. The isolation and small size of the Australasian colonies also meant that the state took on more economic responsibilities than in most other countries. People adopted a ‘utilitarian’ attitude that the state could and would provide any necessary collective goods; in particular, pensions and aid for the poor (Gascoigne 2002). As American scholar Leslie Lipson wrote in the 1940s, if any sculptured allegory were to be placed at the approaches of a major New Zealand harbour, it would not be a statue of liberty but instead a statue of equality (Lipson 1948: 8). Lipson identified in New Zealanders a hatred of privilege, passion for social justice and a desire to eradicate poverty. Notions of egalitarianism in New Zealand were not about the absence of class but the absence of extreme class distinction, class oppression and conflict, and elite rule. While much has changed since the late 1940s, it is still argued that the related theme of fairness remains part of the values many people associate with being a New Zealander (Hackett-Fischer 2012).
Inequality realities: Economic and social
For our purposes, the relevant dimensions of inequality are equality of respect, equality of opportunity and the reduction of differences in outcomes that make equality of opportunity difficult if not impossible to achieve. Equality of respect matters because it is challenged by discourses implying that many seeking social assistance are ‘undeserving’. It is a moral judgement that weakens if not denies people’s equal rights as human beings, and is often made without any direct knowledge of their circumstances. In practice, the three dimensions of inequality we discuss are inter-related, and extend into gender and ethnic differences as well as those between classes or groups defined by their income or wealth. Of these dimensions, economic inequality as measured in incomes and wealth is usually the most significant.
Traditionally, the reduction of income inequality has taken place through progressive taxation, tax credits for the working poor, universal services and income transfers to categories of people, which may take universal form in the case of pensions or targeted payments to those in particular need, such as the unemployed or disabled. Taxes on wealth or capital have also been used, but much less so now than in the past. Two related goals of redistributive social policies are often identified: the first to generally promote equality of opportunity, such as in the provision of state education; and the second to protect against risk in the form of unemployment benefits, universal health services and income support for those who find themselves in bad circumstances through no fault of their own.
Despite their turn to the market in the 1980s, most countries with advanced capitalist economies continue to redistribute income by progressive tax systems, albeit less progressive than in the past. Most countries continue to provide benefits or transfers to designated groups, most, but not all, because they are in need by way of inadequate market incomes. There remains significant variation in the extent to which various countries redistribute incomes.
Figure 2.1 provides a bar chart that displays three indicators of income inequality across nine countries in 2008, the year immediately before the main effects of the global financial crisis (GFC) took hold. The Gini index is a summary measure of income inequality. In a country scoring 0 on this index, all incomes would be equal. A score of 100 would indicate that all income would be concentrated among a very small elite. In the black bar for each country, the net disposable income Gini index summarises the income distribution after taxes have been taken off and benefits added to people’s incomes. The countries are ordered based on this index from the most equal on the left to the least equal on the right. In this data, the most equal country in the figure is Denmark, which scores 24.2. The most unequal is the United States, scoring 37.8. The grey bar for each country, the next in line, indicates the market Gini index: the income distribution before taxes and benefits. The third bar for each country shows a country’s level of redistribution through taxes and benefits: it reflects the main role that government plays in promoting greater equality. It is calculated as the difference between the market and net Gini figures, divided by the market Gini, multiplied by 100 to produce a percentage.
Figure 2.1 reveals that New Zealand was ranked quite closely with Canada and Australia on the three measures, with the net disposable income Gini index of New Zealand being 33, Canada 32 and Australia 34. Market inequalities are in a similar range, with New Zealand at 45.5, and Australia and Canada respectively scoring 46.8 and 43.8. On the redistribution measure, New Zealand scores in between Canada and Australia with a score of 27.5. Australia redistributes a little more, at 28.2; Canada a little less at 26.7.2
Other countries stand out for various reasons. The UK has the highest level of market inequality, but its net Gini disposable income index is only just above the other three ‘British world’ countries to its left (Australia, New Zealand and Canada). The United States has a very high level of market inequality, and the lowest level of redistribution. Its net Gini index is the highest of all Organisation for Economic Co-operation and Development (OECD) countries included in Figure 2.1. Levels of redistribution are highest in the four continental European countries. Greater redistribution is primarily responsible for their lower levels of net inequality.
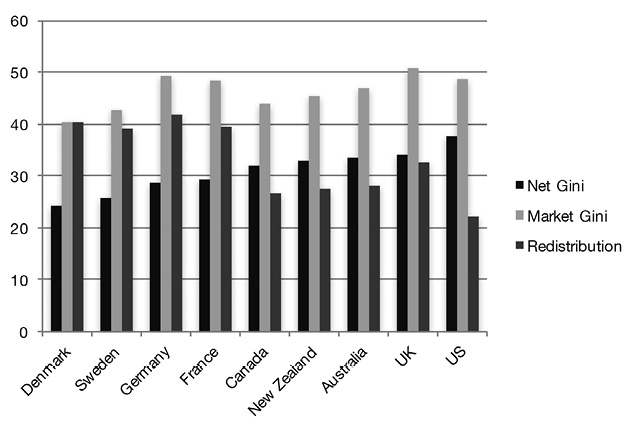
Figure 2.1: Net disposable income Gini, market Gini and difference between net and market Gini (redistribution) in nine countries, 2008
Source: OECD 2016.
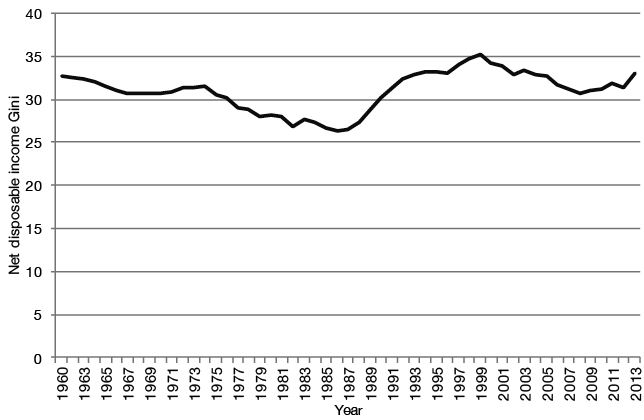
Figure 2.2: The net Gini index for New Zealand, 1960–2013
Sources: SWIID 2016; OECD 2016; Perry 2014.
Figure 2.2 shows the net disposable income Gini index in New Zealand, tracked back to 1960. The early data are less robust than later data, and thus need to be treated with caution (Easton 2013; Perry 2014). Because most data series tend to start in the 1980s, people have tended to assume that New Zealand was a more equal country in the 1950s and 1960s than it actually was. Contrary to what many people believe, New Zealand’s income equality in that period was probably no better than in other Western democracies. If the Standardized World Income Inequality Database (SWIID 2016) estimates are correct, income inequality in New Zealand was about the same in the early 1960s as in 2014.3 Ironically, given the policy traditions associated with New Zealand’s major parties, the drop to the lowest level of income inequality took place under the National Government of Robert Muldoon (1975–1984), and the steepest increase took place under Labour (1984–1990).
If there was a strong perception of egalitarianism in the 1950s and 1960s, perhaps it is more to do with what may have underpinned an observation that Keith Sinclair made in his A History of New Zealand (1959: 276): ‘New Zealand must be more nearly classless, however, than any other society in the world. Some people are richer than others, but wealth carries no great prestige and no prerogative of leadership’. Many might now doubt that the last part of Sinclair’s statement applied in New Zealand under John Key’s leadership, with a multimillionaire prime minister and a ‘celebrity culture’ prevalent throughout the various communications media. However, as we will explore in greater depth in Chapter 5, much of John Key’s popularity was based on an ‘ordinary bloke’ image.
How one sees these numbers will depend on one’s values and preferences. On the one hand, one can claim that current levels of inequality are nothing new or unusual. On the other hand, one can argue that New Zealand is a richer and more prosperous country than in the early 1960s. The benefits of that growth appear to be have been mostly taken by those on higher incomes.
Policy paths to inequality
The narrative of New Zealand’s path to a less egalitarian society identifies the key events as the election of the Fourth Labour Government in 1984 and the subsequent economic and social policy reforms given the name ‘Rogernomics’—named for their principal architect, Labour minister of finance Roger Douglas. These developments were underpinned by a combination of technological change and global influences, and shaped by public policy. Britain’s accession to the European Economic Community (now the European Union) brought an end to New Zealand’s neo-colonial position as Britain’s outlying farm. The need to sell New Zealand’s exports elsewhere in a context of high levels of protectionism in those markets meant that New Zealand had to become more economically competitive to survive. Large increases in the price of oil between 1974 and the late 1980s added to the pressure for change, contributing to historically low terms of trade—the balance between the prices of New Zealand exports and imports (Rankin 2014). The demise of wool as a major export earner in the 1960s compounded the problems. Economic reforms were necessary, if not overdue. However, many actors could see opportunities for their personal or collective enrichment, and were able to capture much of the necessary process of reform for their own benefit, justifying their actions with an ideology of extreme market-led individualism.
Public policy played a major role in spreading out the income structure. The biggest increase in inequality was the result of widening market incomes, but tax and benefit changes also played a major role (Aziz et al. 2012). A flat income tax system was avoided only by Labour prime minister David Lange (1984–1989), who single-handedly vetoed the change in defiance of constitutional convention, breaking his alliance with Roger Douglas and throwing the government into the disunity that led it its defeat in 1990. New Zealand did move to a flatter but not entirely flat system of income tax.
Most systems of income tax are progressive or graduated into steps. The lowest step is taxed at the lowest rate, reflecting the low incomes of those who fall below it. The steps above are taxed at progressively higher rates, reflecting the greater ability of those on high incomes to pay more; however, they only pay the higher rate for their income above each step. Tax rates above these steps are therefore described as ‘marginal’ tax rates. Figure 2.3 summarises the changes that took place in the top marginal income tax rate and corporate tax. It also shows the introduction of the goods and services tax (GST) under Labour in the 1980s, and further changes since. The top marginal rate of income tax has been reduced, as well as the number of steps—now currently at four. The rate of tax a person pays overall is based on the accumulation of the marginal rates applied up to their income level. As to be expected, those on the highest incomes have done best out of these tax changes. For those on and above the highest marginal rate, the average rate of tax was just under 49 per cent in 1983–84. In 2014, it was 28.5 per cent (Rankin 2014). Corporate tax also came down and the value-added GST was introduced at 10 per cent, increasing to 12.5 and later 15 per cent. As an expenditure tax, the GST is ‘regressive’; that is, people on low incomes tend to pay more GST as a proportion of their incomes than people on higher incomes who have more cash to save or invest.
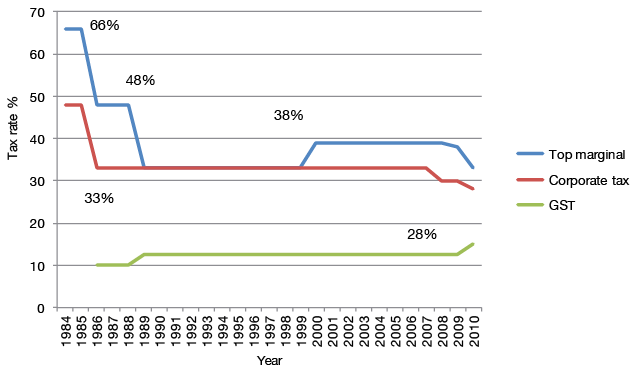
Figure 2.3: Tax changes, 1984–2010
Note: GST=goods and services tax.
Source: Rankin 2014.
In tandem with the 1980s changes in income tax, other advantages for those on higher incomes and to companies were reduced. Many tax loopholes for businesses and high-income individuals were abolished and a fringe benefits tax introduced. Welfare benefits for family and child support became more closely targeted, as was housing provision for those on low incomes. New Zealand Superannuation, established by the Muldoon National Government, remained as a universal pension after strong opposition emerged to means-testing by way of a high-income surcharge applied for two years before being dropped. But the age of eligibility was shifted from 60 to 65 during the 1990s. Targeting of social assistance required closer integration of the tax and benefit systems. In 2005, the Labour-led government introduced the Working for Families package that consolidated and expanded previous provisions for low- and middle-income family support. Fully available only to those in the labour market, it is one of the reasons why income inequality in New Zealand has not significantly increased since the mid-1990s, despite the GFC (Perry 2014: 92).
Tax and benefits are not the only means by which inequality may be addressed. New Zealand continues to provide public services that are state-funded and universally available to all citizens and permanent residents, most notably in the domains of health and education. Medical care is not immediately free at the point of access, although fees are subsidised for those on low incomes and for children. Care in public hospitals is free, although often subject to waiting lists unless the need for treatment is urgent. Injuries from personal accidents are covered by a unique Accident Compensation scheme funded by levies from employers and employees and run by a government-owned corporation. Primary and secondary education are theoretically free, but in practice schools solicit donations and parents face pressure to contribute. The state continues to fund about 70 per cent of the effective fees for tertiary education and operates a student loan scheme for which no interest is liable while studying, so long as graduates subsequently remain in New Zealand.
These universal services are often criticised as open to capture by those on higher incomes, but the potential market costs of those services would fall most heavily on those on low incomes. Universally available public services provide a counterweight to the regressive nature of the GST. Because they are more valuable for those on low incomes, they offset the GST’s otherwise regressive effects (Aziz et al. 2012: 36). As will be shown in subsequent chapters, the universal nature of these services means they retain high levels of public support for government funding. The same applies to New Zealand Superannuation, also available universally. However, public support for benefits to those on low incomes and those not in work is much lower and has decreased over time (Humpage 2015).
The interaction of the tax and transfer systems means that when transfers are offset against income tax liabilities, the bottom 40 per cent of households pay no net income tax, receiving more from government than they pay for. A paper authored by Treasury economists adds in the effects of the GST and the use of health and education services across income groups, calculating ‘final income’ on that basis. It indicates that in 2010 it was only people in the top four income deciles who paid more for government services and benefits that they received from them (Aziz et al. 2012). While this data does not include the effects of the rise in the GST to 15 per cent, it confirms that the New Zealand state continues to redistribute income quite significantly, although as noted above not as generously as do many European governments.
Market incomes and pre-distribution
Increased inequality in market incomes was the main source of the increase in disposable income inequality in New Zealand in the 1980s and 1990. Immediately prior to the public policy changes of the 1980s, New Zealand had one of the most highly regulated economies in the western world. Attempting to cope with a cascade of economic problems, the government was directly controlling wages, prices and interest rates. The farming industry was highly subsidised, international capital movements restricted and imports were subject to a wide range of controls and tariffs. The market revolution in the second half of the 1980s swept most of this away.
The Fourth Labour Government began the process of economic and financial deregulation. National continued it in the early 1990s with additional reforms to social policy provision. It delegated the day-to-day control of monetary policy and the responsibility for setting interest rates to the Reserve Bank. It maintained inflation within a range defined by government as the only objective, leaving out growth and, most significantly, unemployment, from the objectives (Nagel 1998).
A remaining element of the regulatory toolkit is the minimum wage. In 1946, the minimum wage was as high as 83 per cent of the average ordinary time weekly earnings, although in terms of real incomes wage rates at that time were significantly lower than they are today. By the early 1980s, the minimum wage had fallen to 30 per cent of that average. The Fourth Labour Government (1984–1990) left office at the beginning of the 1990s, having raised the minimum wage to 50 per cent of average weekly earnings, but it fell again during the 1990s to a low of 42 per cent (Hyman 2002). In 2014, the minimum wage stood at 49 per cent of ordinary time weekly earnings, and was raised marginally further to 52 per cent after a review (MBIE 2014). While the minimum wage was being paid to only 2.7 per cent of employees in 2014, it acts as a floor above which other wages may rise and is, of course, paid to the poorest and most vulnerable employees.
A campaign for a minimum wage was also a feature of the 2014 election. The Labour Party campaigned to raise the minimum wage to 56 per cent of average earnings. Relative to wages and salaries, New Zealand’s minimum wage is one of the highest in the world, but this reflects New Zealand’s relatively low wage and salary structure. But it is unlikely that a significant increase in the minimum wage could greatly affect inequality in New Zealand, particularly as some of its effect would be absorbed by a lower uptake of tax credits and targeted benefits.
The rise in inequality in advanced capitalist democracies has been accompanied by a decline in the influence of trade unions and their decreasing membership. Trade unions provide a countervailing power to employers in the labour market. Strong trade unions usually generate higher wages than would be the case in their absence for members and non-members alike, at least for those in the same industry or workplace.
The position of trade unions in New Zealand society has been transformed over the past half century. At the turn of the twentieth century, trade unions were in the vanguard of the campaign for a more equal society, and the most effective instrument for achieving that goal within the broader framework of New Zealand liberalism (Belich 2001: 853; Sawer 2003; Sinclair 1967). The main vehicle for this accomplishment was the Industrial Conciliation and Arbitration Act 1894. It gave legal recognition to trade unions that wished to register, and established a system of compulsory arbitration for those unions, with appeals to an Arbitration Court. Strikes against Arbitration Court decisions were not permitted. For this reason, stronger socialist or syndicalist-led unions such as the Miners and Watersiders remained outside the system in its early years and sought their economic and political goals through strike actions that were ultimately unsuccessful.
As it developed, the Arbitration Court came to regulate the minimum wage and make binding wage awards across industries. A similar system developed in Australia and, under this form of state regulation, levels of union membership in Australia and New Zealand were among the highest in the world in the early twentieth century (Castles 1985). High levels of union membership in New Zealand were further underpinned by the First Labour Government that legislated for compulsory union membership and a 40-hour working week in 1936.
Consensus around the Arbitration system began to break down in the 1970s as economic pressures began to mount. Some employers wanted an end to compulsory unionism and the stronger unions wanted to engage in free collective bargaining. The Muldoon-led National Government legislated for voluntary unionism in 1983, but this was overturned by the following Labour Government, led by David Lange. Despite its zeal in pursuing market-led reform, beyond marginal changes to improve the efficiency of collective bargaining, the government did not extend the process into the labour market.
National’s Employment Contracts Act 1991 opened a new chapter in New Zealand’s industrial relations. Compulsory unionism was abolished and unions no longer had a legal status other than of voluntary associations. The Act provided no duty on the part of employers to bargain and no responsibility to do so in good faith. The Employment Court did have the power to act if employment contracts were deemed to be ‘harsh or oppressive’. Provisions in the Act were designed to push employment contracts to a workplace rather than across multiple employers in an industry, and encourage individual rather than collective employment agreements (Hince and Vranken 1991). Not without reason, the Act was described as ‘an Employers’ Charter’ (Anderson 1991).
In office once more from 1999, Labour sought to redress the balance through the passage of the Employment Relations Act 2000. The Act reinstated recognition of trade unions and removed the most obvious hindrances in the way of collective bargaining and later re-established a ‘good faith’ provision. Once re-elected in 2008, National again began to shift the balance back toward employers. The government enacted a 90-day trial period whereby employers could dismiss newly hired workers without reason. Prior to the 2014 election, the National Government was seeking to water down the good faith provision by no longer requiring a collective agreement to be reached. As we shall see, National’s position on workers’ rights appeared to do little harm to its campaign efforts.
Figure 2.4 indicates the decline in union membership since the passage of the Employment Contracts Act. Since 2000, union membership as a proportion of wage and salary earners has remained relatively stable. Under the Labour-led government of 1999 to 2008, union membership rose in tandem with growth in the labour force. Since 2008, with National in power, the trend has become choppier, ending with two falls in 2013 and 2014 that may or may not be precursors to further long-term decline. Weak unions in a context of reduced rights to collective bargaining and grievance procedures are almost certainly associated with lower wages than would otherwise be the case (for US evidence of the effects of union decline see Jacobs and Myers 2014).
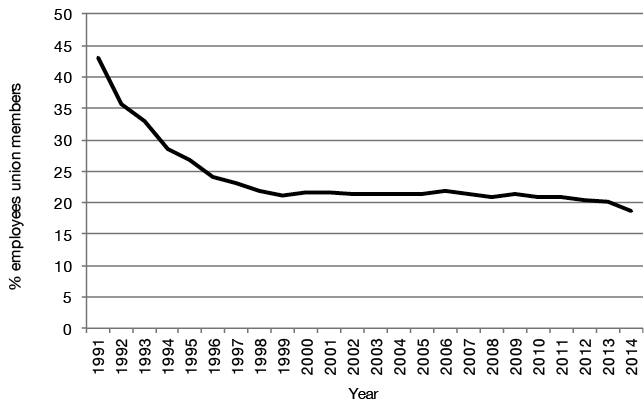
Figure 2.4: Union membership in New Zealand (percentage of wage and salary earners)
Sources: May, Walsh and Otto 2003; New Zealand Companies Office 2006, 2009, 2014.
Wealth inequality
While most of the inequality debate worldwide has been about income, wealth is arguably more important than income because it is associated with the entrenchment of inequality across generations. Short-term wealth inequality is associated with life-cycle, with most people acquiring more wealth and assets as they grow older. But wealth is often transmitted from generation to generation. Table 2.1 presents data about the distribution of income and wealth in Australia and New Zealand.
As can be seen from Table 2.1, the ratio of household wealth from the top to the bottom is ‘off the scale’, in that the bottom quintile of wealth holders in New Zealand apparently have no significant wealth to hold. The top quintile of wealth holders, by contrast, own 59 per cent of wealth. In Australia, the bottom quintile owns 1 per cent whereas the top quintile holds 61 per cent. When looking at the distribution of income, Table 2.1 reveals that in both Australia and New Zealand, the bottom quintile of income holders owns 8 per cent of the income, whereas the top quintile holds 40.
Table 2.1: Percentage shares of income and wealth by respective quintiles
|
Q1 (low) |
Q2 |
Q3 |
Q4 |
Q5 (high) |
Share ratio, Q5:Q1 |
||
|
% Household income |
Australia |
8 |
13 |
17 |
23 |
40 |
5 |
|
NZ |
8 |
13 |
17 |
23 |
40 |
5 |
|
|
% Household wealth |
Australia |
1 |
5 |
12 |
21 |
61 |
61 |
|
NZ |
0 |
5 |
12 |
24 |
59 |
||
Note: Because the wealth share of the bottom quintile in New Zealand is not statistically distinguishable from zero, no share ratio can be calculated.
Source: Perry 2015: 6.
Some earlier New Zealand wealth data comes from 2004–05. It indicated that the top 10 per cent of wealth holders then had about 50 per cent of the total wealth, making for a ‘Wealth Gini’ of 69, double that of income. In terms of international comparisons, New Zealand and Australia lie in the middle of the OECD countries for which data is available. Wealth in New Zealand is more concentrated than in the UK, where 45 per cent of the total wealth is held by the top 10 per cent. The United States has the highest wealth concentration: 71 per cent of the total wealth is held by the top 10 per cent (Perry 2015: 181).
Many will be surprised that wealth inequality is higher in New Zealand than in the UK, as the UK is often believed to be a society with a much more entrenched economic and social elite. Unlike the UK, New Zealand lacks taxes on wealth, either by way of death duties or capital gains. One of the main sources of wealth in New Zealand is the appreciation of the value of land for housing and agriculture that can be captured by those lucky or prescient enough to own such land in the right place and at the right time. In the decade of 1910–20, land tax made up 15 per cent of New Zealand’s tax revenues. Land and property tax no longer exists in New Zealand, except to fund local and regional government in the form of rates. There have been proposals to reintroduce a more comprehensive and effective land tax in recent tax reviews, but governments have had little taste for the idea. A land tax would keep land prices lower over the longer-term as land would become a less attractive form of investment.
Estate and death duties also contributed to government tax revenues and helped to reduce wealth inequality under the Liberals in the early twentieth century. Over subsequent decades, under National Party governments, death duties became progressively lower in real terms and became increasingly subject to high levels of avoidance, and were finally abolished in 1993. A final residue of gift duties was removed in 2011 (Littlewood 2012; McAlister et al. 2012). Only one way remains in which wealth and assets may be prevented from being passed from the old to the younger generations of a family: where old people require intensive care in a retirement home, their assets are tested and used to fund the cost until exhausted. This taxing of assets is based on luck rather than fairness.
Differences in wealth have become more apparent in New Zealand because of increasing house prices, making it increasingly difficult for younger people on modest incomes to buy their own homes. Instead, favourable tax treatment for investors has led to increased demand for residential property to rent, one of the drivers of increasing prices. The absence of a capital gains tax in New Zealand and the ability to offset expenses and losses against other income makes owning rental property very attractive to New Zealanders who can afford to enter this market. High levels of immigration and a shortfall in housing construction further put pressure on prices, particularly in Auckland, New Zealand’s largest city. Added to the poor quality of much rental accommodation, concern about housing underpinned much of the inequality debate in 2014. As we shall discuss in Chapter 5, Labour and the Greens both promised a capital gains tax if they were to form a government.
Women’s equality
Paying attention to gender introduces further dimensions to an analysis of equality. Equality of respect and opportunity took longer to establish for women than men. Because of discrimination limiting their political and social rights, women have demanded equality of voice and equal rights to live their lives freely, extending the coverage and vocabulary of the concept. Equality of voice implies voting rights, rights to stand for national office and efforts to secure more proportionate representation between women and men in positions of power in government and in other institutions, both public and private. Equality of rights means freedom from discrimination, protection from male domination and, for many, women’s right to control their own bodies, including the choice to abort an unwanted foetus. Of course, inequality for women also has an economic dimension. Most data on income and wealth inequality are collected on a household basis. In terms of personal income and wealth, and within households, gender inequality is also well documented and well known, and a significant gender pay gap persists.
New Zealand was home to one of the world’s earliest and most successful feminist movements, and achieved female suffrage under the Liberal Government in 1893. Feminism has a strong presence in New Zealand. Feminists have been most active within the Labour and Green Parties. The Green Party ensures equal male and female representation among its MPs. Labour has failed to reach that target and there are divisive debates within the party about the priority and means of securing that goal. Some see pressing for more women in parliament as a distraction from Labour’s primary purposes of pressing for equality across all dimensions—an excessive focus on ‘identity politics’.
Post-suffrage, various women’s organisations took up concerns about the status of women. Franchise Leagues morphed into Women’s Political Leagues and the National Council of Women was established. Members and leaders of these organisations used their influence to lobby parliamentarians. Prime minister Seddon attributed many of the reforms initiated by his Liberal Government to the pressure brought to bear on his government by women. In 1928, the President of the National Council of Women listed 44 pieces of legislation on which she claimed the organised effort of women had had a decisive influence (Page 1996).
The Family Allowance Act 1926 instituted a means-tested benefit that was applied for by the breadwinning husband but paid to the wife. The measure had wide political support and it helped to unravel the sole focus on the man in New Zealand’s family wage breadwinner model (Nolan 2000: 139–41). The family allowance might not have promoted women’s wage work, or equal pay as workers, but it gave many women for the first time an income and a taste of economic independence. In 1946, the First Labour Government removed the means test, paying to all mothers a fixed amount per child, initially under the age of 16, and eventually under the age of 18 (Nolan 2000). In 1985, the Fourth Labour Government moved family income support back into the means-tested targeted model and, despite considerable resistance from women, the fixed family benefit was abolished by National in 1991 (Curtin and Sawer 1996).
The principle of equal pay for women was finally recognised in legislation in 1960; first applied to the public sector, and extended to the private sector in 1972. Equality for women moved back into a more prominent position in the 1970s in the context of the ‘second wave’ of feminism. Feminists demanded social policy reforms around childcare, health and reproductive rights, and sexual violence, and Labour Party feminists were influential in ensuring the descriptive and substantive representation of women became a priority for the party (Curtin 2008).
By the 1980s, feminism in New Zealand had three main strands: an ‘equal rights’ agenda that focused on remaining forms of discrimination; a political agenda to increase the representation of women in politics; and an economic agenda that began with the traditional issue of equal pay with a stronger underlying objective of greater economic independence. Meanwhile, more women were moving into the labour market, and New Zealand trade unions were becoming more responsive to the interests of women workers.
More effective promotion of human rights in New Zealand began with the formation of the Human Rights Commission in 1977 under a National Government. In the 1980s, the Labour Government established a Ministry for Women’s Affairs (now the Ministry for Women). Common Law understandings of rights were given statutory recognition and extended to gender in the Human Rights Act 1990, and further developed in the Human Rights Act 1993. The Equal Pay Act was not legally understood to apply to equal pay for different work of equal value across different industries. In 1990, a Labour Government passed the Employment Equity Act to legislate for that principle. It was repealed by the National Party when it returned to office in that same year. But in response to union sponsored court action, a Court of Appeal decision in 2015 reinterpreted the Equal Pay Act as applicable to ‘different work of equal value’.
Under the Fifth Labour Government (1999–2008), women’s economic independence became a central platform. With this came an explicit recognition by Labour that women were permanent labour market participants, and that economic conditions often required them to work, and many were choosing to work. The government also recognised that the market alone was unable to sufficiently support working mothers. The boosting of child care support, paid parental leave, benefits for working families and welfare to work policies were core parts of Labour’s agenda (Curtin 2015; Curtin and Devere 2006). The current National Government has recognised the importance of women’s labour market participation by extending paid parental leave and retaining benefits for working families. It has been less generous with sole parents who are primarily women, targeting them explicitly in their 2011 campaign for re-election (Curtin 2014).
In the most recent World Economic Forum global gender gap index, New Zealand scored 10th overall (with Australia 36th). But New Zealand ranks 30th for ‘economic participation and opportunity’, much closer to Australia’s ranking of 32nd. The lower overall ranking of Australia is largely due to women’s ‘political empowerment’, where Australia stands at 61st and New Zealand at 15th (World Economic Forum 2015). In 2014, the New Zealand Ministry for Women reported that the gender pay gap stood at 9.9 per cent. In 2015, the gap had increased slightly to 11.8 per cent (Ministry for Women 2016). Over the long term, the trend is positive as the gap was 16.3 per cent in 1998. Women still remain significantly under-represented in the highest-paid professions and over-represented among those on low wages. There are few women chief executives in either the public or private sectors. Women remain under-represented in parliament and the executive. On the same assumptions we apply to economic groups, women should be more likely to vote for the left or centre-left. In Chapter 4 and Chapter 9 we test this expectation, and in the latter chapter broaden the discussion to other gender questions.
Māori, indigenous rights, the treaty and equality
There are many parallels between arguments for ethnic minority rights and those for women. Equality of respect directly challenges racist attitudes to which such minorities are often vulnerable. Equality of voice demands political representation, and equality of rights demands equal treatment that may sometimes require taking account of differences by targeting affirmative action policies toward ethnic groups. Questions of equality and inequality can be particularly challenging when they concern differences between ethnic groups, particularly where an ethnic group claims indigenous status.
In discussions prior to the signing of the Treaty of Waitangi on 6 February 1840 by representatives of the British Crown and various Māori chiefs, there was agreement that Britain could set up a government over the increasing numbers of new settlers arriving in the country. The Māori text of the Treaty, now accepted as the most authoritative version, did assign ‘complete government forever’ to the British Crown in Article One, but also guaranteed that Māori chiefs would retain their existing authority in Article Two (Kawharu 1989).4 This left ambiguous the authority that the government would have over Māori. The British Crown went on to declare sovereignty over New Zealand on the basis of an English translation of the Treaty. In Article Two, the Treaty also promised that the British Crown would protect Māori, their property and valued possessions. Article Three promised that Māori would have the rights of British subjects (Orange 2011). Article Three can therefore be interpreted as an equality principle.
The promises made in Articles Two and Three of the Treaty were soon ignored, and disputes between land-hungry settlers, the colonial government and Māori tribes led to war, most intensely in the 1860s. Māori lost land in a combination of confiscation, conflict among themselves, fraud and sales. With little resistance to imported disease, and demoralised by defeat, the Māori population dropped to a low point at the turn of the twentieth century, and then began to recover. Recognition of injustices began to emerge under the Liberals in the beginning of the twentieth century. But pressure on Māori to sell land and attempts to suppress Māori language and culture on assumptions of racial ‘assimilation’ continued well into the late twentieth century. In the 1930s, the First Labour Government moved to begin to honour Article Three of the Treaty by removing discriminatory provisions that prevented Māori from accessing welfare benefits. Māori subsequently benefited from the formation of the New Zealand welfare state and the expansion of state housing for those on low incomes, cementing a tradition of Māori support for Labour that has continued, albeit with recent interruptions.
A new generation of urban Māori spearheaded a Māori cultural and political renaissance in the 1970s, beginning with renewed protests about land alienation. Responding to this pressure, the Third Labour Government (1972–1975) set up the Waitangi Tribunal to address current disputes about Treaty issues. In 1985, the Fourth Labour Government gave the Waitangi Tribunal the power to review past actions back to the signing of the Treaty, and inserted compliance with the principles of the Treaty into some legislation. Waitangi Tribunal decisions are recommendations only, but governments are obliged to address them by subsequent negotiation. Over the years, significant resources have flowed to Māori iwi (tribes) as the result of the recognition of the previous failures of past governments to meet their Treaty obligations to protect Māori. A new ‘Māori economy’ has developed, spreading more income and wealth toward Māori than in the past, but also increasing inequality between Māori. Māori retain a hierarchical culture in which status and birth count for more than among European or Pākehā New Zealanders (Metge 1967). More to the point, Treaty of Waitangi settlements are made with iwi, but many Māori in urban areas have lost sufficient knowledge of their descent to be included. Devolution of social assistance to Māori providers is one of the ways in which some of these problems are being addressed.
The need to address problems of inequality with respect to Māori sits uneasily with the values and attitudes of many Pākehā. Popular Pākehā ideas of equality tend not to be inclusive of Māori collectively, although Māori are fully accepted as individuals and fellow New Zealanders. While philosophical principles of equality can be brought to bear to justify unequally treating groups of people so that they can become more equal, such arguments have often been difficult to sell in everyday politics. Māori claims are also based on a claim that the government should restore rights of property and self-determination that have been wrongly denied.
While many understand this logic, others, as former National leader Don Brash (2004) put it, fear that New Zealand has been developing ‘two sets of laws, and two standards of citizenship’. Brash fuelled this fear in the months before the 2005 election. During Labour’s third term in office, in response to criticism, its policy to ‘close the gaps’ between Māori and non-Māori was reframed to remove any reference to ethnic identity. To be explained further in Chapter 10, the Clark Government’s foreshore and seabed legislation was a breach of Māori rights and led to the establishment of the Māori Party—the most successful attempt by Māori to establish an independent presence in parliamentary politics and government. The Māori Party has worked in alliance with the National Government since 2008. However, the question of equality for Māori is still one of the most difficult issues for New Zealanders to address in the early twenty-first century. Significant socio-economic gaps remain between the Māori and Pākehā population, with the Māori population having lower average formal qualifications and incomes, and higher rates of unemployment compared with the Pākehā population (Statistics New Zealand 2014a, 2014b, 2016b).
Conclusion
New Zealand’s political history reveals an early commitment to egalitarian liberalism, although it fell very short in the treatment of Māori and women. Chartist, Fabian, socialist and radical liberal ideas informed many of the economic and social policies implemented in the nineteenth and early twentieth centuries. Some of these policies became entrenched over time, acceptable to political parties on the left and the right. But this great consensus began to unravel in the 1970s. Income and wealth differences increased in tandem with greater recognition of the gender and ethnic dimensions of inequality. There were various reasons: increased market inequalities, changes in the role of the state in taxing and spending, and changes in the nature and regulation of the labour market that weakened the power of trade unions to bargain collectively. In very recent times, inequality has become more prominent in the public debate, with varying responses from the political parties and with the current National Government often tending to address legal inequalities rather than the substantive inequalities that require budgetary commitments or state regulation in the market (Chappell and Curtin 2013).
A strong common thread runs through the various narratives and analyses in this chapter: the importance of party politics and party policies in shaping the fall and rise of inequality in New Zealand. Government policies have both offset and fostered social and economic inequality, and thus this study of inequality in the context of an election is timely and relevant.
1 Under communism, the principle would be ‘from each according to their ability, to each according to their need’; again, a degree of inequality justified by circumstances.
2 It should be noted that estimates of Gini coefficients tend to differ between sources, either because of different data sources or different assumptions underpinning their analysis. For the most part, the different sources are consistent in their broad patterns and in what can be deduced from them.
3 Brian Easton warns that household data can only be imperfectly estimated before 1985; while personal income data exists from earlier periods, it cannot be easily translated given changes in households over time. It should also be noted that increasing levels of women’s labour force participation may have been partly responsible for decreasing household income inequality up to the 1980s (Easton 2013).
4 The English translation of the Māori version that is most cited is that of Hugh Kawharu, and can be found at: www.nzhistory.net.nz/files/documents/treaty-kawharau-footnotes.pdf.
Previous



