


 menu
China’s Domestic Transformation in a Global Context
9. Financial Integration and Global Interdependence
Rod Tyers1
Introduction
Fundamental to China’s global impact is the ‘unbalanced’ nature of its growth surge since the 1990s. The expansion of merchandise production at a faster rate than consumption in particular has had direct, and much analysed, effects on the terms of trade facing other regions.2 By having created a parallel excess supply of savings, however, this also changed the global financial terms of trade. That in turn contributed to the observed trend decline in asset yields in the same period.3 These improvements in both the product and the financial terms of trade of the advanced economies have, however, been partially offset by structural unemployment.4
Since the global financial crisis (GFC), there has been a decline in the level of imbalance in China’s growth. It is likely that we have seen the beginning of the inevitable transition process whereby China’s production structure diversifies away from export-oriented light manufacturing into sectors of rising demand domestically, and also higher value-added exports. This change is much anticipated,5 yet it is also non-neutral from the view of the other large economies. Although growth in physical capital and productivity is expected to continue, albeit at slower rates than previously, the relative growth in Chinese consumption will see a decline in its excess saving.
The international effects of this transition depend on trade and financial openness—both in advanced economies and in China. Trade openness has been shown to be extensive throughout the regions of focus in this chapter. Financial openness has, however, varied through time. Sensitivity to the effects of China’s financial openness of the change in China’s growth regime in advanced economies has not yet been widely studied. It is the focus of the research presented in this chapter.
A parsimonious global macroeconomic model is employed. It incorporates bilateral linkages across six regions via both trade and financial flows, in combination with a number of innovative mechanisms for characterising financial and macroeconomic interactions. The latter include allowing for asset differentiation so as to include optimising financial portfolio management in each region. This serves to direct savings from each into investments across all regions according to expected rates of return, with the degree of regional asset differentiation quantified to reflect financial integration. Second, long-maturity assets are central to global financial behaviour and, recently, also to unconventional monetary policy (UMP), which places direct demands on global markets for these assets.6 In reality and in the modelling, this tends to enhance the spillover effects of monetary policy.7 This proves important during China’s period of high growth because substantial monetary expansions were induced in the advanced economies by the deflationary effects of increased supply of Chinese products. By contrast, China’s transition to the new model of growth increases its consumption and so is inflationary in the advanced economies. When we consider the effects of nominal wage rigidities in the advanced economies, the Chinese surge and transition shocks are, respectively, contractionary and expansionary.
Overall, the results suggest that China’s earlier growth and ongoing structural transition have significant implications for the advanced economies, in terms of both financial flows and international terms of trade.8 Given nominal rigidities, these changes are shown to affect their levels of employment.9 With compensation for the displaced and unemployed, the results suggest China’s growth surge yielded net real income gains in advanced economies driven primarily by the terms-of-trade change. On the other hand, the more balanced new growth regime also offers net benefits, though driven primarily by increases in employment. Both results are sensitive to China’s financial integration because this increases flexibility in management of China’s collective asset portfolio.
The next section offers an introduction to China’s international macroeconomic impacts and their determinants. Section three describes the model used for quantitative analysis. Section four presents numerical analysis of the foreign effects of China’s growth surge and transition. Section five considers the sensitivity of these effects to financial integration, and section six concludes.
The global impact of China’s growth surge
A significant share of the macroeconomic literature on China’s growth has its genesis in concern about the imbalances associated with excess savings (the ‘savings glut’) and the ‘upstream’ financial flows that stem from them.10 China’s contribution to these upstream financial flows has been variously attributed, including to capital market distortions, exchange rate management and myriad other Chinese state interventions that confer unfair advantage on selected Chinese firms while also raising export and investment levels at the expense of household consumption.11
China’s growth surge
Adopting the standard Lewis model of growth that also reflected growth patterns in other East Asian growth transformations, China’s growth model involved the shift of hundreds of millions of workers from informal rural to urban employment, where their labour could be combined with capital and imported technology, yielding rapid productivity growth. The modest skill level of these workers shifted production towards light (labour-intensive) manufactures. In the absence of a parallel increase in consumer and investment demand, this required a rapid expansion in trade. The related growth, without parallel reform to social and industrial institutions, induced very high rates of household and corporate savings, the latter via rising state-owned enterprise (SOE) profits. Until China’s World Trade Organization (WTO) accession in 2001, the modest size of the Chinese economy limited its effects on the advanced economies.
Given the relocation of much of the world’s light manufacturing to China during its growth surge, it is unsurprising that, for advanced economies, the flipside was downward pressure on real wages growth. Moreover, the excess saving and associated cheap credit presumably contributed to asset price booms that in turn ultimately destabilised banking systems. And yet the bulk of the literature quantitatively exploring this issue finds a net gain for advanced economies, albeit with the caveat of increased structural unemployment.12
The transition to inward-focused growth
Since the global financial crisis (GFC), demand for China’s exports has declined. Diversification of patterns of production specialisation, however, is neither automatic nor straightforward from a policy standpoint. Moreover, the comparative growth required in heavy manufacturing and services is constrained by the tendency for these industries to be oligopolistic and thus to offer considerable rents associated with entrenched interests.
Despite such challenges, there is considerable potential for growth from these previously suppressed sectors (Song et al. 2011; Tyers 2014). Along with reforms to social policy that have the ultimate impact of reducing the need for precautionary household savings, there are already signs of an emerging, larger role for consumption growth in China. Recent studies go so far as to question whether China’s official statistics on consumption expenditure are underestimating the underlying extent of consumption that is already taking place (Ma and Yi 2010). Huang et al. (2013) use a weighted average of consumption-related retail sales growth and service sales growth to project the consumption share of gross domestic product (GDP). Their results suggest that the consumption share of GDP climbed, from 49 to 54 per cent during 2008–10, while China’s National Bureau of Statistics (NBS) had it falling, from 48 to 47 per cent.13 This suggests a continuing decline in the relative size of China’s current account surplus (Arora et al. 2015).
Excess saving and yields
Of the growth in global GDP since 1980 as measured in US dollars at current exchange rates, one-third is due to Asian growth, the scale of which has been emphasised by the World Bank (2013). The contribution of Asian economies to global savings has been even larger. They have supplied about half of the corresponding increment to global saving in the same period, with China contributing fully one-third of the total increment since 1990. These proportions imply that the shift in global growth towards high-saving Asia, which occurred in the 1980s, accelerated the rate at which the global savings supply curve shifted to the right. If, as the data suggest, the corresponding global investment demand curve shifted by less, there would have been a decline in the Wicksellian (Wicksell 1936) ‘natural’ rate of interest at the global level.14 Such a shift has significant implications for the international financial market.
The global financial market
Consistent with the segmentation theory of the yield curve (Johnson et al. 2010), long rates are more than the commonly claimed (Borio and Disyatat 2011) expectational extensions of short policy rates. Specifically, since the transaction cost of financing long-term investments via a succession of short contracts is prohibitive, short and long-maturity instruments trade at prices and yields that differ beyond what would be expected from time preference and expectation forces (Shiller et al. 1983; He and McCauley 2013). Short bonds are instruments of conventional domestic monetary policy that primarily serve the domestic financial sector. Their yield movements are clearly linked to region-specific business cycles (Arora et al. 2015). In contrast, long bonds arbitrage with major instruments of private saving and investment, and are widely traded internationally. Their yields therefore tend to follow a smoother path through time than yields on short instruments and the trend of this path is indicative of movements in the equilibrium between global saving and investment, as is suggested in Figure 9.1—the case of the financially dominant United States.
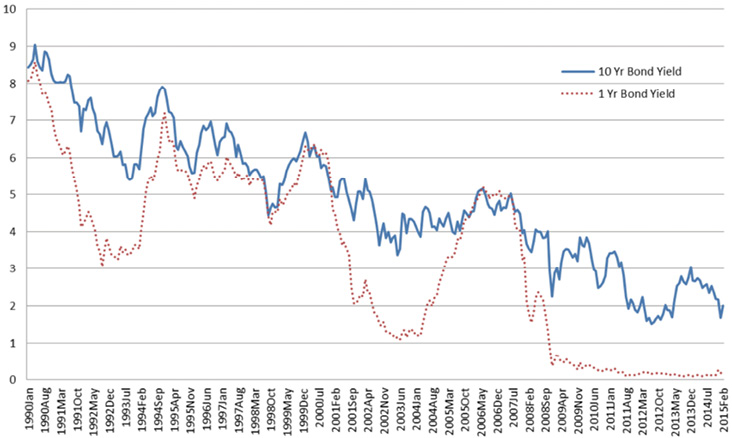
Figure 9.1 US Treasury bond short and long yields over two decades
Source: US Treasury.
He and McCauley (2013) use their evidence of ‘imperfect substitutability along the yield curve’ to explore monetary policy spillover effects. They consider the latter to be enlarged by the global integration of long bond markets. That view is supported by Ito (2013: 8), who argues that financial globalisation has made domestic financial markets more vulnerable to international factors. This in turn tends to decouple short-term and long-term rates. Consistent with Bernanke (2005), Ito (2013) concludes that the long-term interest rate is tied to global saving imbalances, and hence reflects the natural rate of interest.
The reasoning of He and McCauley, and Ito, along with the findings of Rey (2013), imply that given free capital mobility, inter-regional arbitrage will take place at the long end of the yield curve while the short end of the yield curve is, more conventionally, controlled by monetary authorities.15 The time paths of the advanced economies’ long yields in Figure 9.2 offer support for this idea of international arbitrage. It follows that the contemporary increase in Asian savings is a potential explanation for the persistent downward trend in long-term bond rates since the 1980s that is also apparent from Figure 9.2.16
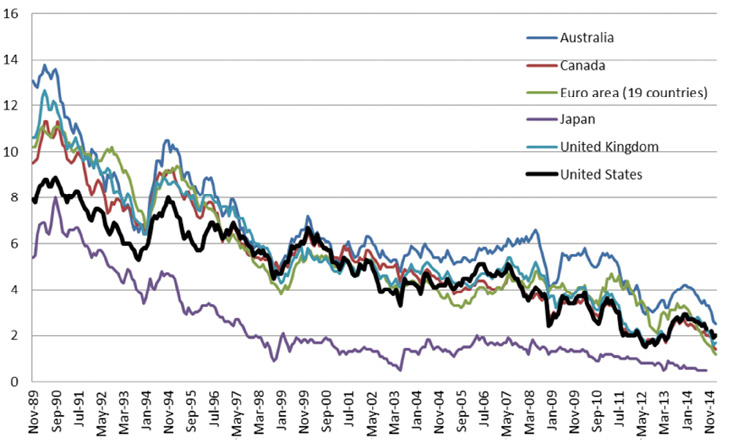
Figure 9.2 Long-term bond yields in advanced economies
Source: OECD (2015).
Implications
The trends and research presented so far in this chapter suggest changes in China’s savings level contribute to trends in the underlying Wicksellian interest rate at the global level and therefore to the yields in long bond markets that reflect it, now that it has become ‘macroeconomically’ large. It follows that the current transition in the pattern of Chinese growth, and its consumption behaviour, has important implications for global financial markets and for the economic performance of advanced economies, the more so as China’s financial sector deepens and becomes more internationally integrated. Second, it follows that the emergence of UMP in the large regional economies is also placing important demands on long bond markets. These demands, like China’s excess saving, tend to reduce yields on long-term debt globally and so the impacts of these two forces are difficult to separate. One way to study this is to model the global economy numerically, and thereby enable the decomposition of observed change among its determinants and the evaluation of the sensitivity of outcomes to factors such as financial integration.17
Modelling global macro-interdependence
A multi-region general equilibrium structure that centres on the global financial capital market is used for this analysis.18 In it, the financial products of each region are differentiated and portfolio managers assign new net savings across regions so as to maximise expected portfolio returns. This retains Feldstein and Horioka (1980) home investment bias while allowing significant redirections of financial flows at the margin in response to changes in expected yields. It also allows the level of global financial market integration to be parameterised by varying this degree of differentiation. By implication, the scale of short-run spillover effects associated with growth performance, excess saving and monetary policy therefore also depends on it.
There is a tendency for flows between integrated financial markets to move the global economy towards interest parity. Asset differentiation, however, helps reflect true differences in the properties and riskiness of debt and equity contracts across regions, ensuring that interest parity is realistically incomplete. At the same time, the expected regional rates of return that drive investment flows depart from regional bond yields. The former reflect anticipated rates of return on installed capital and the latter reflect short-run equilibrium in regional financial markets between savers, indebted governments and investors.
Within each region the demand for money is driven by a ‘cash in advance’ constraint applying across the whole of GDP. For any one household, home money is held in a portfolio with long-maturity bonds, which comprise claims over physical capital and government debt across the regions.19 On the supply side of the money market, in regions with UMP, expansions raise demand for long maturity bonds, reducing their yield and hence also reducing the opportunity cost of holding money.
Six economic regions are identified in the present study—the United States, the European Union, Japan, China, Australia and the Rest of the World—though the focus of this chapter is on the first four.20 Each of these economies supplies a single unique product. On the supply side, there are three primary factors, with production labour variable and partially employed. The stocks of physical capital and skill are exogenous in the short run and fully employed. The collective household is a net saver, with reduced-form real consumption depending on current and expected future real disposable income and the home real interest rate. Aggregate consumption is subdivided between the products of all regions via a single constant elasticity of substitution (CES) nest. Further details of the aspects of the model central to this analysis are provided in Tyers (2015a: 4).
Model database, parameters and operation
National accounts, international trade and financial data for the global economy in 2011 are used to assemble the database used. The implications of changes in China for the three advanced economies are emphasised here and the scale of these economies, as represented in the database, is indicated in Table 9.1. Of particular interest are the financial flows between the regions in question—a pattern of which is suggested in Table 9.2. In interpreting the analysis to follow, it is important to note the substantial share of the United States in financial outflows from China.21
Table 9.1 Relative economic sizes of China and the other large regions, ca 2011
|
% of world |
China |
US |
EU(26) |
Japan |
|
GDP |
11 |
22 |
26 |
9 |
|
Consumption, C |
8 |
27 |
26 |
9 |
|
Investment, I |
20 |
15 |
22 |
8 |
|
Government spending, G |
7 |
20 |
30 |
10 |
|
Exports, X |
17 |
17 |
25 |
7 |
|
Imports, M |
15 |
21 |
23 |
8 |
|
Total domestic saving, SD |
19 |
13 |
20 |
9 |
Sources: National accounts data supply most of the elements though adjustments have been required to ensure that current accounts sum to zero globally, as do capital/financial accounts. The IMF database (n.d.) is the major source but there is frequent resort to national statistical databases.
Table 9.2 Shares of total domestic savings directed to investment in each region, 2011a
|
% of row total saving |
US |
EU(26) |
Japan |
China |
Australia |
Rest of World |
|
USb |
68.0 |
13.3 |
6.4 |
6.4 |
1.5 |
4.4 |
|
EU(26)c |
12.9 |
80.1 |
2.3 |
2.3 |
0.9 |
1.5 |
|
Japand |
14.0 |
3.3 |
72.2 |
6.2 |
0.7 |
3.6 |
|
Chinac |
9.2 |
0.6 |
0.9 |
81.1 |
0.1 |
8.0 |
|
Australiae |
13.0 |
4.8 |
2.3 |
2.1 |
77.3 |
0.4 |
|
Rest of worldf |
3.4 |
3.9 |
2.6 |
2.8 |
0.1 |
87.2 |
a These shares sum to 100 horizontally. They are based on 2011 investment flows. The original flow matrix is inconsistent with data on savings and investment from national accounts and so an RAS algorithm is used to ensure that row and column sums are consistent with other data. The row sums of the original flow matrix are total savings by region and the column sums are total investment by region. These sums are sourced from the IMF (n.d.) database and the World Bank (n.d.) database.b United States: Values are based on official statistics, BEA.c European Union and China: Indirect information from US, Australian and Japanese statistics.d Japan: Estimated based on foreign direct investment (FDI) data, assuming investment outflow = FDI*1.6. The ratio 1.6 is that of US-reported inward investment from Japan divided by Japanese reported outward FDI to the United States.e Australia: ABS (2013).f Rest of World is a residual. Its saving is inferred from national accounts estimates and its investment abroad is determined to balance the matrix of financial flows.Sources: As per the notes above.
Primary results: Growth surge and transition effects
Two sets of comparative static experiments are undertaken in which shocks are applied to the Chinese economy that represent changes over a single year. These are stylised representations of actual changes during the growth surge period, on the one hand, and the subsequent transition to the new growth model on the other. For each, a set of assumptions is required about labour markets, fiscal policy and the target of monetary policy in all the regions. These are short run and Keynesian in flavour, and are detailed in Table 9.3.22 The stylised annual growth surge shocks are listed in Table 9.4 and they represent the comparative performance of the Chinese economy in the surge period: 2002–07.23 The particular shock to consumption behaviour represents the observed decline in the share of consumption expenditure and the rise in the share of private savings in GDP over those years.
Table 9.3 Key assumptions about labour markets, fiscal and monetary policya
|
Closure |
|
|
Labour market |
Exogenous nominal production (unskilled) wage with endogenous production employment |
|
Fiscal policy |
Exogenous nominal government spending and endogenous government revenue at fixed rates of tax on income, consumption and trade |
|
Monetary policy targetsb |
China and the Rest of the World: Fixed exchange rates against the US$c |
|
US, EU and Japan: Fixed monetary basesd Producer price level targets Consumer price level targets |
a Since the model is a system of nonlinear simultaneous equations and more variables are specified than equations in the system, there is flexibility as to the choice of those to make exogenous. This choice mirrors assumptions about the behaviour of labour markets, fiscal deficits and monetary policy targets.b Money supplies can be set to target any of the three price levels (consumer, producer and GDP), nominal exchange rates against the US dollar or nominal GDP levels.c Australia is a small region also identified in the model. Its monetary policy targets the producer price level, which ensures no change in employment.d No changes in commercial bank reserve behaviour are assumed so that money multipliers remain constant.
In the case of the transition, the first signs of which appeared after 2009, slower productivity and factor accumulation rates are combined with a single change in Chinese preferences that boosts consumption and reduces saving.24 The preference shock might be thought of as stemming from the combination of life-cycle changes and the social and industrial reforms discussed in earlier sections, and it is set at a level sufficient to raise the consumption share of GDP by about one-tenth (from 45 to near 50 per cent), which is representative of the change suggested by Huang et al. (2013).
The growth surge
The numerical simulation results are summarised in Table 9.5. The simulation is repeated for three different monetary policy settings for the United States, the European Union and Japan, as described in Table 9.3. China’s growth surge, combined with its imbalance between production and consumption, created excess supply in the advanced economies, so was deflationary in the absence of money supply adjustment.25 In the simulation, US dollar appreciation ensures that US consumer prices deflate by more than producer prices,26 so monetary targeting of the consumer price level requires the largest expansion of the US monetary base. Unsurprisingly, the resulting greater liquidity yields the best short-run outcome for the advanced economies in general, although the monetary expansion, which includes UMP, places further demands on long bond markets and exacerbates the decline in their yields.
In the case where the advanced economies target their monetary bases, and hence do not respond with monetary expansions, it is noteworthy that the decline in bond yields does not occur in all regions. This is because the deflations that result are contractionary, reducing both output and saving. This in turn places offsetting upward pressure on domestic yields. The net effect depends on the intensity of financial interaction with China.
As we have seen, this interaction is far more intense between China and the United States than between China and the other advanced economies. In the European Union, therefore, reduced home saving tends to dominate the opposing downward force due to the financial influx from China. For this reason, the simulated net change in the domestic real interest rate in the European Union is positive in the absence of a domestic monetary expansion sufficient to avert the contraction.
Real domestic investment rises in the advanced economies with the influx from China, but where deflation is not eliminated by monetary expansion, insufficiently to sustain domestic labour demand. The net effects on real GDP depend on the level of employment, which declines where deflation is allowed to persist. Historically, deflation occurred only briefly in the United States and Europe during the surge period, but it has been a persistent feature in Japan. The results therefore suggest that China’s growth surge ultimately contributed to the slow real GDP growth observed in the United States and the European Union and the stagnation in Japan during this period.
In more general terms, however, these economies experienced real appreciations relative to China, of a scale roughly equivalent to the terms-of-trade gains reflected in this model. The welfare effect of these real income gains can be incorporated by deflating nominal GDP by the domestic consumer price level to obtain the real purchasing power of home income at home consumer prices. This measure shows consistent net gains, suggesting that the overall effect of China’s surge in the advanced economies was positive but it was distributed in favour of capital owners rather than workers, so it caused distributional stress.
The transition
Both the surge and the transition shocks indicated in Table 9.4 embody productivity and factor endowment changes. At their core, however, they differ in that the transition offers a reversal of the change in consumption behaviour. There is in the transition a rise in Chinese consumption expenditure and a decline in savings. This reduces the structural imbalance substantially, so the transition’s effects on global financial markets are opposite to those of the growth surge. That is, bond yields in the advanced economies rise as China’s excess savings are reduced. Because of incomplete financial integration, however, yield rises abroad are smaller than within China. This ensures that the simulated change in international financial flux is reversed, reducing Chinese net outflows and increasing Chinese investment domestically. In the absence of monetary contractions in the advanced economies, these shocks are modestly inflationary. This stimulates employment and real GDP growth. Real purchasing power of income at consumer prices is boosted in the European Union and Japan—though not in the United States. This is because the transition shocks have caused the advanced economies to suffer terms-of-trade losses. Because China is more financially integrated with the United States, these are more than fully offset by increased employment only in the European Union and Japan.27
Table 9.4 Experimental shocksa
|
Scenario |
Shocks, % |
|
|
Growth surge |
Productivity, AY Consumption constant, AC Capital stock, K Skill stock, S |
3 –10 8 10 |
|
Transition |
Productivity, AY Consumption constant, AC Capital stock, K Skill stock, S |
1 15 3 10 |
|
Nominal wage, Wb |
4 |
a All shocks are to the Chinese economy only. They are considered representative of annual shocks in the growth surge and transition periods.b The Chinese nominal wage is shocked with the transition case only to allow for accelerated relative production wage growth in the transition, fostering consumption.Sources: Calibration to observed changes, combined with the meta analysis of productivity change by Wu (2011).
Sensitivity to financial integration
Financial integration can be thought of in several ways, even within the confines of the model adopted here. One possibility is to regard greater financial integration as being indicative of a more fluid substitution process between assets across all regions. This is readily reflected by a rise in all the regions’ elasticities of asset substitution,  .28 Since Chinese financial development is more recent than corresponding developments in China’s product markets or in the financial markets of advanced economies, it is here represented as a progression in the value of China’s from small values to full parity with the advanced economies.29
For low values of , China’s financial outflows adhere to the original pattern of these flows, as reflected in the 2011 database. When its substitution elasticity rises, the distribution of these outflows across regional assets is more responsive to relative yield changes. This includes greater flexibility of the share in China’s collective portfolio of China’s own domestic assets. To explore the effects of integration, the growth surge and transition shocks are introduced with values of that range from the very small to those representing integration at the level of the advanced economies. The effects of the surge and transition on regional bond yields, real GDP and the real purchasing power of regional income at consumer prices are assessed for China and the advanced economies. For economy of illustration, only the cases in which the advanced economies hold constant their money supplies are presented.
Sensitivity during the growth surge
More flexible Chinese portfolio management alters the effects of the growth surge, causing departures from the results in Table 9.5 in ways that can be seen in Figure 9.3. Not surprisingly, given that the shocks arise from the Chinese economy, Chinese performance indicators are the most strongly affected by changes in financial integration. Increases in it make China’s outbound investment easier and more flexibly distributed across the other economies. Since the growth surge caused a substantial rise in excess saving, the more readily that saving can be shifted abroad, the smaller is its tendency to suppress Chinese home bond yields and the greater is its tendency to suppress yields in regions with which China has intensive financial exchange. In the end, the modelling suggests that these changes in the degree of Chinese integration have, in themselves, only small effects on global bond yields. Of course, these experiments have common shocks to Chinese output and excess saving, the average international effects of which have already been indicated in Table 9.5. The marginal effects of greater flexibility of direction of financial flows are what are comparatively small.
Table 9.5 Effects of the growth surge with moderate financial integrationa
|
% changes |
US, EU, Japan monetary target |
US |
EU(26) |
Japan |
China |
|
Real bond yield, r |
|||||
|
Monetary base |
–0.21 |
0.07 |
–0.20 |
–2.43 |
|
|
Producer price level |
–1.23 |
–0.82 |
–1.22 |
–3.33 |
|
|
Consumer price level |
–3.23 |
–2.84 |
–3.15 |
–4.94 |
|
|
Consumer price level, PC |
|||||
|
Monetary base |
–0.20 |
–0.16 |
–0.12 |
–6.19 |
|
|
Producer price level |
0.00 |
0.00 |
0.00 |
–5.74 |
|
|
Consumer price level |
0.31 |
0.64 |
0.19 |
–5.02 |
|
|
Producer price level, PP |
|||||
|
Monetary base |
–0.67 |
–0.81 |
–0.37 |
–1.58 |
|
|
Producer price level |
–0.39 |
–0.74 |
–0.21 |
–1.17 |
|
|
Consumer price level |
0.00 |
0.00 |
0.00 |
–0.59 |
|
|
Exchange rate versus US$, E |
|||||
|
Monetary base |
0.00 |
–0.32 |
–0.83 |
0.00 |
|
|
Producer price level |
0.00 |
0.03 |
–0.63 |
0.00 |
|
|
Consumer price level |
0.00 |
–0.24 |
–0.28 |
0.00 |
|
|
Real investment, I/PP |
|||||
|
Monetary base |
0.36 |
0.11 |
0.2 |
10.86 |
|
|
Producer price level |
0.54 |
0.83 |
0.32 |
11.63 |
|
|
Consumer price level |
1.05 |
2.19 |
0.65 |
13.09 |
|
|
Production employment, L |
|||||
|
Monetary base |
–0.24 |
–0.19 |
–0.14 |
3.68 |
|
|
Producer price level |
0.00 |
0.00 |
0.00 |
4.35 |
|
|
Consumer price level |
0.38 |
0.78 |
0.23 |
5.44 |
|
|
Real output (GDP), Y/PY |
|||||
|
Monetary base |
–0.04 |
–0.03 |
–0.03 |
10.52 |
|
|
Producer price level |
0.00 |
0.00 |
0.00 |
10.71 |
|
|
Consumer price level |
0.07 |
0.14 |
0.04 |
11.01 |
|
|
Real income, Y/PC |
|||||
|
Monetary base |
0.55 |
0.86 |
0.25 |
4.15 |
|
|
Producer price level |
0.48 |
0.99 |
0.24 |
4.35 |
|
|
Consumer price level |
0.44 |
0.89 |
0.25 |
4.77 |
|
a These results are from the model described in the text with the closures and shocks listed in Tables 9.3 and 9.4. The ‘moderate’ financial integration parameters referred to are values of the elasticity of substitution between assets for each region,  . These are United States: 15; European Union: 15; Japan: 10; China: 5; Australia: 15; Rest of World: 5.Source: Simulations of the model described in the text.
Table 9.6 Effects of the transition with moderate financial integrationa
|
% changes |
US, EU, Japan monetary target |
US |
EU(26) |
Japan |
China |
|
Real bond yield, r |
|||||
|
Monetary base |
0.62 |
0.54 |
0.63 |
3.05 |
|
|
Producer price level |
2.61 |
2.22 |
2.69 |
4.94 |
|
|
Consumer price level |
2.00 |
1.63 |
1.89 |
4.42 |
|
|
Consumer price level, PC |
|||||
|
Monetary base |
0.37 |
0.23 |
0.31 |
–1.47 |
|
|
Producer price level |
0.00 |
0.00 |
0.00 |
–2.36 |
|
|
Consumer price level |
0.07 |
0.15 |
0.28 |
–2.19 |
|
|
Producer price level, PP |
|||||
|
Monetary base |
0.46 |
–0.15 |
–0.03 |
0.65 |
|
|
Producer price level |
–0.07 |
–0.16 |
–0.47 |
–0.13 |
|
|
Consumer price level |
0.00 |
0.00 |
0.00 |
–0.07 |
|
|
Exchange rate versus US$, E |
|||||
|
Monetary base |
0.00 |
0.84 |
1.31 |
0.00 |
|
|
Producer price level |
0.00 |
0.00 |
1.22 |
0.00 |
|
|
Consumer price level |
0.00 |
–0.06 |
0.45 |
0.00 |
|
|
Real investment, I/PP |
|||||
|
Monetary base |
–0.91 |
–0.62 |
–0.78 |
2.64 |
|
|
Producer price level |
–1.18 |
–1.99 |
–0.81 |
1.25 |
|
|
Consumer price level |
–1.03 |
–1.59 |
–1.11 |
1.67 |
|
|
Production employment, L |
|||||
|
Monetary base |
0.45 |
0.28 |
0.37 |
–0.93 |
|
|
Producer price level |
0.00 |
0.00 |
0.00 |
–2.15 |
|
|
Consumer price level |
0.08 |
0.19 |
0.34 |
–1.91 |
|
|
Real output (GDP), Y/PY |
|||||
|
Monetary base |
0.08 |
0.05 |
0.07 |
4.57 |
|
|
Producer price level |
0.00 |
0.00 |
0.00 |
4.23 |
|
|
Consumer price level |
0.01 |
0.03 |
0.06 |
4.29 |
|
|
Real income, Y/PC |
|||||
|
Monetary base |
–0.08 |
0.47 |
0.41 |
4.10 |
|
|
Producer price level |
0.05 |
0.15 |
0.49 |
3.70 |
|
|
Consumer price level |
0.06 |
0.16 |
0.34 |
3.89 |
|
a These results are from the model described in the text with the closures and shocks listed in Tables 9.3 and 9.4. The ‘moderate’ financial integration parameters referred to are values of the elasticity of substitution between assets for each region, . These are United States: 15; European Union: 15; Japan: 10; China: 5; Australia: 15; Rest of World: 5.Source: Simulations of the model described in the text.
Real long bond yield Real purchasing power of income Real GDP
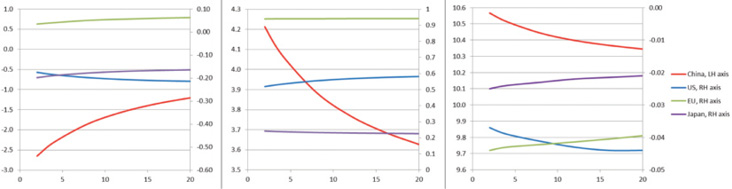
Figure 9.3 Effects of the growth surge: sensitivity to China’s financial integration (percentage changes)
Source: Simulations of the model described in the text.
The expected movement towards convergence of bond yields occurs between China and the United States, but, while Japan also sees its yield declining, the effects of integration are opposite in direction in both Japan and the European Union relative to the United States. This occurs for the reasons discussed in the previous section—namely, there is a mismatch between the intensities of trade and financial flows to Japan and the European Union. Strong trading relationships cause major terms-of-trade effects and deflation, while weak financial relationships (Table 9.2) mean effects on European and Japanese bond markets are comparatively small. So, home bond markets in these regions are primarily affected by their deflation-induced domestic supply (and hence saving) contractions. Even where proportional changes to the initial shares of Chinese outflows to the European Union and Japan are substantial, the small base tends to push most of the additional outflow to the United States.
The effect of China’s financial integration on its own real GDP and on the purchasing power of its income at domestic prices is to impair its short-run economic performance. This is because greater integration increases financial outflows from China and hence reduces domestic investment. This further depreciates China’s real exchange rate, exacerbating the terms-of-trade shift against it. Even so, the net effect for China of the surge shock remains very positive. Internationally, the tendency for China’s financial outflows to be US-focused serves to appreciate the US real exchange rate relative to the European Union and Japan. On the one hand, this exacerbates the employment contraction and hence the effects of the surge on US GDP. On the other hand, it increases the terms-of-trade gain and so enhances the real purchasing power of US income.
Sensitivity during the transition
The results from the transition shocks taken over the same range of levels of Chinese financial integration (asset substitutability) have a pattern that is generally the opposite of the surge shocks. This time the reduction in excess saving ensures that the higher returns are available within China. As can be seen from Figure 9.4, at higher levels of integration, China’s portfolio rebalances more fully towards domestic assets and away from foreign ones. Home yields end up lower, and those in the United States—from whence the rebalance is resourced—rise. More minor redistributions also favour the European Union and Japan, whose yields fall slightly. Bringing expenditure back home improves both real GDP and the purchasing power of national income in China. Removing it from the United States reduces the US terms-of-trade gain and hence impairs the real purchasing power of US income. On the other hand, the higher US bond yield that stems from Chinese integration raises liquidity, while higher inflation—though still modest—improves employment, lifting real GDP. These effects are reduced in the European Union and Japan because of the effect Chinese integration has in reducing their bond yields. On the one hand, this causes less inflation and less employment uptake, but on the other, it tends to appreciate their real exchange rates, conferring larger terms-of-trade gains.
Real long bond yield Real purchasing power of income Real GDP
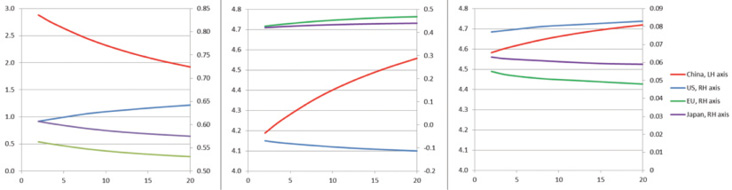
Figure 9.4 Effects of the transition: sensitivity to China’s financial integration (percentage changes)
Source: Simulations of the model described in the text.
Conclusion
This chapter introduces an elemental global macroeconomic model with national asset portfolio rebalancing and explicit representation of unconventional monetary policy. It is used to evaluate the international effects of changes in China’s growth regime. The post-WTO accession growth surge and the subsequent and ongoing structural transition are shown to have important implications for the United States, the European Union, Japan and Australia. The scale of these effects is further shown to depend on the level of China’s financial integration with these advanced economies.
Even though the growth surge caused considerable structural change in the advanced economies—as manufacturing employment relocated to China, contributing to increased unemployment—this growth conferred on the advanced economies considerable terms-of-trade gains. The results from this analysis suggest that these gains outweighed the losses associated with increased unemployment. Had China been more financially integrated at the time, it is further shown that the financial influx, particularly into the United States, would have been larger. This would have made the US terms-of-trade gain larger, but its domestic bond yields would have been lower and the effects more deflationary, further reducing US employment and real GDP growth.
China’s ongoing structural transition is relaxing its previous consumption repression and this is likely to continue to reduce its excess saving over time. The result is a tightening of global financial markets and some still modest increases in inflation in the advanced economies, therefore tending to restore employment in those economies.
On the other hand, reduced financial outflows from China depreciate real exchange rates in the advanced economies and redistribute investment towards China. This brings terms-of-trade losses in the advanced world and the moderating investment could slow growth there. As measured by the purchasing power of national incomes at home consumer prices, the employment gains appear to outweigh the terms-of-trade losses, at least for Europe and Japan. Increasing Chinese financial integration is shown to exacerbate these effects, particularly for the United States, since Chinese financial outflows have tended to be focused on US asset markets.
References
Arora, V., Tyers, R. and Zhang, Y. (2015), Reconstructing the savings glut: The global implications of Asian excess saving, International Journal of Economics and Finance, 7(7).
Australian Bureau of Statistics (ABS) (2013), International investment position, Australia: Supplementary statistics, 2011, Cat. no. 5352.0, Canberra: ABS.
Autor, D.H., Dorn, D. and Hanson, G.H. (2013), The China syndrome: Local labor market effects of competition in the United States, American Economic Review, (103)3: 220–25.
Bergsten, C.F., Freeman, C., Lardy, N.R. and Mitchell, D.J. (2008), China’s rise: Challenges and opportunities, Washington, DC: Peterson Institute for International Economics.
Berman, E., Bound, J. and Griliches, Z. (1994), Changes in the demand for skilled labour within US manufacturing: Evidence from the annual survey of manufactures, Quarterly Journal of Economics, 109(2): 367–97.
Bernanke, B.S. (2005), Remarks by the governor, Federal Reserve Board, Sandridge Lecture, Virginia Association of Economists, March, Richmond, Va.
Bernanke, B.S. (2011), Global imbalances: Links to economic and financial stability, Speech given at the Banque de France Financial Stability Review Launch Event, 18 February, Paris.
Blanchard, O. and Giavazzi, F. (2006), Rebalancing growth in China: A three-handed approach, China and the World Economy, 14(4): 1–20.
Bound, J. and Johnson, G. (1992), Changes in the structure of wages in the 1980s: An evaluation of alternative explanations, American Economic Review, 82(3): 371–92.
Borio, C. and Disyatat, P. (2011), Global imbalances and the financial crisis: Link or no link, BIS Working Paper 346, May, Basel: Bank for International Settlements.
Caballero, R.J. (2009), The ‘other’ imbalance and the financial crisis, MIT Working Papers in Economics 9-32, December, Cambridge, Mass.: Massachusetts Institute of Technology.
Caballero, R.J., Farhi, E. and Gourinchas, P.O. (2008), An equilibrium model of ‘global imbalances’ and low interest rates, American Economic Review, 98(1): 358–93.
Chen, Q., Filardo, A., He, D. and Zhu, F. (2014), Financial crisis, unconventional monetary policy and international spillovers, Presentation at the ECB-IMF Conference on International Dimensions of Conventional and Unconventional Monetary Policy, 29–30 April, Frankfurt.
Chinn, M.D. and Ito, H. (2007), Current account balances, financial development and institutions: Assaying the world ‘saving glut’, Journal of International Money and Finance, 26: 546–69.
Chinn, M.D., Eichengreen, B. and Ito, H. (2012), Rebalancing global growth, in Canuto, O. and Leipziger, D. (eds), Ascent after descent: Regrowing economic growth after the great recession, Washington, DC: The World Bank, pp. 35–86.
Choi, H., Mark, N.C. and Sul, D. (2008), Endogenous discounting, the world saving glut and the US current account, Journal of International Economics, 75: 30–53.
di Giovanni, J., Levchenko, A.A. and Zhang, J. (2013), Global welfare effect of China: Trade integration and technical change, AER Macroeconomics, October.
Eichengreen, B. (2004), Global imbalances and the lessons of Bretton Woods, NBER Working Paper 10497, Cambridge, Mass.: National Bureau of Economic Research.
Eickmeier, S. and Kuehnlenz, M. (2013), China’s role in global inflation dynamics, Discussion Paper 7-2013, Frankfurt: Deutsche Bundesbank.
Feldstein, M. and Horioka, C.Y. (1980), Domestic saving and international capital flows, Economic Journal [Royal Economic Society], 90(358): 314–29.
Feng, C. and Yang, L. (2013), The end of China’s demographic dividend, in Garnaut, R., Fang, C. and Song, L. (eds), China: A new model for growth and development, Canberra and Beijing: ANU E Press & Social Sciences Academic Press, pp. 55–74.
Francois, J.F. and Nelson, D. (1998), Trade, technology and wages: General equilibrium mechanics, Economic Journal, 108: 1483–99.
Francois, J.F. and Wignaraja, G. (2008), Economic implications of Asian integration, Global Economy Journal, 8(3): 1–48.
Garner, J. and Qiao, H. (2013), China: Household consumption most likely US1.6 trillion larger than officially stated, Asian Insight, 28 February, Morgan Stanley Research. Available from: www.morganstanleychina.com/views/121217.html.
Genberg, H. and Zhang, W. (2010), Can China save the world by consuming more?, VOX EU, 25 April.
Harris, R.G. and Robertson, P.E. (2013), Trade, wages and skill accumulation in the emerging giants, Journal of International Economics, 89(2): 407–21.
Harris, R.G, Robertson, P.E. and Xu, J. (2011), The international effects of China’s trade and education booms, The World Economy, 34(10): 1703–25.
Haskel, J., Lawrence, R.Z., Leamer, E.E. and Slaughter, M.J. (2012), Globalization and US wages: Modifying classic theory to explain recent facts, Journal of Economic Perspectives, 26(2): 119–40.
He, D. and McCauley, R.N. (2013), Transmitting global liquidity to East Asia: Policy rates, bond yields, currencies and dollar credit, Hong Kong Institute for Monetary Research Working Paper No. 15/2013, BIS Working Papers 431, October, Basel: Bank for International Settlements.
He, D., Cheung, L., Zhang, W. and Wu, T. (2012), How would capital account liberalization affect China’s capital flows and renminbi real exchange rates?, China and the World Economy, 20(6): 29–54.
Helpman, E., Itskhoki, O. and Redding, S.J. (2010), Inequality and unemployment in a global economy, Econometrica, 78(4): 1239–83.
Hsieh, C.T. and Klenow, P. (2009), Misallocation and manufacturing TFP in China and India, Quarterly Journal of Economics, 124(November): 1403–48.
Huang, Y., Chang, J. and Yang, L. (2013), Consumption recovery and economic rebalancing in China, Asian Economic Papers, 12(1): 47–67.
International Monetary Fund (IMF) (n.d.), International financial statistics, Washington, DC: International Monetary Fund.
Ito, H. (2009), US current account debate with Japan then, and China now, Journal of Asian Economics, 20: 294–313.
Ito, H. (2013), Monetary policy in Asia and the Pacific in the post, post-crisis era, Presented at the 36th Pacific Trade and Development Conference: Financial Development and Cooperation in Asia and the Pacific, Hong Kong Monetary Authority, 19–21 November.
Johnson, R.S., Zuber, R.A. and Gandar, J.M. (2010), A re-examination of the market segmentation theory as a pedagogical model, Journal of Financial Education, 36(1–2): 1–37.
Krugman, P. (1994), The myth of Asia’s miracle, Foreign Affairs, 73(6): 62–78.
Krugman, P. (1995), Growing world trade: Causes and consequences, Brookings Papers, 1: 327–77.
Krugman, P. (2010), Capital export, elasticity pessimism and the renminbi (wonkish), The New York Times [blog], 16 March.
Lardy, N.R. (2006), Toward a consumption-driven growth path, Policy Brief 06-6, Washington, DC: Peterson Institute for International Economics.
Lardy, N.R. (2012), Sustaining China’s growth after the global financial crisis, January, Washington, DC: Peterson Institute for International Economics.
Leamer, E.E (1996), Wage inequality from international competition and technological change: Theory and country experience, American Economic Review, 86(2): 309–14.
Lee, J.W. and McKibbin, W.J. (2007), Domestic investment and external imbalances in East Asia, CAMA Working Paper 4-2007, Canberra: The Australian National University.
Levchenko, A.A. and Zhang, J. (2012), The global labor market impact of emerging giants: A quantitative assessment, Presented at the 13th Jacques Polak Annual Research Conference, hosted by the International Monetary Fund, 8–9 November, Washington, DC.
Lin, S. and Ye, H. (2015), The international transmission of U.S. monetary policy: New evidence from trade data, Working Paper No. 08/2015, Hong Kong: Hong Kong Institute for Monetary Research.
Ma, G. and Yi, W. (2010), China’s high saving rate: Myth and reality, International Economics, 122: 5–40.
N’Daiye, P., Zhang, P. and Zhang, W. (2010), Structural reform, intra-regional trade, and medium-term growth prospects of East Asia and the Pacific: Perspectives from a new multi-region model, Journal of Asian Economics, 21: 20–36.
Organisation for Economic Cooperation and Development (OECD) (2015), Long-term interest rates (indicator), Paris: OECD. Available from: doi:10.1787/662d712c-en. Accessed 23 March 2015.
Rey, H. (2013), Dilemma not trilemma: The global financial cycle and monetary policy independence, Federal Reserve Bank of Kansas City Economic Symposium, August, Jackson Hole, WY.
Rogoff, K. (2013), Inflation is still the lesser evil, Project Syndicate, 6 June. Available from: www.project-syndicate.org/commentary/. Accessed 12 June 2013.
Shiller, R.J., Campbell, J.Y. and Schoenholtz, K.L. (1983), Forward rates and future policy: Interpreting the term structure of interest rates, Brookings Papers on Economic Activity, 1983(1): 173–223.
Shin, H.S. (2011), Global banking glut and loan risk premium, Presented at the 12th Jacques Polak Annual Research Conference hosted by the International Monetary Fund, 10–11 November, Washington, DC.
Song, L., Yang, J. and Zhang, Y. (2011), State-owned enterprises’ outward investment and the structural reform in China, China and the World Economy, 19(4): 38–53.
Tyers, R. (2014), Looking inward for transformative growth, China Economic Review, 29: 166–84.
Tyers, R. (2015a), China and international macroeconomic interdependence, CAMA Working Paper No. 9-2015, April, Canberra: The Australian National University.
Tyers, R. (2015b), International effects of China’s rise and transition: Neoclassical and Keynesian perspectives, Journal of Asian Economics, 37: 1–19. Available from: doi:10.1016/j.asieco.2015.01.002.
Tyers, R. (2015c), Pessimism shocks in a model of global macroeconomic interdependence, International Journal of Economics and Finance, 7(1): 37–59.
Tyers, R. and Yang, Y. (1997), Trade with Asia and skill upgrading: Effects on labor markets in the older industrial countries, Review of World Economics, 133(3): 383–418.
Tyers, R. and Yang, Y. (2000), Capital–skill complementarity and wage outcomes following technical change in a global model, Oxford Review of Economic Policy, 16: 23–41.
Tyers, R. and Zhang, Y. (2011), Appreciating the renminbi, The World Economy, 34(2): 265–97.
Tyers, R. and Zhang, Y. (2014), Real exchange rate determination and the China puzzle, Asian-Pacific Economic Literature, 28(2): 1–32.
Wicksell, K. (1936) [1898], Interest and prices: A study of the causes regulating the value of money, London: Macmillan.
Winchester, N. and Greenaway, D. (2007), Rising wage inequality and capital–skill complementarity, Journal of Policy Modeling, 29(1): 41–54.
Wood, A. (1994), North–South trade, employment and inequality, Oxford: Clarendon Press.
World Bank (n.d.), World Bank Open Data, Washington, DC: The World Bank. Available from: data.worldbank.org/.
World Bank (2013), Capital for the future: Saving and investment in an interdependent world, Washington, DC: The World Bank.
Wu, Y. (2011), Total factor productivity growth in China: A review, Journal of Chinese Economic and Business Studies, 9(2): 111–26.
Yang, D.T. (2012), Aggregate savings and external imbalances in China, Journal of Economic Perspectives, 26(4): 125–46.
1 Funding for the research described in this chapter is from Australian Research Council Discovery Grant No. DP0557885. Useful discussions on the topic with Dong He, Song Ligang, Paul Luk and Wenli Chen are acknowledged, along with comments received at seminars at The Australian National University, the China Center for Economic Research, Peking University and the Hong Kong Institute of Monetary Research. Thanks for assistance with data gathering for this research are due to Ying Zhang.
2 The literature on the terms-of-trade consequences for the advanced economies began in the 1990s with the debate over the poor performance of unskilled US workers (Bound and Johnson 1992; Wood 1994; Berman et al. 1994; and Leamer 1996) and extended into a more complex debate over the apparently declining performance of all but the most highly paid US workers (Haskell et al. 2012; Helpman et al. 2010; Autor et al. 2013). It has also included global modelling studies that kicked off with Krugman (1995) and proceeded to the decomposition studies by Tyers and Yang (1997) and Francois and Nelson (1998), with more detailed follow-up of labour effects by Tyers and Yang (2000); Winchester and Greenaway (2007); Francois and Wignaraja (2008); Harris et al. (2011); Harris and Robertson (2013); Levchenko and Zhang (2012); and di Giovanni et al. (2013). Diversity in method notwithstanding, all the global modelling studies find net gains to the rest of the world transmitted via terms-of-trade effects.
3 The terms-of-trade gain transmitted financially has been commonly referred to as the Asian ‘savings glut’. See Bernanke (2005); Chinn and Ito (2007); Choi et al. (2008); Ito (2009); Chinn et al. (2012); and Arora et al. (2015).
4 For a survey and analysis of the neoclassical and Keynesian effects abroad, see Tyers (2015b).
5 See, for example, Lardy (2006).
6 Conventional monetary policy focuses on short maturity assets that serve domestic financial industries and are not held in great volume abroad.
7 See, for example, Chen et al. (2014); and Lin and Ye (2015).
8 Advanced economies here refer specifically to the United States, Japan, the European Union and Australia.
9 Empirical analysis also reveals large macroeconomic effects, as found, for example, by Eickmeier and Kuehnlenz (2013). The results are contrary to those of N’Daye et al. (2010) and Genberg and Zhang (2010), who find that the international effects of increased Chinese consumption are small. Their conclusions stem from the use of a model in which spillover effects stem primarily from trade, and financial flows are only weakly represented.
10 The literature asserting, and depending on, the ‘savings glut’ hypothesis is now extensive. Contributions include Bernanke (2005, 2011); Caballero et al. (2008); Caballero (2009); Chinn and Ito (2007); Choi et al. (2008); Chinn et al (2012); Eichengreen (2004); and Lee and McKibbin (2007).
11 The American literature critical of China’s macroeconomic policies is also extensive. Bernanke (2005, 2011) offers the outline and Krugman (2010) declares that ‘China is making all of us poorer’. The US macroeconomic position is put in more detail by, among others, Lardy (2006, 2012) and Bergsten et al. (2008). Similar advocacy of policy-induced ‘balance’ in China’s growth can be found, still more formally, in Blanchard and Giavazzi (2006), while it is also recognised that some of the US reaction is mercantilist (Ito 2009).
12 See the survey by Tyers (2015b).
13 Huang et al. (2013) start with the official consumption share in 2000 and derive the GDP shares in remaining years using real GDP growth and their estimated consumption growth rates. Using similar data, Garner and Qiao (2013) suggest that Chinese consumption expenditure is officially underestimated by US$1.6 trillion, also concluding that its GDP share is expanding.
14 Ex ante shifts in saving supply and investment demand cannot be observed. See Tyers (2015b) for a discussion of this.
15 I thank Paul Luk for clarifying this point.
16 The separation of the series for Japan is associated with its long-term current account surplus and the major yen appreciation shocks of the late 1980s and early 1990s, which established a negative risk premium among Japanese savers. In all regions, inflation rates were low throughout the period shown in the figure and so the trend of nominal long rates reflects that of corresponding real rates.
17 For a comparison of the global effects of the change of China’s growth regime with those of the current US recovery and the continuing EU and Japanese monetary expansions, see Tyers (2015a).
18 The model used is a more advanced variant of that used in Tyers (2015c). That model assumed a perfectly integrated global bond market and so tended to generate unrealistically large spillover effects. Here, all financial products, including government bonds, are represented as regionally differentiated and so there is no perfectly integrated global market for any asset class. Also, this model introduces unconventional monetary policy, which sees monetary expansions directly affecting the markets for long-maturity assets.
19 Expectations are exogenous in the model and are formed over future values of home nominal disposable income, the rate of inflation, the real rate of return on home assets and bilateral real exchange rate alignment.
20 The European Union is modelled as the full 26 countries and it is assumed that this collective has a single central bank.
21 Further details as to the sources and construction of the database can be obtained from Tyers (2015c: Appendix 2).
22 Keynesian and neoclassical assumptions about behaviour in response to the Chinese shocks are compared using a similar model by Tyers (2015b). While there are key differences in financial market structure between the two models, the contrasts that emerge are similar to those that would stem from the model used here.
23 The capital accumulation and productivity shares of China’s recent growth are controversial (Krugman 1994). The separate roles these played are examined using a similar model by Tyers (2015a). The shock values used here are consistent with the meta-analysis by Wu (2011).
24 The slowdown assumed here is consistent with the analysis by Feng and Yang (2013), though this is not to deny that considerable potential remains for further productivity growth, even in China’s manufacturing sector (Hsieh and Klenow 2009).
25 Another way to think of this is that lower interest rates raise the demand for money relative to goods, thus reducing the prices of goods in terms of money.
26 This is because the consumption basket includes imported products not included in the calculation of the producer or GDP prices.
27 These results differ in detail, though not in bottom-line magnitudes of net effects, from the Keynesian outcomes of the analysis by Tyers (2015b). This is because the assumption of a fully integrated global bond market, made in that paper, yields considerably larger financial spillover effects than obtained with the model adopted here.
28 In the model, described in detail by Tyers (2015a), financial integration is indexed by the preparedness of asset holders to substitute the assets of one region with those of another, represented by an elasticity of substitution. When the value of that elasticity is large, portfolio managers rebalance across regions on fine movements in expected rates of return on investment. When it is small, portfolio compositions are comparatively stable.
29 The values of the substitution elasticity used in generating the results in the previous section are 15 for the United States and the European Union, 10 for Japan and five for China. These values reflect numerical measures of comparative financial openness (Tyers 2015c: Appendix 2). Here the analysis sets them as constant at 20 for all the advanced economies and examines the effects of allowing China’s elasticity to rise from two to 20.
Previous