


 menu
Dilemmas in Public Management in Greater China and Australia
8
The state of local public finance in China under Xi Jinping
Christine Wong1
Abstract
The remarkable reconstruction of the role of government in the PRC since 1978 has required an overhaul of its public finance system. The process of fiscal reform, however, is still not complete.
Particularly since the 1994 reforms aimed to recentralise revenues, there has been a major mismatch between the expenditure responsibilities of local governments and the revenues they receive. Despite the achievements of new social welfare systems and world-class infrastructure, the fiscal imbalance has resulted in growing waste, inefficiencies, corruption and a mountain of local government debt.
During the first year of the Xi Jinping administration, a sweeping program of governance reform was laid out, starting with a new Budget Law in 2014 aimed to strengthen budget management, rein in extra-budgetary revenues and install mechanisms for controlling local government debt. Significant progress has since been made, including in financial reporting and transparency.
Tax reform however has not been nearly so successful and little progress has been made on intergovernmental fiscal reform. As a result, instead of the intended move towards more equal standards of public services, recent developments favour the rich provinces and the fiscal position of local governments has deteriorated. Local fiscal problems have also begun to depress social spending, threatening to undermine the government’s goals of improving public services and rebalancing the economy towards consumption.
Keywords: fiscal reform; fiscal decentralisation; equalisation; local government debt.
Introduction
Since market reforms began in 1978, China has undertaken a remarkable reconstruction of the role of government and overhauled its public finances to create a system able to finance the revised government operations and support economic growth, as well as provide the revenues underpinning the government’s ambitious industrial and social policies. The process of fiscal reform is not complete despite the substantial advances made, and an unbalanced central–local relationship continues to be a major source of distortion in the Chinese economy.
By expenditure shares, China’s fiscal system is the most decentralised in the world, with local governments accounting for 85 per cent of budget expenditures of government. This decentralisation is not matched on the revenue side, where local governments earn just over half of the total revenues.
This mismatch was a legacy of the 1994 fiscal reform that recentralised revenues but left most expenditures with local governments. The imbalance grew worse through the rapid expansion of public services during the Hu Jintao–Wen Jiabao administration, since the increased spending on ‘harmonious society’ initiatives accrued almost entirely to local governments, enlarging the vertical fiscal gap and requiring more transfers (Wong 2018).
In 2012, local governments earned 52 per cent of budgetary revenues but accounted for 85 per cent of expenditures; the gap was financed by transfers that took up 70 per cent of the central government’s revenues. Nearly 70 per cent of the transfers had to be sent to local governments at the county level, which are responsible for delivering virtually all the public services that touch people’s lives—education, healthcare, social security and welfare. In China’s fiscal system, these transfers have to be passed down through the administrative hierarchy level by level—from Beijing to the provinces, from the provinces to the prefectures and from the prefectures to the counties and districts. The administrative burden of managing these transfers created an extraordinary strain on the bureaucracy, far outstripping the capacities of the monitoring and supervisory systems. The result was that the remarkable achievement of building a fairly comprehensive social welfare system and world-class infrastructure to support China’s miracle growth was marred by growing waste, inefficiencies, rampant corruption and a mountain of local government debt.
At the outset of the Xi Jinping administration in 2013, an ambitious plan was laid out for comprehensive reform of the fiscal system targeted for completion by 2020, with the promise of a significant intergovernmental realignment. The reform was planned to proceed in a sequence of three phases, starting with budget and public financial management reform (PFM) in phase one in 2014, reform of the tax system in phase two starting in 2015, and intergovernmental fiscal reform in phase three beginning in 2016.
Phase one reforms began with passage of the revised Budget Law in 2014. Over the past six years these PFM reforms have made considerable progress in building fiscal institutions, including extending budget control over fiscal resources, improving budget transparency and strengthening monitoring and supervision. Reforms to rein in local government borrowing are also beginning to take hold.
While tax reform in phase two saw the successful conversion of the value-added tax (VAT) to a consumption-type VAT, and its extension to cover services in 2016, it has not delivered new revenue sources for local government.
Intergovernmental fiscal reform has also faltered. It officially began in 2016 with the State Council promoting a division of central and local fiscal responsibilities followed by clarification of the central–local division of expenditure responsibilities. However, to date this has brought no significant realignment of revenues and expenditures.
With intergovernmental reform making little progress, PFM reform reining in their extrabudgetary activities and tax reform delivering no new revenue sources, local governments are being squeezed from all sides. This has all taken place in the context of a slowdown in economic growth and tax and fee cuts since 2015, a combination that has sharply reduced revenue growth for government and cut the revenue-to-GDP ratio. The tax and fee cuts have especially affected local government revenues.
Local fiscal difficulties are depressing government social spending, threatening to undermine the government’s goals of improving public services and rebalancing the economy toward consumption. If continued, this could return the state of intergovernmental fiscal relations to where it was in the 1990s, when local fiscal difficulties were an impediment to national policy implementation.
This chapter sets out the fiscal reforms that have been pursued in the Xi Jinping era and the fiscal status of local government today and concludes with an assessment of the present state of the intergovernmental system and the risk it poses to China’s capacity to achieve its longer-term policy objectives.
Fiscal reform in the Xi Jinping era
During the first year of the Xi Jinping administration, a sweeping program of governance reform was laid out and endorsed at the third plenum of the eighteenth Party Central Committee meeting in November 2013, in which fiscal reform was identified as a key priority (Xi 2013). Citing the ‘Overall Plan for Deepening Reform of the Fiscal and Taxation System’ approved by the Politburo in July 2014, Finance Minister Lou Jiwei described the program’s three big tasks as strengthening the budget management system, improving the tax system and building an intergovernmental system with appropriate resources and responsibilities.
Emphasising that in this round, the reforms were not just ‘applying patches here and there’, nor a process of ‘fanning the broth to keep it from boiling over’, he promised a comprehensive program aimed at achieving a fundamental restructuring of the fiscal system, to proceed in three phases. The first phase—to begin immediately—would focus on budget reforms; phase two would begin in 2015 with reforms of the tax system; and phase three would begin in 2016 with intergovernmental reform to rationalise the assignment of revenues and expenditures (Xinhua 2013).
With Party and legislative support, fiscal reforms were off to a fast start in 2014. By far the most important step was passage of the revised Budget Law in August, which ushered in a huge and hugely important program of reform to strengthen budget management, rein in extrabudgetary revenues and install mechanisms for controlling local government debt. It also called for shifting to medium-term budgeting and strengthening budget oversight by the People’s Congress (NPC Standing Committee 2014; see also MOF 2014a).
These are technical reforms in PFM that are mostly invisible to the public, but critical in building the institutions and mechanisms for modern budget management. These reforms typically take many years to implement and refine but have made significant progress over the past six years in improving government financial reporting and transparency, strengthening cash management and extending budget control over off-budget resources (Wong 2018, 2020).
Tax reform has not been nearly as successful. It did see the conversion of the VAT to a consumption type, as well as its extension to services, eliminating a longstanding distortion in the economy. Minor adjustments were also made to resource taxes in 2018—19, but the long-awaited property tax which would greatly assist local government is still sitting in the legislative docket.
Most disappointingly, little progress has been made on intergovernmental fiscal reform.
Progress on intergovernmental fiscal reform
To address the imbalance in the intergovernmental fiscal system, the authorities had made clear that the adjustments would be made on the expenditure side—by recentralising some expenditures while leaving the revenue division largely unchanged. The Third Plenum Decisions called for the central government to take on more responsibility for social security and major infrastructure with interregional span, as well as provide more transfers to help in financing local public services that have significant externalities or interregional impact, such as education and health (Article 19; see also Xi 2013). The Third Plenum Decisions also called for revamping the system of intergovernmental transfers to reduce waste and improve their effectiveness (Article 17).
To date, the three key documents on intergovernmental fiscal reform are: (1) the State Council Guiding Opinions on Promoting the Division of Central and Local Fiscal Responsibilities (State Council Document No. 49, 2016); (2) the 13th Five-Year Plan for Advancing the Equalisation of Basic Public Services (State Council Document No. 9, 2017); and (3) the Reform Plan for the Division of Shared Expenditure Responsibilities between the Central and Local Governments in Basic Public Services (State Council Document No. 6, 2018).
The 2016 document laid out some general principles for the division of expenditure responsibilities that divide public services into three groups: those that are central government responsibilities (e.g. national defence and diplomacy), local government responsibilities (e.g. public safety, urban transport and facilities, and rural roads), and shared responsibilities. The document called for ‘appropriately’ increasing the share of those under central responsibility while reducing those under shared responsibility. For the large number of shared tasks, in education, health, social security and environmental protection, etc., it called for breaking them down into subtasks and clarifying the division of responsibilities to avoid shirking.
This roadmap calls for functional ministries and provinces to work out the appropriate divisions within their areas of competency and sets a timeframe for the work to be completed. The ministries of defence, national security, foreign affairs and public security were assigned to take the lead in launching the reform in 2016, to be followed by the ministries of education, health, environmental protection, and transport and communications in 2017 and 2018. By 2019–20, the assignment of responsibility was to be completed for the main public services, and provinces to have formulated their plans for clarifying divisions with sub-provincial levels.
In January 2017 the State Council issued the 13th Five-Year Plan (FYP) for equalisation of public services. Following the trajectory of gradually increasing government spending on public services and improving access for all citizens, first introduced in the 11th FYP, the 2017 plan goes further. For the first time, it declares the provision of basic public services to be a core duty of government, and access to these services to be the right of every citizen (see, for example, Xinhua 2017). The plan creates a framework for the provision of these core public services by defining the scope of the government’s commitment, the target beneficiaries and the mechanisms for implementation. It establishes a national list of services in eight areas: education, labour and employment, social security, healthcare, social welfare, housing assurance, culture and sports, and services for the disabled. These are broken down into 81 subtasks, with 8 in education, 10 in labour and employment, 7 in social security, etc. For each of the 81 tasks, the list identifies the intended beneficiaries and specifies the suggested standard of provision, lead agencies responsible and financing responsibilities (State Council 2017:Appendix 1). Among the 81, 10 are designated as shared responsibilities, with specific shares assigned to the central and local governments. The remainder are primarily local government responsibilities, sometimes with central government assistance provided ‘as appropriate’. Since the list is presumably the outcome of consultation and negotiation with all the relevant ministries, its issuance completes much of the work called for in the 2016 document for delineating authorities and responsibilities and provides a clear framework for working out expenditure needs for local governments.
Without waiting for the ministries to issue guidelines in their functional areas, in February 2018 the State Council issued the Reform Plan for the Division of Shared Expenditure Responsibilities between the Central and Local Governments in Basic Public Services (Document No. 9). Drawing from the national list of basic public services and following the principle laid out in the 2016 document, the plan names 8 public services as shared responsibilities between the central and local governments and sets out the national minimum standards of provision and cost-sharing ratios for 18 subtasks (Table 8.1). It promises that services on the national list but not included may be added in future as economic and social development warrants. The plan also divides the 36 provincial and ‘semi-provincial’ units into five groups for cost-sharing designations, replacing the longstanding regional divisions of ‘east’, ‘central’ and ‘west’ (Table 8.2).
Table 8.1: List of central and local government shared tasks in basic public services, basic standards and division of expenditure responsibilities.
|
Shared tasks |
Basic standards |
Expenditure responsibilities and sharing method |
|
|
Compulsory education |
1. Non-personnel running cost guarantee |
National standards set by central government. |
Central–local shares:
|
|
2. Free textbooks |
National standards set by central government for the national curriculum, textbooks and dictionaries. |
100% central finance for textbooks for the national curriculum and dictionaries; local finance for textbooks for the local curriculum. |
|
|
3. Living allowance for students with financial difficulties |
National standards set by central government for living. |
Central–local share 5:5 for all provinces. |
|
|
Central government bears 100% for students from ethnic minorities with a small population. |
|||
|
4. Nutritional subsidies for students in poor areas |
National standards set by central government for meal subsidies. |
100% central for the national pilot program; local pilot programs by local finance, with some central government capitation bonuses. |
|
|
Student assistance |
5. National grants for secondary vocational education |
National standards set by central government. |
Central and local governments share proportionally, with sharing rates determined by the student’s originating province: Tier I: 8:2; Tier II: 6:4; Tier III: 5:5; Tier IV: 3:7; Tier V: 1:9. |
|
6. Free tuition subsidy for secondary vocational education |
National standards set by central government, and local governments can determine specific subsidy standards based on actual conditions. |
Central and local governments share proportionally, with sharing rates determined by the student’s originating province: Tier I: 8:2; Tier II: 6:4; Tier III: 5:5; Tier IV: 3:7; Tier V: 1:9. |
|
|
7. National bursary for general high school education |
National standards set by central government, and local governments can set tiered standards according to local conditions. |
Central and local governments share proportionally: Tier I: 8:2; Tier II: 6:4; Tier III: 5:5; Tier IV: 3:7; Tier V: 1:9. |
|
|
8. Free tuition and fee subsidies for general high school education |
Central government sets different subsidy standards from province to province, and local governments can determine specific standards based on local conditions. |
Central and local governments share proportionally for the agreed standards: Tier I: 8:2; Tier II: 6:4; Tier III: 5:5; Tier IV: 3:7; Tier V: 1:9. |
|
|
Basic employment services |
9. Basic public employment services |
Standards are formulated by local governments based on actual conditions. |
Mainly based on local fiscal capacity and number of people in need. |
|
Basic old age insurance |
10. Basic pension scheme for urban and rural residents |
National standards set by central government. |
100% central for Tier I and II provinces, 5:5 for all others. |
|
Basic medical insurance |
11. Basic medical insurance scheme for urban and rural residents |
Central government sets guiding subsidy standards, and local governments set specific standards based on actual conditions. |
Central–local shares: Tier I: 8:2; Tier II: 6:4; Tier III: 5:5; Tier IV: 3:7; Tier V: 1:9. |
|
12. Medical assistance |
Standards set by local governments based on actual conditions. |
Mainly based on local fiscal capacity and number of people in need. |
|
|
Basic health and family planning |
13. Basic public health services |
National standards set by central government. |
Central–local shares: Tier I: 8:2; Tier II: 6:4; Tier III: 5:5; Tier IV: 3:7; Tier V: 1:9. |
|
14. Family planning assistance guarantee |
National standards set by central government. |
Central–local shares: Tier I: 8:2; Tier II: 6:4; Tier III: 5:5; Tier IV: 3:7; Tier V: 1:9. |
|
|
Social assistance |
15. Relief for the needy |
Standards set by local governments based on actual conditions. |
Mainly based on local fiscal capacity and number of people in need. |
|
16. Relief for victims of disasters |
The central government sets subsidy standards, and local governments set specific subsidies based on actual conditions. |
Central government provides subsidies, with the remainder borne by local finance. |
|
|
17. Services for persons with disabilities |
Standards set by local governments based on actual conditions. |
Mainly based on local fiscal capacity and number of people in need. |
|
|
Basic housing security |
18. Urban and rural affordable housing projects (including rural dilapidated houses renovation) |
Standards set by local governments based on actual conditions. |
Mainly based on local fiscal capacity and number of people in need. |
Source: State Council (2018:Appendix).
Table 8.2: The classification of budgetary units (2017).
|
Old designation |
New designation |
Number of provinces/cities |
Group members |
Per capita GDP as share of national average |
Per capita budget revenue as share of national average |
|
West |
Tier I |
12 |
Inner Mongolia, Guangxi, Chongqing, Sichuan, Guizhou, Yunnan, Tibet, Shaanxi, Gansu, Qinghai, Ningxia and Xinjiang |
75% |
70% |
|
Central |
Tier II |
10 |
Hebei, Shanxi, Jilin, Heilongjiang, Anhui, Jiangxi, Henan, Hubei, Hunan and Hainan |
78% |
65% |
|
East |
Tier III |
3 |
Liaoning, Fujian and Shandong |
114% |
87% |
|
Tier IV |
9 |
Tianjin, Jiangsu, Zhejiang, Guangdong, and five cities Dalian, Ningbo, Xiamen, Qingdao and Shenzhen |
164% |
157% |
|
|
Tier V |
2 |
Beijing and Shanghai |
211% |
364% |
Source: State Council (2018). Calculations based on NBS (2018).
Loud thunder, small drops of rain
Coming 13 months after the 13th FYP document on the equalisation of public services, the 2018 reform plan seems a lost opportunity. Rather than further building momentum for rebalancing the intergovernmental relationship, the plan largely formalised current divisions, signalling a pause in intergovernmental reform. Its issuance has had no effect on raising the central government’s share in spending, which has continued its downward trend, slipping from 14.8 per cent in 2018 to 14.7 per cent in 2019 and 14.3 per cent in 2020.2
Contrary to official rhetoric that portrays the greater differentiation of provinces as a change toward greater equalisation (Ifeng 2018), this change favours the rich provinces, and makes the central–local cost-sharing less redistributive than before. A close examination of the sharing rates for the 18 listed services finds them largely unchanged from prior practice, with one important exception. For the tier I and tier II provinces—the former ‘western’ and ‘central’ provinces—the sharing rates are across-the-board unchanged for the major expenditures. For example, the sharing rates for compulsory education (Table 8.1, items 1, 2 and 3) were established in 2007 (Lin and Wong 2012); those for student assistance (items 5 and 6) were set in 2012 (MOE 2012), and for the Residents’ Basic Medical Insurance Scheme (item 11) in 2014 (MOF 2014c). For these provinces, the reform merely codified current practice. The exception is in the tier III, IV and V provinces—the three groups broken out from the former ‘eastern’ provinces—where the central government’s sharing rates have increased for many services for which these provinces had previously received little or no support.
In terms of the effort to clarify and codify the division of central–local responsibilities, the limited scope of the 2018 plan only serves to highlight the huge task ahead. Following the plan’s rollout, a new category of ‘transfer payments for shared fiscal responsibilities’ was created in 2019, which listed transfers for 54 services. The 18 subtasks listed in the plan were represented among 12 of the 54, and together accounted for slightly less than half of the total ‘shared responsibility transfers’.3 Confusingly, transfers for the shared responsibilities were only 43 per cent of total transfers net of tax rebates, implying that more than half of the transfers in 2019 were provided for expenditures for which the central government had no responsibility—including many of the environmental protection expenditures. At the same time, the cost-sharing ratios are sometimes misleading. The RMB156.5 billion ‘Urban and Rural Compulsory Education Transfer’ covered only 10.3 per cent of the RMB1.5 trillion total budgetary spending by local governments on compulsory education in 2019, far less than the sharing ratios implied in Table 8.1.4 Given that the central government increasingly sets national standards for service provision, and with three-quarters of all transfers in China set on a discretionary basis, the narrow scope of the 2018 reform signals the central government’s reluctance to cede financial control.5
Most disappointingly, the reform plan made no mention of the assignment of responsibility for capital investments needed for the provision of public services—schools, clinics, hospitals, roads and the like. The heavy responsibility for financing infrastructure and the restrictions on borrowing had in past decades driven local governments to rely on land revenues and off-budget borrowing through financial vehicles, a practice that current budgetary reforms aim to curb. The omission of this critically important area of shared responsibility, in the absence of new revenue assignments, leaves local governments in the same predicament and exposed to the same financial risks as before.
Local government fiscal status today
Since the start of the Xi Jinping era, the fiscal position of local governments has deteriorated. The first cause is the changing macro-economic environment and associated fiscal policies. After a decade of double-digit growth, the Chinese economy began to slow down markedly after 2010 (Table 8.3). Revenue growth fell even more sharply, to less than one-half of the level during the previous decade. This was followed by a pullback in expenditure growth to keep the deficit within an acceptable band—this is shown in Figure 8.1, where the long fiscal expansion (measured as revenue and expenditure as a share of GDP) that had begun even before 2000 flattened out, and then ended in 2015. Thereafter both budget revenues and expenditures began to fall (as shares of GDP), and the deficit widened to 5 per cent in 2019.
Table 8.3: Slowing economic growth and fiscal trends under the ‘new normal’.
|
Annual growth, price-adjusted |
GDP |
Revenue |
Expenditure |
|
2000–2010 |
12.8% |
17.5% |
16.4% |
|
2010–2019 |
7.5% |
7.0% |
8.7% |
|
2010–2015 |
7.8% |
9.8% |
11.3% |
|
2015–2019 |
7.1% |
3.5% |
5.7% |
Source: Author’s calculations from National Bureau of Statistics (NBS) data.

Figure 8.1: Fiscal expansion goes into reverse.
Source: Author’s calculations from NBS data.
The sharp slowdown in revenue growth since 2015 was in large part due to a series of tax cuts and tax changes that marked the incomplete tax reform phase. The conversion of the VAT to a consumption-type VAT in 2016 allowed for expenses for investment goods to be deducted. This welcome change was estimated to cost RMB900 billion over two years, or roughly 1 per cent of GDP (Zhang 2013). The VAT was also extended appropriately to cover services, replacing business tax, but concessions made in the transition have also reduced the tax base.6 Several tax cuts followed. In 2018 the top VAT rate was reduced from 17 per cent to 16 per cent, and further to 13 per cent in April 2019 (State Taxation Administration 2019). The threshold for the personal income tax was raised in October 2018 from RMB3,500 to RMB5,000 per month, and generous deductions were introduced in January 2019 that further cut tax receipts.7 Altogether cuts in taxes and fees totalled more than RMB7.6 trillion over the period 2016–2020, with RMB4.7 trillion in tax cuts (MOF 2021a). The combination of slower economic growth and tax cuts have reduced revenue buoyancy to below 1 for the 2010–19 period, where revenue growth was less than GDP growth for the first time since the mid-1990s.
Tax cuts have affected local revenues in particular, especially the recent cuts favouring small and medium enterprises that are a larger share of local tax bases in the smaller cities and towns.8 In aggregate, local revenue growth lagged overall revenue growth during 2015–2019, in contrast to previous periods of fiscal expansion until 2015, when local revenues had grown faster than total revenues (Table 8.4, panel A), as did local expenditures (panel B). This was reversed after 2015, when both local revenues and local expenditures lagged. The growth in transfers (panel C) slowed even more rapidly, further squeezing local governments.
Table 8.4: Recent changes in revenue, expenditure, and transfers (annual growth, price-adjusted).
|
Panel A: Revenues |
Panel B: Expenditures |
Panel C: Net transfers |
|||||
|
Total |
Central |
Local |
Total |
Central |
Local |
||
|
2000–2010 |
20.0% |
19.8% |
20.3% |
18.9% |
11.2% |
21.7% |
26.8% |
|
2010–2015 |
12.9% |
10.3% |
15.4% |
14.4% |
9.8% |
15.3% |
13.1% |
|
2015–2019 |
5.7% |
6.6% |
5.0% |
8.0% |
8.3% |
7.9% |
5.9% |
Source: Author’s calculations from NBS data.
The effect of budget reform and the central government’s policy pivot
While the slowdown in transfers was in part driven by the slowdown in revenues, the sharp downturn reflects a pivot in the central government’s willingness to fund local expenditures. During the Hu–Wen administration, the rebalancing of government spending toward public services had raised the share of budget expenditures by local governments from 65 per cent to 85 per cent of total expenditure during 2000–2012. To provide financing, transfers grew rapidly, from RMB254 billion to RMB4 trillion, at a rate exceeding that of both central revenues and local expenditures by a sizeable margin (Table 8.4). By 2012 transfers absorbed 70 per cent of central government revenues, up from 35 per cent, and were trending upward. The fact that most (70 per cent) of these had to be passed down from the centre through the provinces and prefectures to get to the counties and districts placed great strain on the bureaucracy, far outstripping the capacities of the monitoring and supervisory systems. The result was that the remarkable achievement of building a fairly comprehensive social welfare system and world-class infrastructure to support China’s miracle growth was marred by growing waste, inefficiencies, rampant corruption and a mountain of local government debt.
The upward trend in transfers changed after 2012, when the central government held transfers to around 70 per cent of central revenues throughout the 2012–2019 period (Figure 8.2). As a result, even with local spending slowing sharply after 2015, transfers were funding a declining share of it—falling from a peak of 39 per cent in 2009 to 31 per cent in 2019.
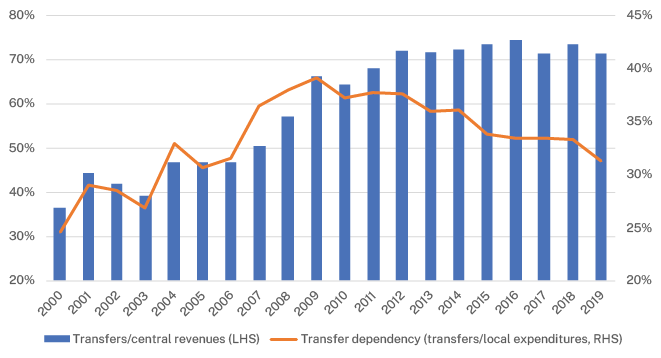
Figure 8.2: Central government transfers and local government transfer dependency.
Source: Author’s calculations from NBS data.
The tightening of transfers was also driven by budget reforms that aimed to improve budget execution and cash management, as well as make transfers more effective. The rapid proliferation of new programs and transfers during the Hu–Wen era had sometimes left local governments scrambling to keep pace. Audit reports have found widespread problems of slow program implementation and low rates of utilisation of funds, especially with transfers arriving in multiple strands and often late in the year. In Guangdong, for example, an audit of the 2015 provincial budget faulted 21 departments and agencies for low project implementation rates. Among them, the health and family planning commission and the provincial agricultural science academy were singled out for having, between them, nearly 200 programs with disbursement rates of less than 30 per cent at year-end, holding more than RMB600 million in unused funds (Huang 2016). Audit reports also found frequent diversion and misuse of funds, even in the high-profile poverty alleviation program.9
Reining in and mobilising idle balances has been a major focus of budget reform, one strand of which is strengthening Treasury management to ensure local governments reveal the full extent of their fiscal resources. The Budget Law states that all government revenues must be turned over to the state Treasury (Article 50). Since the Treasury Single Account (TSA) was first created in the 1990s, however, the government has struggled to get all fiscal funds and spending routed through the TSA, especially at the subnational levels where local governments often justified keeping special fiscal accounts to hold earmarked funds. In concert with reforms to reduce earmarked transfers and ensure earlier disbursal of funds, the Ministry of Finance (MOF) has pushed harder to shut down fiscal special accounts.10
Other policies affecting local government finances include the commendable program to equalise public services discussed in the previous section, under which rising national standards and joint financing requirements translate into growing burdens for local governments. According to the director of the MOF’s Shandong Commissioner’s Office, in 2017 a prefectural city faced 75 public service mandates whose costs totalled RMB338 million. This was an increase of RMB270 million over a decade, a fivefold increase that far exceeded the prefecture’s revenue growth during the period (Sohu 2019). In a similar vein, one county official complained that rising standards for the rural minimum living stipend program (dibao) had raised its cost from RMB10 million yuan in 2015 to nearly RMB200 million in 2019, equivalent to 50 per cent of the county’s budget (Liaowang weekly 2020).
This extraordinary increase in dibao expenditure was caused by the effort to coordinate with the poverty alleviation program in 2016, under which provincial governments were ordered to raise the standards of dibao provision to match the national poverty threshold, a change that required very large increases in some localities (Wong and Qian 2020b). Since dibao is one of the services listed in the 2018 reform plan without a specified central government share, county governments, which are responsible for program implementation, are at the mercy of higher-level governments to help cover rising costs. A glimpse at how costs can ratchet up so quickly is provided by the example from Jiangxi province, which shows that when transfers fall short, local governments—in this case especially rural governments—are left with big holes to fill (Table 8.5).
Table 8.5: Planned changes in dibao programs in Jiangxi province for 2020.
|
RMB per person/month |
|||
|
2019 |
2020 |
Increase |
|
|
Urban dibao threshold |
640 |
705 |
10.2% |
|
fiscal subsidy |
410 |
450 |
9.8% |
|
gap for local finance |
230 |
255 |
10.9% |
|
Rural dibao threshold |
385 |
470 |
22.1% |
|
fiscal subsidy |
285 |
325 |
14.0% |
|
gap for local finance |
100 |
145 |
45.0% |
Source: Jiangxi Provincial People’s Government (2020), cited in Wong and Qian (2020b), Table 2.
After a decade of fiscal expansion and lavish spending under the Harmonious Society program, it was prudent for reforms in the Xi Jinping era to start with a period of review and consolidation of expenditures. Efficiency savings may be harder to find, though, after several years of hardening budget constraints. As the fulcrum of spending and service provision, county-level governments are bearing the brunt of the fiscal tightening. With the recent tax and fee cuts taking a heavy toll on their revenues, many counties are straining to meet payroll and deliver social services—a situation that was greatly exacerbated by the COVID crisis in 2020.11
The present state of the intergovernmental fiscal system
According to the plan presented by then finance minister Lou Jiwei in 2014, comprehensive reform of the fiscal system should have been completed by 2020. Reforms have fallen far short of that goal, though considerable achievements have been made in building fiscal institutions.
In budgeting and PFM reform, much of the vision laid out by Lou has been realised in form, if not yet completely in practice. These include reining in extra-budgetary resources and extending budget control over fiscal resources segregated in the ‘four budgets’.12 Government financial reporting reforms have brought improved budget transparency and more detailed, standardised reporting. Monitoring and supervision are conducted not only internally by the finance ministry’s supervision department, but also externally by the People’s Congress, the National Audit Commission and the Central Disciplinary and Inspection Commission. Treasury reforms have broken through the level-by-level fragmentation to allow the MOF to monitor the cash balances of county governments.13 These reforms go a long way toward building the mechanisms for tracking how public moneys are spent and holding spending units accountable for results—weaknesses that had been glaringly exposed during the Hu–Wen era.
Reforms to rein in local government borrowing are also beginning to take hold. After several years of cat-and-mouse games where local governments outwitted regulators and continued to borrow outside the debt quotas under various guises including local government financing vehicles (LGFVs), private-public partnerships and procurement contracts, a concerted effort in coordination with financial sector authorities have succeeded in some deleveraging. With tighter budget control and imposition of rules assigning responsibilities for direct and contingent debt to the leading officials and tying them to personnel records, the growth of hidden local government debt appears to have slowed since 2018, and LGFV debt has shrunk (Sun and Tan 2020; He 2021).
Achievements in the ‘phase one’ reforms were intended to pave the way for realignment in central–local relations, with tax reform in phase two delivering some new revenue sources from a property tax and revised resource taxes. Instead, local budgets are being squeezed from all sides. Fiscal difficulties at the county level were the likely culprit in China’s ineffectual social welfare response to the COVID crisis in 2020, when the vast majority of workers suffering economic hardship received no help from the government despite promises of assistance from top leaders. In a close examination of the unemployment and dibao programs, Wong and Qian (2020a, 2020b) found that through the whole year of 2020 the dibao program added only 1.1 million recipients, and the unemployment insurance scheme added only 420,000.

Figure 8.3: Budgetary spending on education, health, social security and housing.
Note: Data for social security and employment are net of expenditures on public sector pensions and those related to the armed forces (demobilisation and resettlement of soldiers, and disability and death benefits).
Source: Author’s calculations from NBS and MOF final accounts (MOF various years).
Data at the macro level suggest that local fiscal problems have begun to depress social spending, with budgetary expenditure on social services as a share of GDP declining between 2016 and 2019 (Figure 8.3). This trend threatens to undermine the government’s goals of improving public services and rebalancing the economy toward consumption during the 14th Five-Year Plan. If continued, it could return the state of intergovernmental fiscal relations to where it was in the 1990s, when local fiscal difficulties were an impediment to national policy implementation (World Bank 2002).
As for local government debt: stopping the growth of off-budget debt is an important but unsustainable achievement. The huge stock of debt—estimated to total 46–75 per cent of GDP—remains a heavy burden on local finances that necessitates continued borrowing, both on- and off-budget, for the vast majority of localities that lack the resources to repay.14 The former minister Lou Jiwei warned that the next five years will be the peak maturity period for urban investment bonds, and as many as one-quarter of the provinces will face debt servicing costs (principal repayment and interest) exceeding 50 per cent of their revenues (Lou 2020). With local finances under growing stress, defaults of local state-owned enterprises and financial vehicles may soon emerge as financial risks to the economy.
References
Cheng Siwei (2019). ‘What to do to make ends meet? Local governments find their own way’, Caixin, 27 July 2019. Accessed 12 April 2020. Available at: weekly.caixin.com/2019-07-27/101444418.html (in Chinese).
He, Wei (2021). ‘The next steps on hidden local debt’, GaveKal Dragonomics, 16 February 2021.
Hu Zejun (2018). ‘Report of the State Council on the rectification of problems found in the central budget implementation and other fiscal revenue and expenditure audits in 2017’, Central Government of China website, 24 December 2018. Accessed 2 November 2019. Available at: www.gov.cn/xinwen/2018-12/24/content_5351524.htm (in Chinese).
Huang Lina (2016). ‘Guangdong Provincial Audit Department: 4138 public rental houses in a city have been vacant for over one year’, Yangcheng Evening News, 26 July 2016. Accessed 31 July 2016. Available at: www.chinanews.com/gn/2016/07-26/7952050.shtml (in Chinese).
Ifeng (2018). ‘Ifeng finance’. Accessed 11 February 2018. Available at: finance.ifeng.com/a/20180211/15982208_0.shtml (in Chinese; site discontinued).
IMF (International Monetary Fund) (2021). People’s Republic of China: 2020 Article IV consultation staff report. International Monetary Fund. Accessed 5 June 2021. Available at: www.imf.org/en/Publications/CR/Issues/2021/01/06/Peoples-Republic-of-China-2020-Article-IV-Consultation-Press-Release-Staff-Report-and-49992.
Jiangxi Provincial People’s Government (2020). ‘解读《2020年民生实事工程安排方案》’ (Explaining the ‘2020 People’s Livelihood Project Arrangement Plan’), Jiangxi Provincial People’s Government website. Accessed 12 September 2020. Available at: www.jiangxi.gov.cn/art/2020/2/13/art_14236_1508869.html (in Chinese).
Liaowang weekly (2020). ‘Red lights flashing on county treasury accounts’, Liaowang weekly, 2 May 2020. Accessed 11 May 2020. Available at: news.sina.com.cn/c/2020-05-02/doc-iircuyvi0946886.shtml (in Chinese).
Lin, Wanlong and Christine Wong (2012). ‘Are Beijing’s equalization policies reaching the poor? An analysis of direct subsidies under the “three rurals” (Sannong)’, The China Journal 67:23–46. doi.org/10.1086/665738.
Liu Kun (2019). ‘Report on the 2018 central final accounts’, Ministry of Finance website, 27 June 2019. Accessed 7 July 2019. Available at: www.mof.gov.cn/zhengwuxinxi/caizhengxinwen/201906/t20190627_3286107.htm (in Chinese).
Lou Jiwei (2020). ‘Fiscal reform and development toward 2035’. Speech at the Fifth Forum on Finance and National Governance and the 40th Anniversary Seminar of ‘Fiscal Research’, 22 December 2020. Accessed 3 March 2021. Available at: finance.sina.com.cn/china/gncj/2021-02-09/doc-ikftssap5019447.shtml (in Chinese).
MOE (Ministry of Education, China) (2012). ‘Opinions on expanding the scope of the Secondary Vocational Education Tuition Free policy and further improving the National Scholarship System’, Ministry of Education website. Accessed 25 April 2021. Available at: www.moe.gov.cn/jyb_xxgk/moe_1777/moe_1779/201210/t20121030_143848.html (in Chinese).
MOF (Ministry of Finance, China) (various years). Final accounts for National Public Budgets. Published annually. Ministry of Finance website. Accessed 13 December 2022. Available at: yss.mof.gov.cn/caizhengshuju/ (in Chinese).
MOF (Ministry of Finance, China) (1993–2009). Compendium of local fiscal statistics (difang caizheng tongji ziliao). Published annually: issues from 1993 to 2009. Beijing.
MOF (Ministry of Finance, China) (2010–21). Finance yearbook of China (zhongguo caizheng nianjian). Published annually: issues from 2010 to 2021. Beijing.
MOF (Ministry of Finance, China) (2014a). ‘Decision of the Standing Committee of the National People’s Congress on amending the Budget Law of the People’s Republic of China’. Ministry of Finance website. Accessed 28 June 2021. Available at: www.mof.gov.cn/zhengwuxinxi/caizhengxinwen/201409/t20140901_1133762.htm (in Chinese).
MOF (Ministry of Finance, China) (2014b). Ministry of Finance website. Accessed 4 September 2018. www.mof.gov.cn/zhengwuxinxi/caizhengxinwen/201410/t20141008_1146864.html (in Chinese; site discontinued).
MOF (Ministry of Finance, China) (2014c). ‘Notice on improving the funding standards for new rural cooperative medical care and basic medical insurance for urban residents in 2014’, Ministry of Finance website. Accessed 28 April 2021. Available at: sbs.mof.gov.cn/zhengcefabu/201405/t20140527_1084649.htm (in Chinese).
MOF (Ministry of Finance, China) (2019). ‘Transfer payments in General Public Budget from central government to local governments’, Ministry of Finance website. Accessed 1 August 2020. Available at: yss.mof.gov.cn/2019qgczjs/202007/t20200706_3544608.htm (in Chinese).
MOF (Ministry of Finance, China) (2021a). ‘How to speed up the establishment of a modern fiscal and taxation system during the “14th Five-Year Plan”?—An authoritative interpretation from the Ministry of Finance’, Ministry of Finance website. Accessed 9 April 2021. Available at: www.mof.gov.cn/zhengwuxinxi/caijingshidian/xinhuanet/202104/t20210408_3682731.htm (in Chinese).
MOF (Ministry of Finance, China) (2021b). ‘Table of general debt balance of local governments in 2020 and 2021’, Ministry of Finance website. Accessed 9 June 2021. Available at: yss.mof.gov.cn/2021zyys/202103/t20210323_3674864.htm (in Chinese).
NBS (National Bureau of Statistics, China) (2018). China statistical yearbook. Published annually. China Statistics Press, Beijing.
NPC (National People’s Congress) Standing Committee (2014). Decision on revising the ‘People’s Republic of China Budget Law’, NPC of the People’s Republic of China, Beijing, 31 August 2014. Accessed 7 November 2022. Available from: www.npc.gov.cn/npc/xinwen/2014-09/01/content_1877061.htm (in Chinese).
Sohu (2019). ‘With nearly 60 per cent of the counties in financial difficulties, will the Real Estate Tax be a “life-saving straw”?’ (近六成县级财政困难, 房地产税能为”救命稻草”). Accessed 28 April 2023. Available at: www.time-weekly.com/wap-article/259279.
State Council (China) (2016). State Council guiding opinions on promoting of the division of central and local fiscal responsibilities, Document No. 49. Accessed 22 April 2021. Available at: www.gov.cn/zhengce/content/2016-08/24/content_5101963.htm (in Chinese).
State Council (China) (2017). The 13th Five-Year Plan to promote the equalisation of basic public services, Document No. 9. Accessed 24 April 2021. Available at: www.gov.cn/zhengce/content/2017-03/01/content_5172013.htm (in Chinese).
State Council (China) (2018). Reform plan for the division of shared expenditure responsibilities between the central and local governments in basic public services, Document No. 6. Accessed 21 April 2021. Available at: www.gov.cn/zhengce/content/2018-02/08/content_5264904.htm (in Chinese).
State Taxation Administration (China) (4 November 2019). ‘Financial Director of Private Enterprises: Me and this year of tax cuts and fee reductions’, State Taxation Administration website. Accessed 12 April 2021. Available at: www.chinatax.gov.cn/chinatax/n4016721/c5140976/content.html (in Chinese).
Sun Binbin and Tan Yiming (2020). ‘How to resolve hidden debts and how is the progress?’ Tianfeng Research, 4 September 2020. Accessed 4 January 2021. Available at: zhuanlan.zhihu.com/p/215419428 (in Chinese).
Wang Dehua and Liu Lipin (2019). ‘Local hidden debt and risk resolution’, China Finance (中国金融) 22. Accessed 7 June 2021. Available at: ipft.ruc.edu.cn/xzgd/128f7aed4ccd49d7928e4b288252ecc0.htm (in Chinese).
Wong, Christine (2018). ‘An update on fiscal reform’, in Ross Garnaut, Ligang Song and Cai Fang (eds), China’s forty years of reform and development: 1978–2018, ANU Press, Canberra. Accessed 7 November 2022. doi.org/10.22459/CYRD.07.2018.15.
Wong, Christine (2020). ‘Uncovering China’s fiscal stimulus policies in the budget report’, EAI Commentary 16, 6 July 2020. East Asian Institute, National University of Singapore, Singapore.
Wong, Christine (2021). ‘China’s post-Covid Goldilocks budget—how big should it be?’, EAI Commentary 27, 18 March 2021. East Asian Institute, National University of Singapore, Singapore.
Wong, Christine and Jiwei Qian (24 December 2020a). ‘COVID-19 highlights need to strengthen China’s social safety net (i): The unemployment insurance scheme’, EAI Background Brief No. 1572. East Asian Institute, National University of Singapore, Singapore.
Wong, Christine and Jiwei Qian (2020b). ‘COVID-19 highlights need to strengthen China’s social safety net (ii): The social assistance programmes’, EAI Background Brief No. 1573. East Asian Institute, National University of Singapore, Singapore.
World Bank (2002). China: National development and subnational finance, a review of provincial expenditures. World Bank, Washington DC.
Xi Jinping (2013). ‘An explanation of the Chinese Communist Party Central Committee decision on several major questions about deepening reform’, Xinhua, 15 November 2013. Accessed 7 November 2022. Available from: news.xinhuanet.com/politics/2013-11/15/c_118164294.htm (in Chinese).
Xinhua (2014). ‘The Minister of Finance explained in detail the overall plan for deepening the reform of the fiscal and taxation system’, Central Government of China website, 3 July 2014. Available at: www.gov.cn/xinwen/2014-07/03/content_2711811.htm (in Chinese).
Xinhua (2017). ‘Our country launches the list of national basic public services for the first time’, Xinhua, 1 March 2017. Accessed 24 April 2021. Available at: www.gov.cn/xinwen/2017-03/01/content_5172329.htm (in Chinese).
Zhang Jing (2013). ‘Lou Jiwei outlines direction of tax reform and the slight change in central-local fiscal relations’, Yicai Daily, 26 July 2013. Accessed 10 April 2020. Available at: www.yicai.com/news/2013/07/2890331.html (in Chinese; site discontinued).
Zhao Jianhua (2020). ‘China’s tax and fee cuts will exceed 2.3 trillion yuan in 2019’, China News Network, 10 February 2020. Accessed 13 April 2021. Available at: m.chinanews.com/wap/detail/zw/cj/2020/02-10/9086173.shtml (in Chinese).
1 An earlier version of this chapter was published as EAI Background Brief No. 1599, 9 July 2021, East Asian Institute, National University of Singapore. I thank Andrew Podger for excellent editorial suggestions. All remaining errors are my sole responsibility.
2 Calculated from NBS and 2021 Budget Report to the NPC.
3 The amount of transfers for the 18 subtasks cannot be calculated exactly with current available information. The categories are broader in the transfers classification, so that the 18 subtasks fit under 12 transfer categories but are not always the whole category (MOF 2019).
4 Calculated from MOF final accounts. The main reason the share is so low is that salary payments are not included in this category of transfers.
5 Aside from tax rebates, which are excluded from net transfers, only the equalisation transfer (approximately 25 per cent of net transfers), has a dedicated revenue source—the corporate income tax receipts of the central government. All other transfers are at the discretion of the central government.
6 These include reduced rates of 10 per cent and 13 per cent for agriculture and construction, respectively.
7 Receipts of personal income tax were expected to fall by more than 25 per cent in 2019 (Zhao 2020).
8 Officials in a county in Hunan estimated that the 2019 tax and fee cuts would cut 13.5 per cent from county revenues, compared to an expected reduction of 10 per cent at the national level, and 11 per cent at the provincial level (Cheng Siwei 2019).
9 See, for example, Auditor-General Hu Zejun’s report to the NPC Standing Committee on the rectification of problems identified in the 2017 central budget implementation, 24 December 2018 (Hu 2018).
10 In MOF’s estimate, even after shutting down 74,000 accounts, more than 150,000 remained in 2014 (Ministry of Finance 2014b).
11 Official statements began calling on provinces to ensure more fiscal resources are assigned to the lower levels. See, for example, Finance Minister Liu Kun’s report on the 2018 final accounts (Liu 2019). During 2020 emphasis was shifted to prioritising the ‘three guarantees’.
12 The four budgets are the general budget, Government Fund budget, State Capital Operating budget (SCOB) and Social Security Fund (SSF) budget. Since 2015, a number of government funds (GFs) have been abolished and their revenue streams moved into the general budget; sunset clauses have been placed on balances in the remaining funds, with ‘expired’ balances swept into the budget; and the share of the SCOB remitted to the general budget has been incrementally raised to 30 per cent by 2020. Even after these changes, RMB3 trillion, equal to 35 per cent of the combined revenues of the GF and SCOB, were moved into the budget in 2020 to finance the deficit spending for the stimulus program. In addition, the stimulus measures offered waivers of social security contributions that cut revenues to the Social Security Fund by some RMB1.7 trillion (Wong 2021).
13 This is one of the tools MOF uses to ensure local governments have sufficient funds to meet payroll expenses. See, for example, ‘Red lights flashing on county treasury accounts’, Liaowang weekly (2020).
14 Estimates of hidden debt range from 21 per cent of GDP to 50 per cent (Wang and Liu 2019; IMF 2021). Official debt was RMB25.7 trillion at year-end 2020, or 25.2 per cent of GDP (MOF 2021b).
Previous